Report 218 Richard D. Preston | July 1978
Figures (all figures are jpeg format)
- Report 218 - Occurrence and Quality of Ground Water in Baylor County, Texas
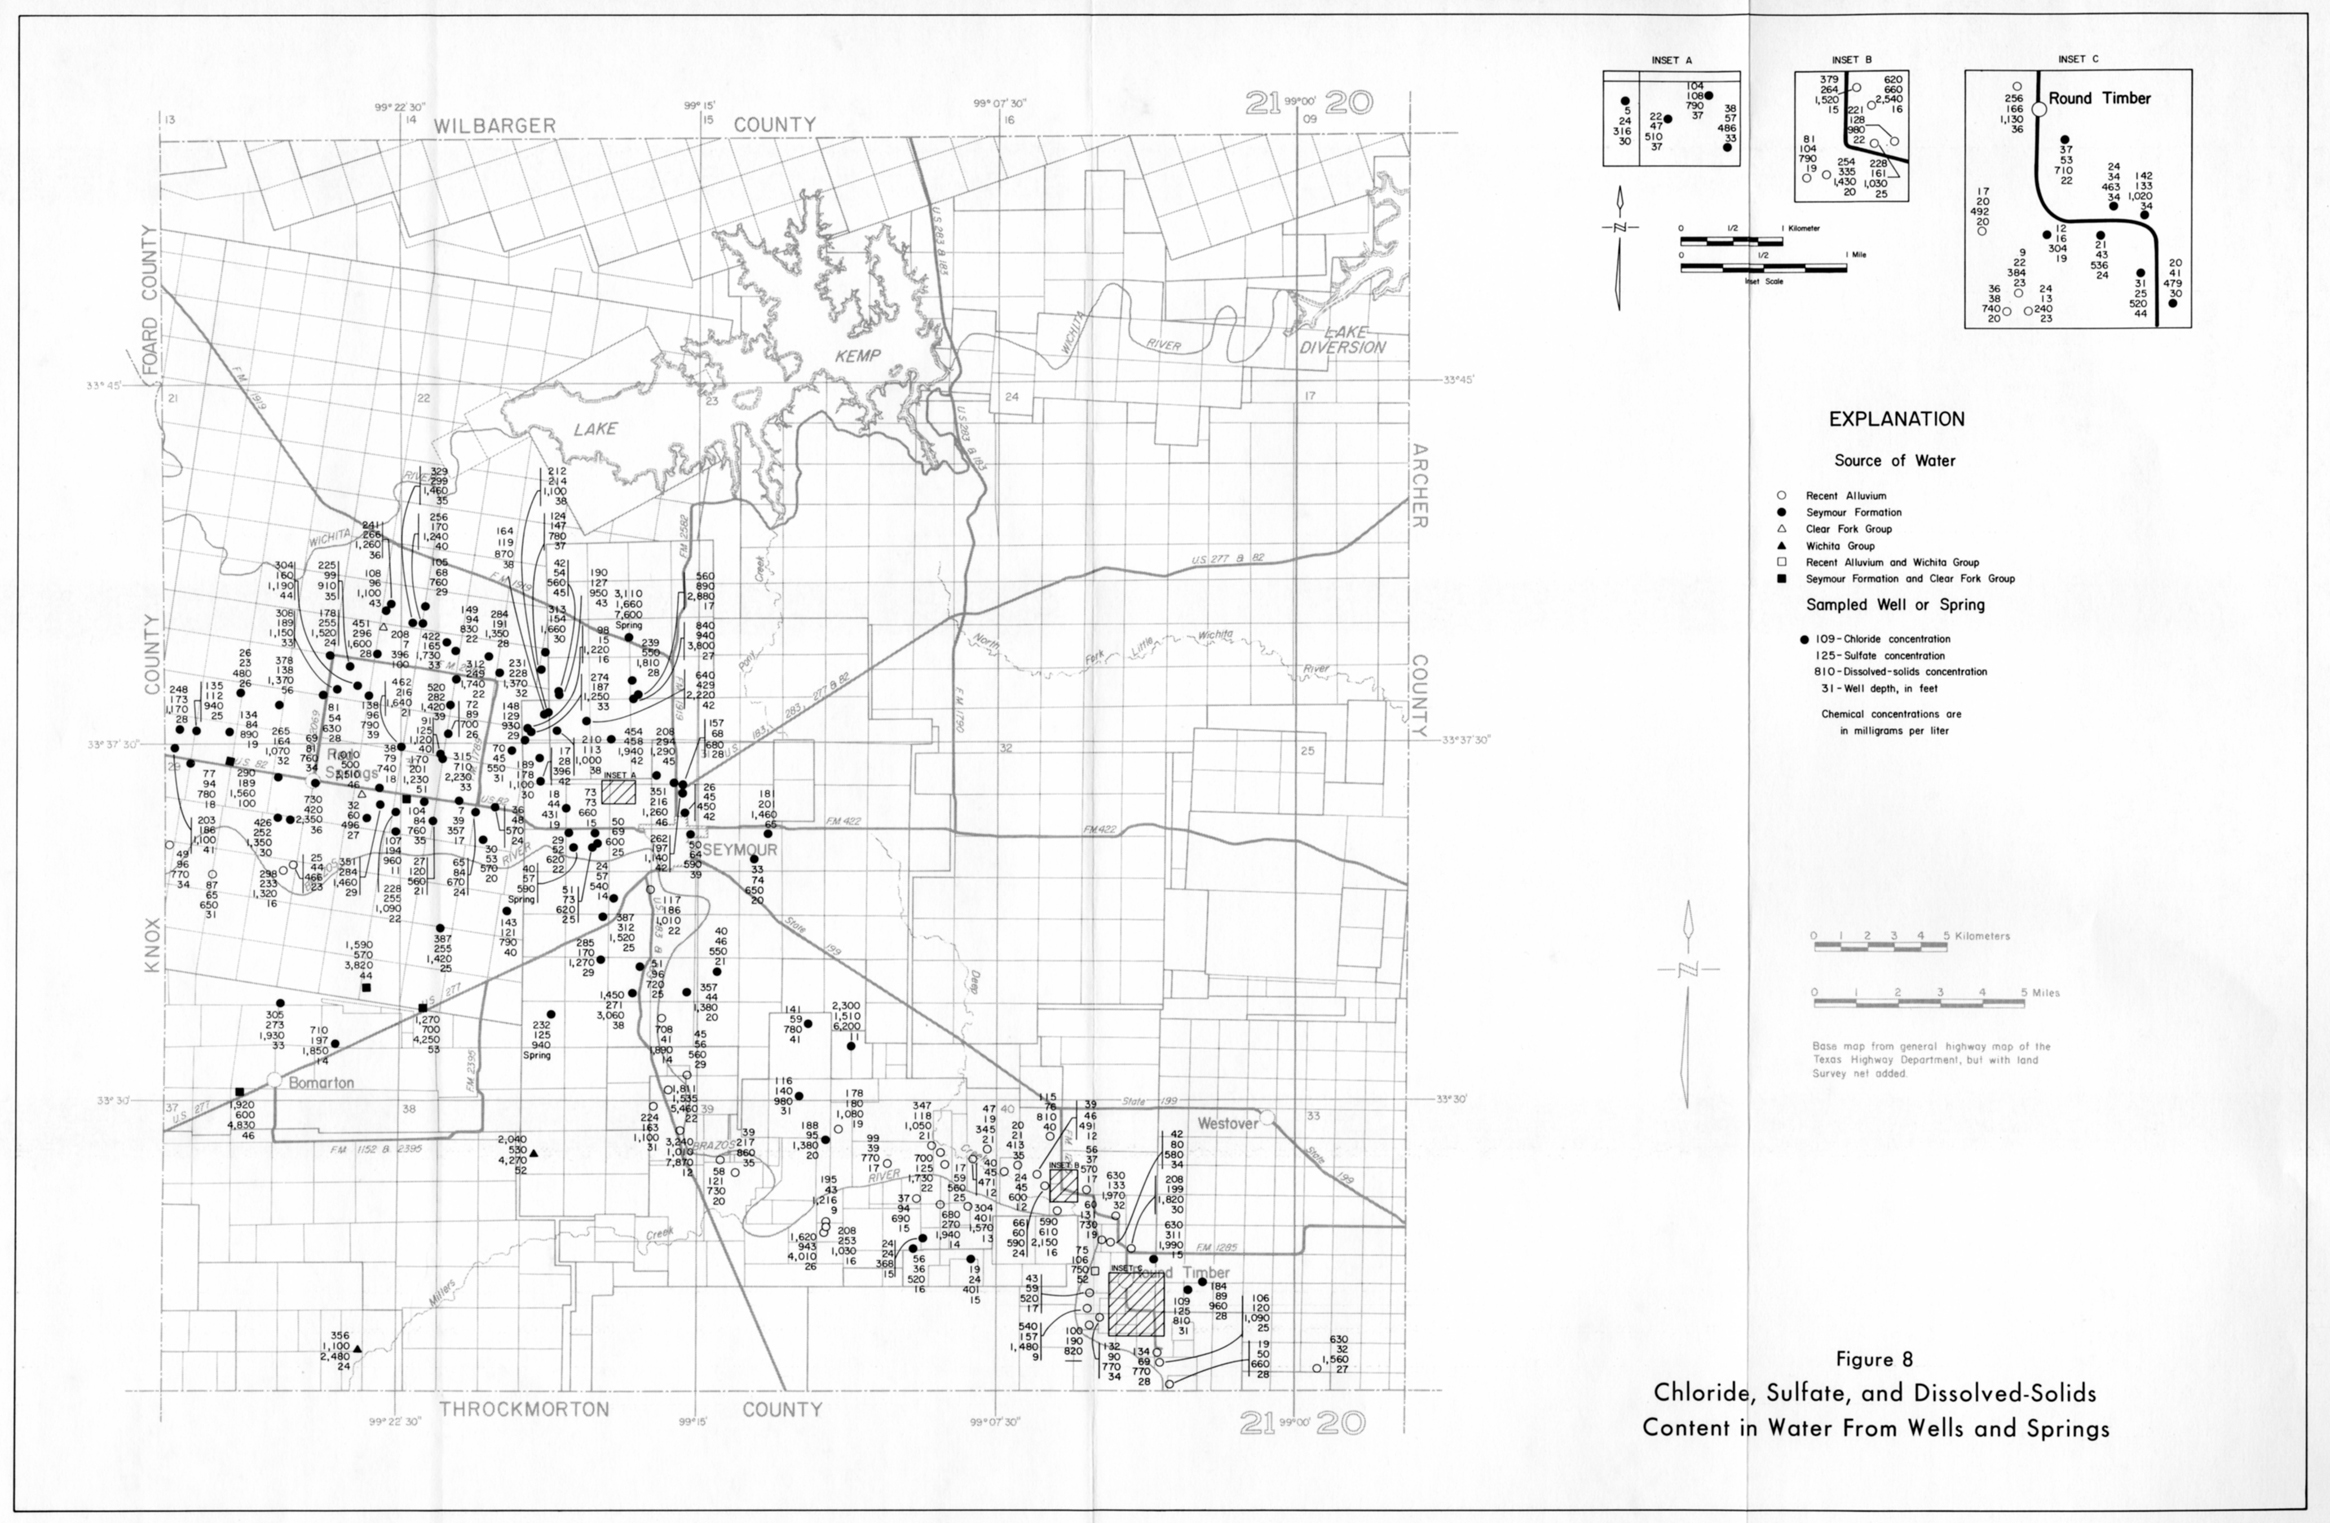
- Figure 8: Chloride, Sulfate, and Dissolved Solids Content in Water from Wells and Springs
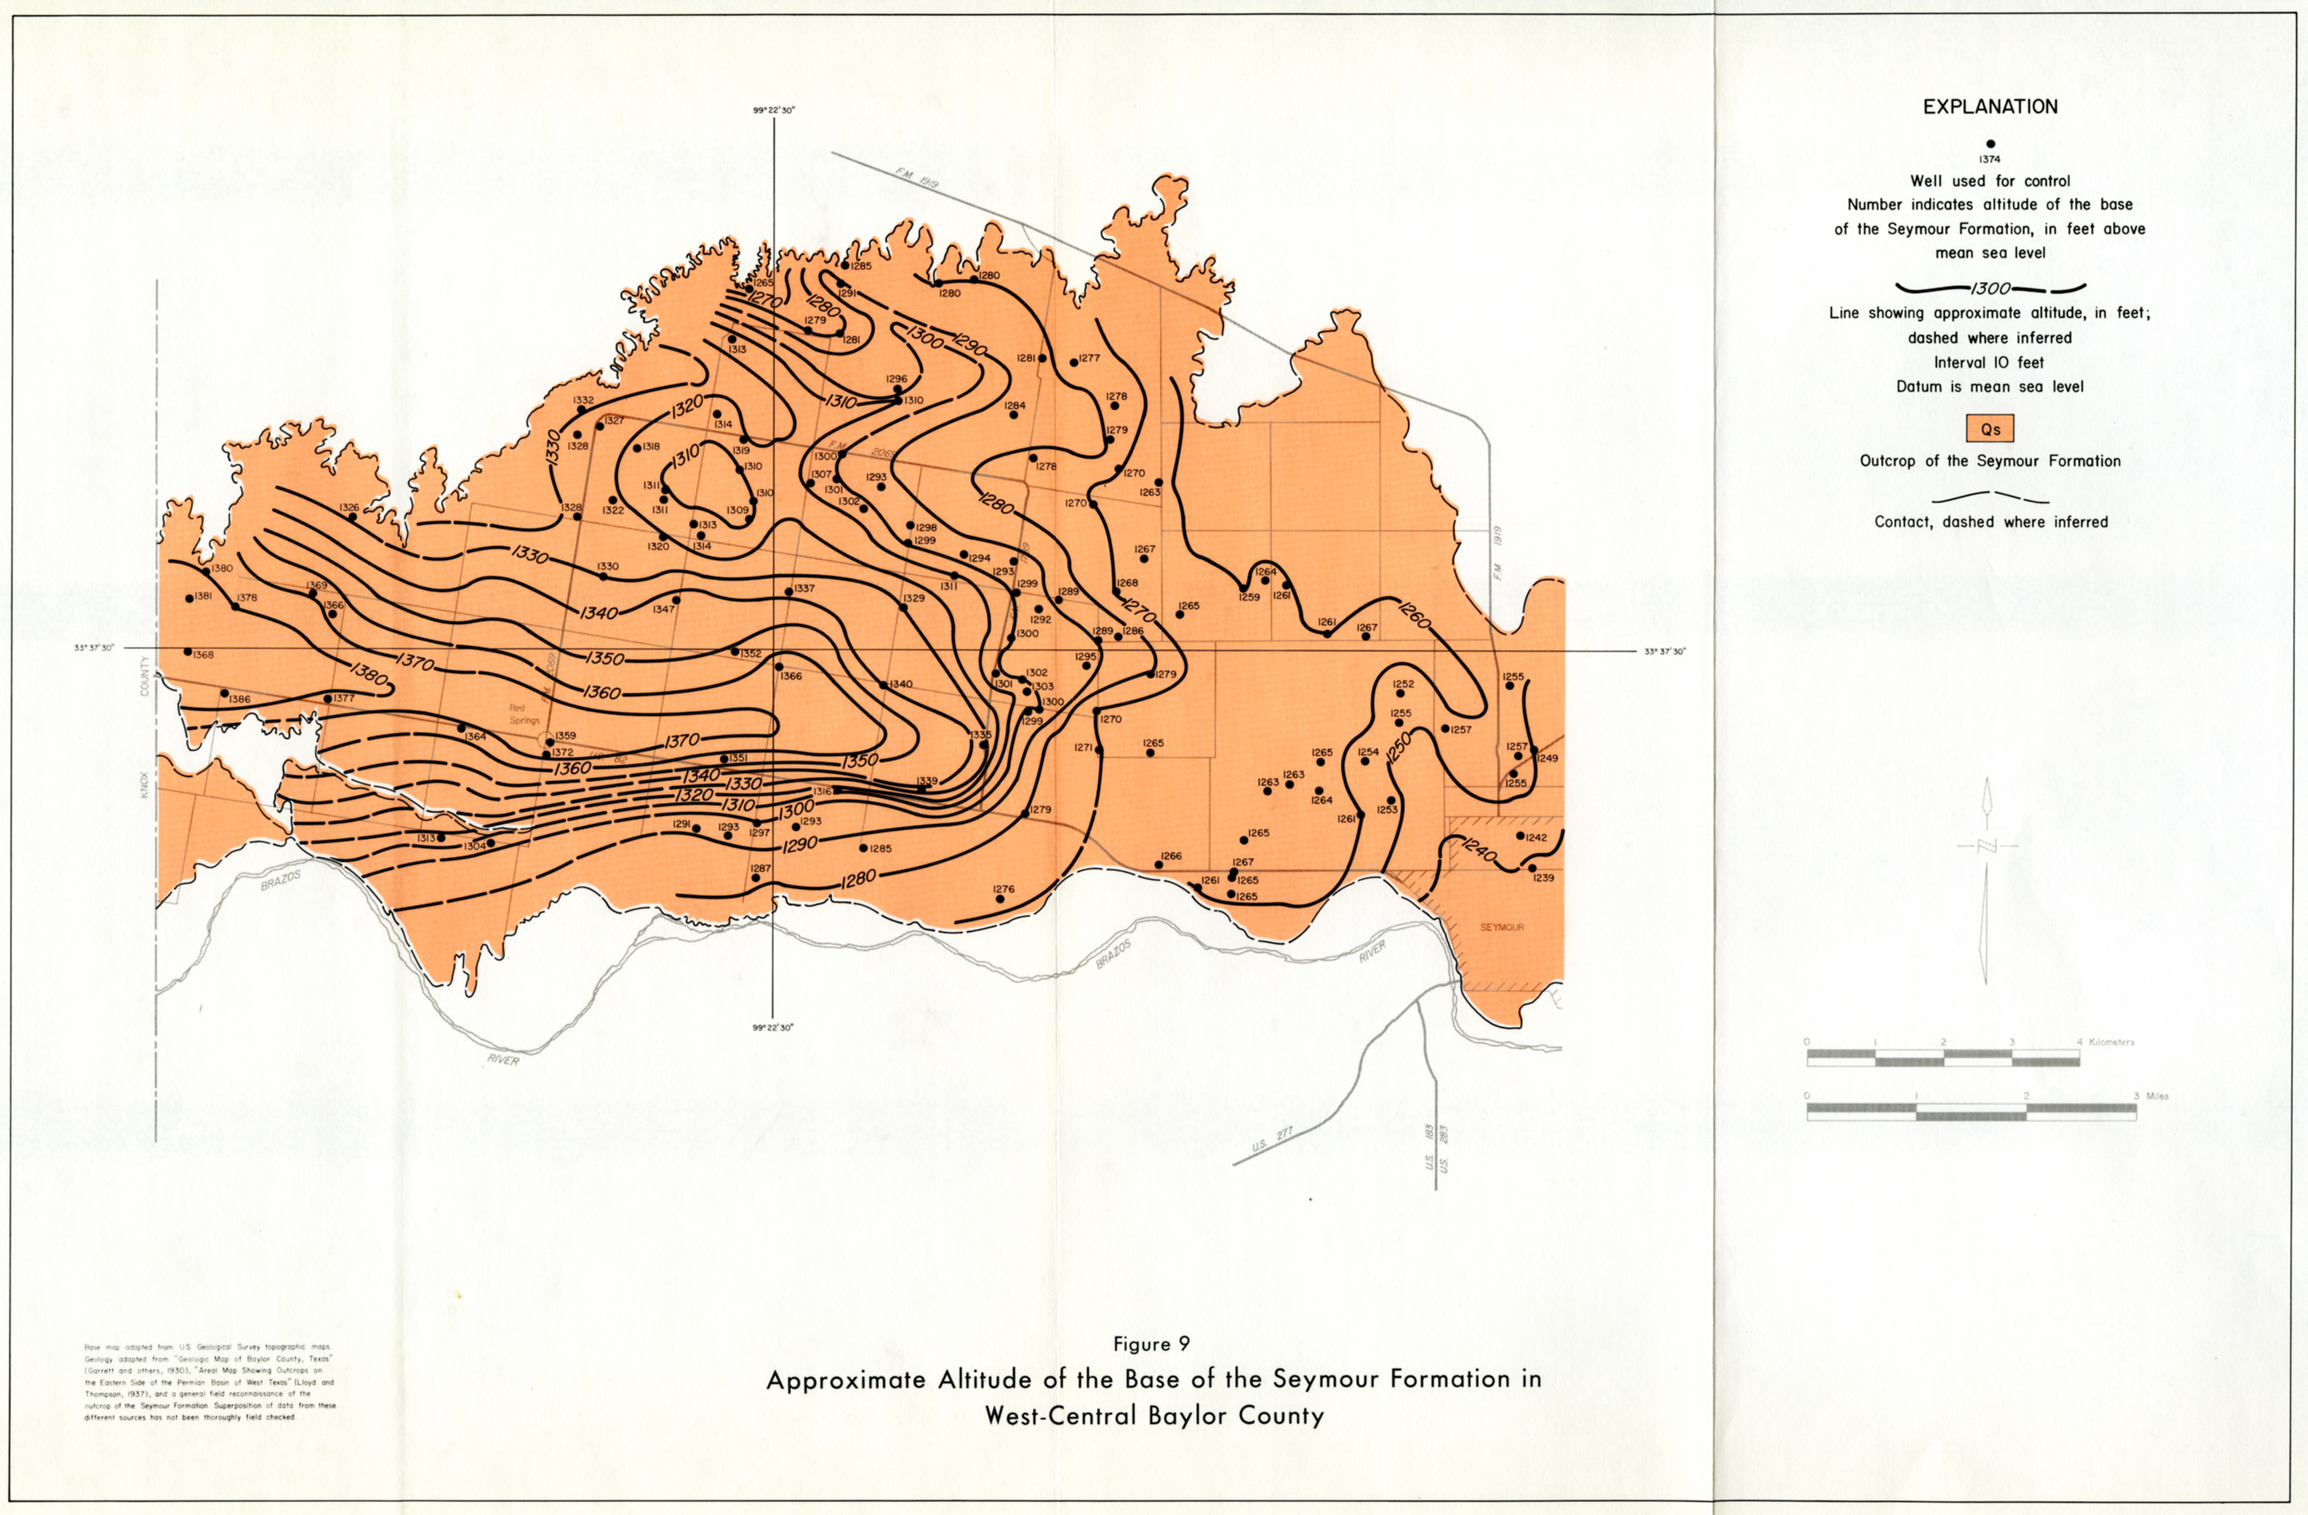
- Figure 9: Approximate Altitude of the Base of the Seymour Formation in West-Central Baylor County
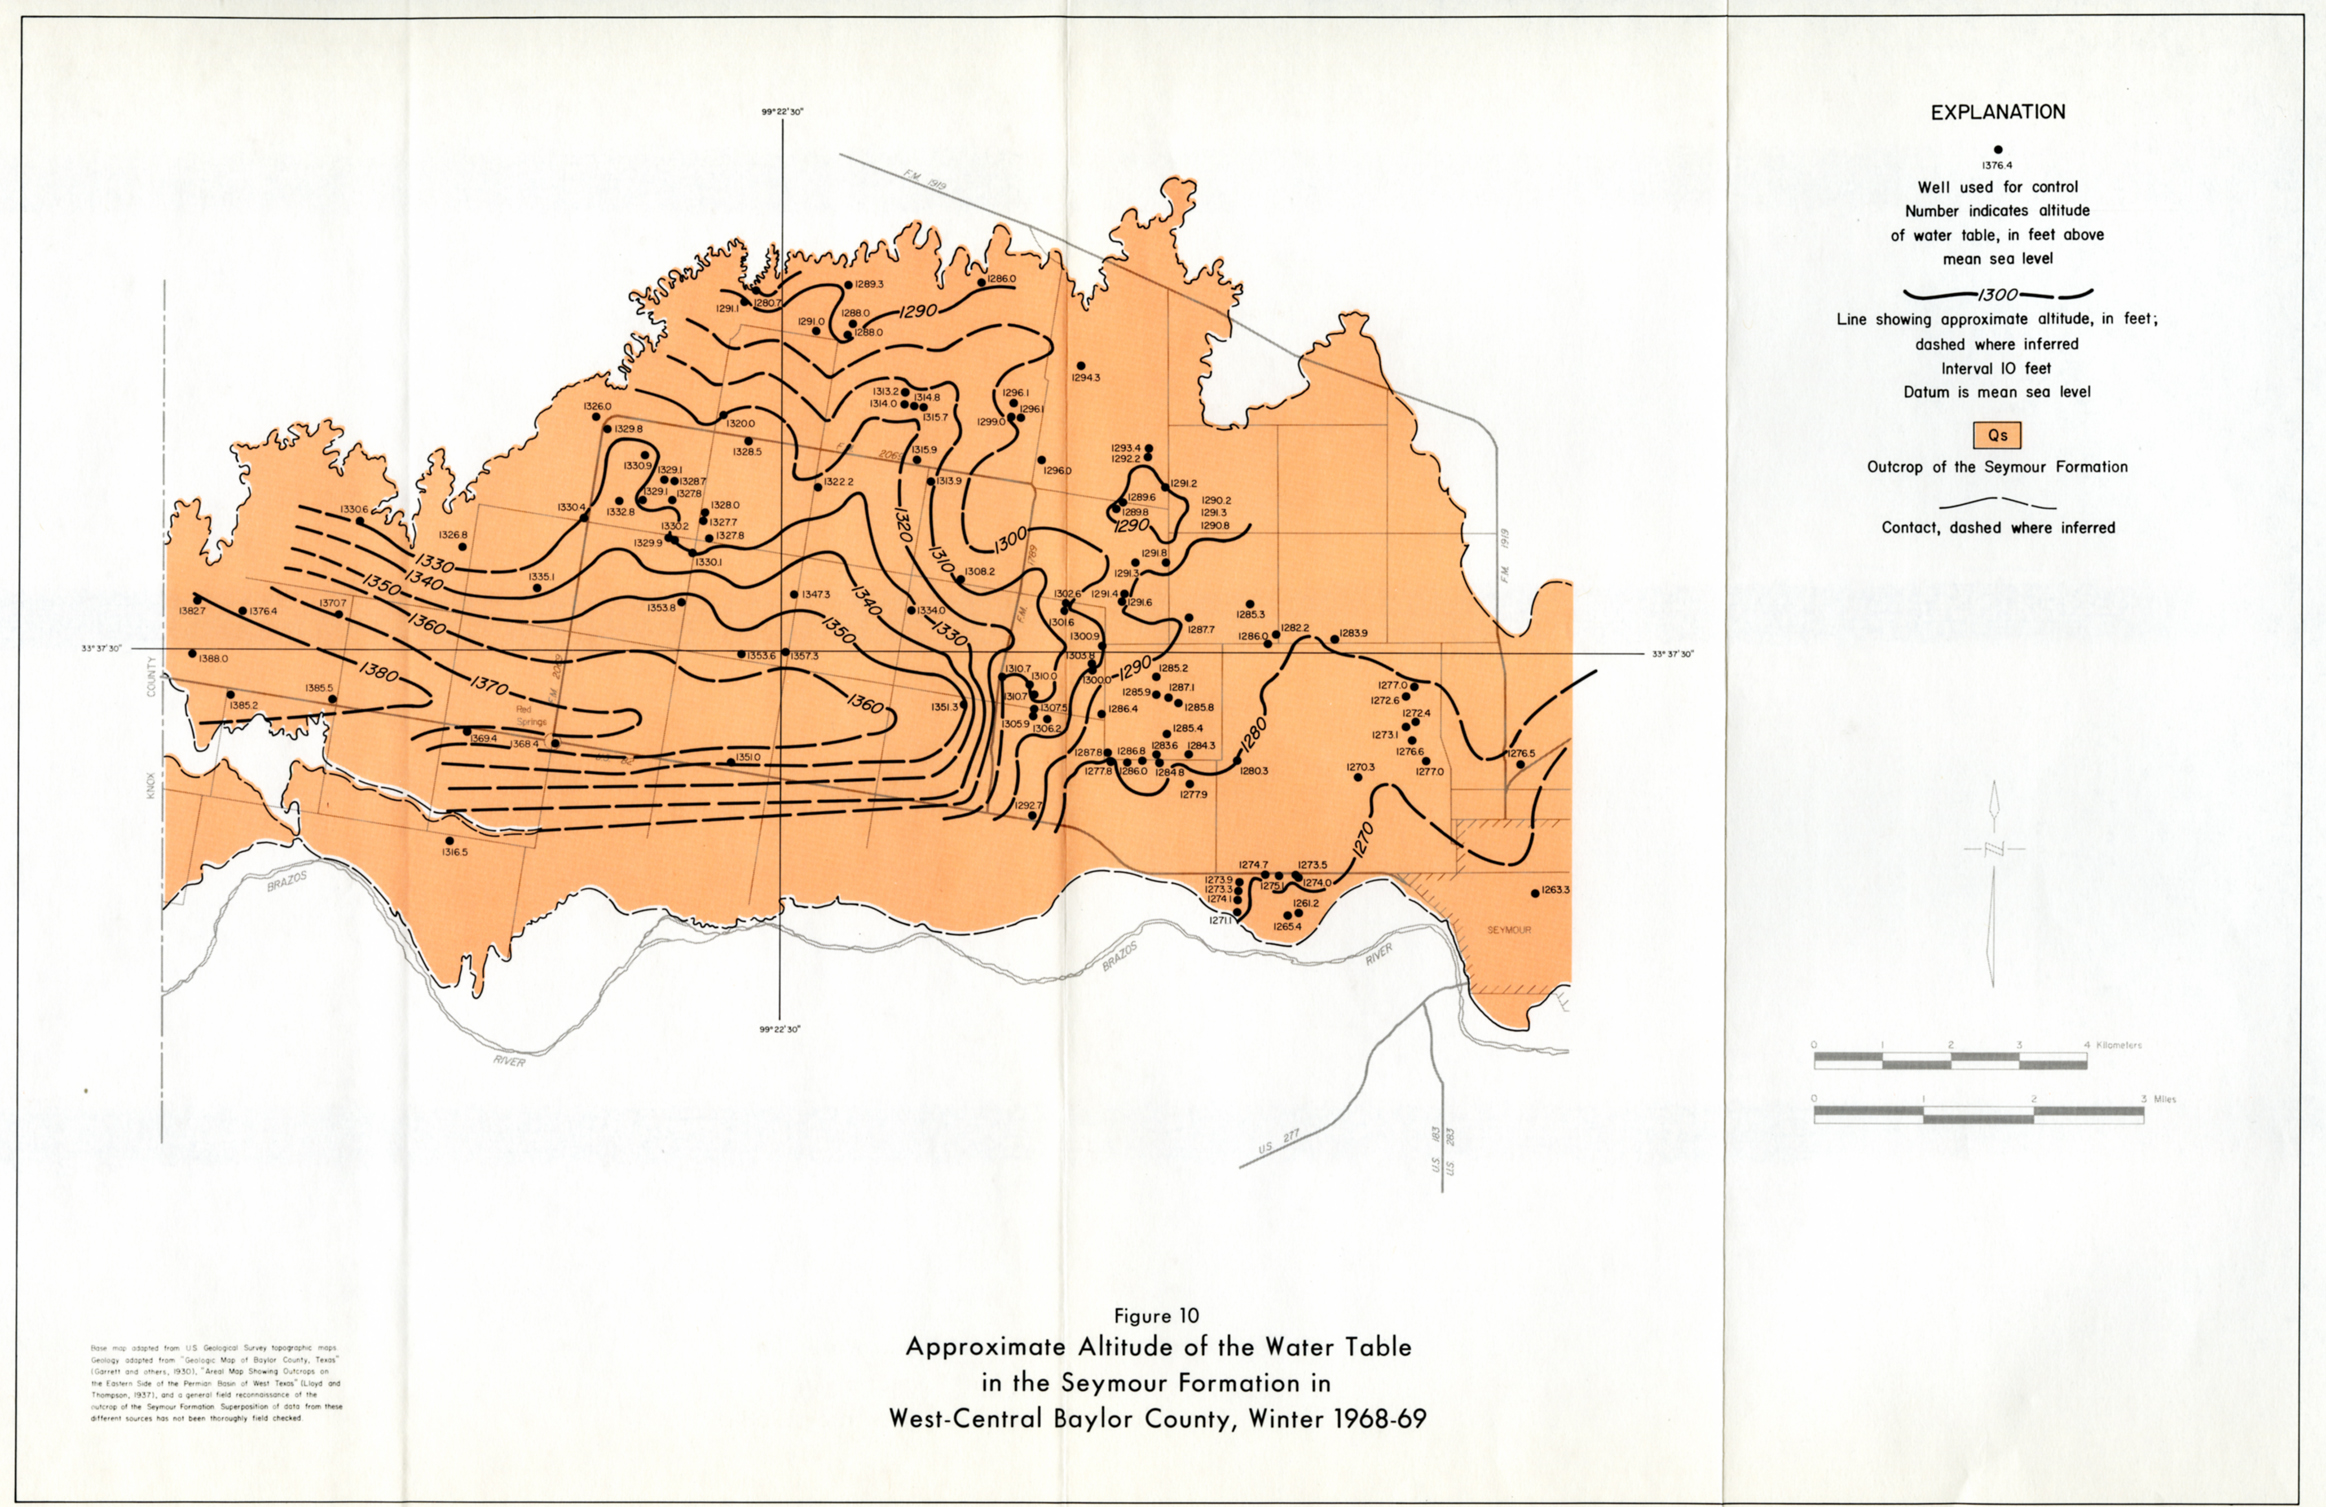
- Figure 10: Approximate Altitude of the Water Table in the Seymour Formation in West-Central Baylor County, Winter 1968-69
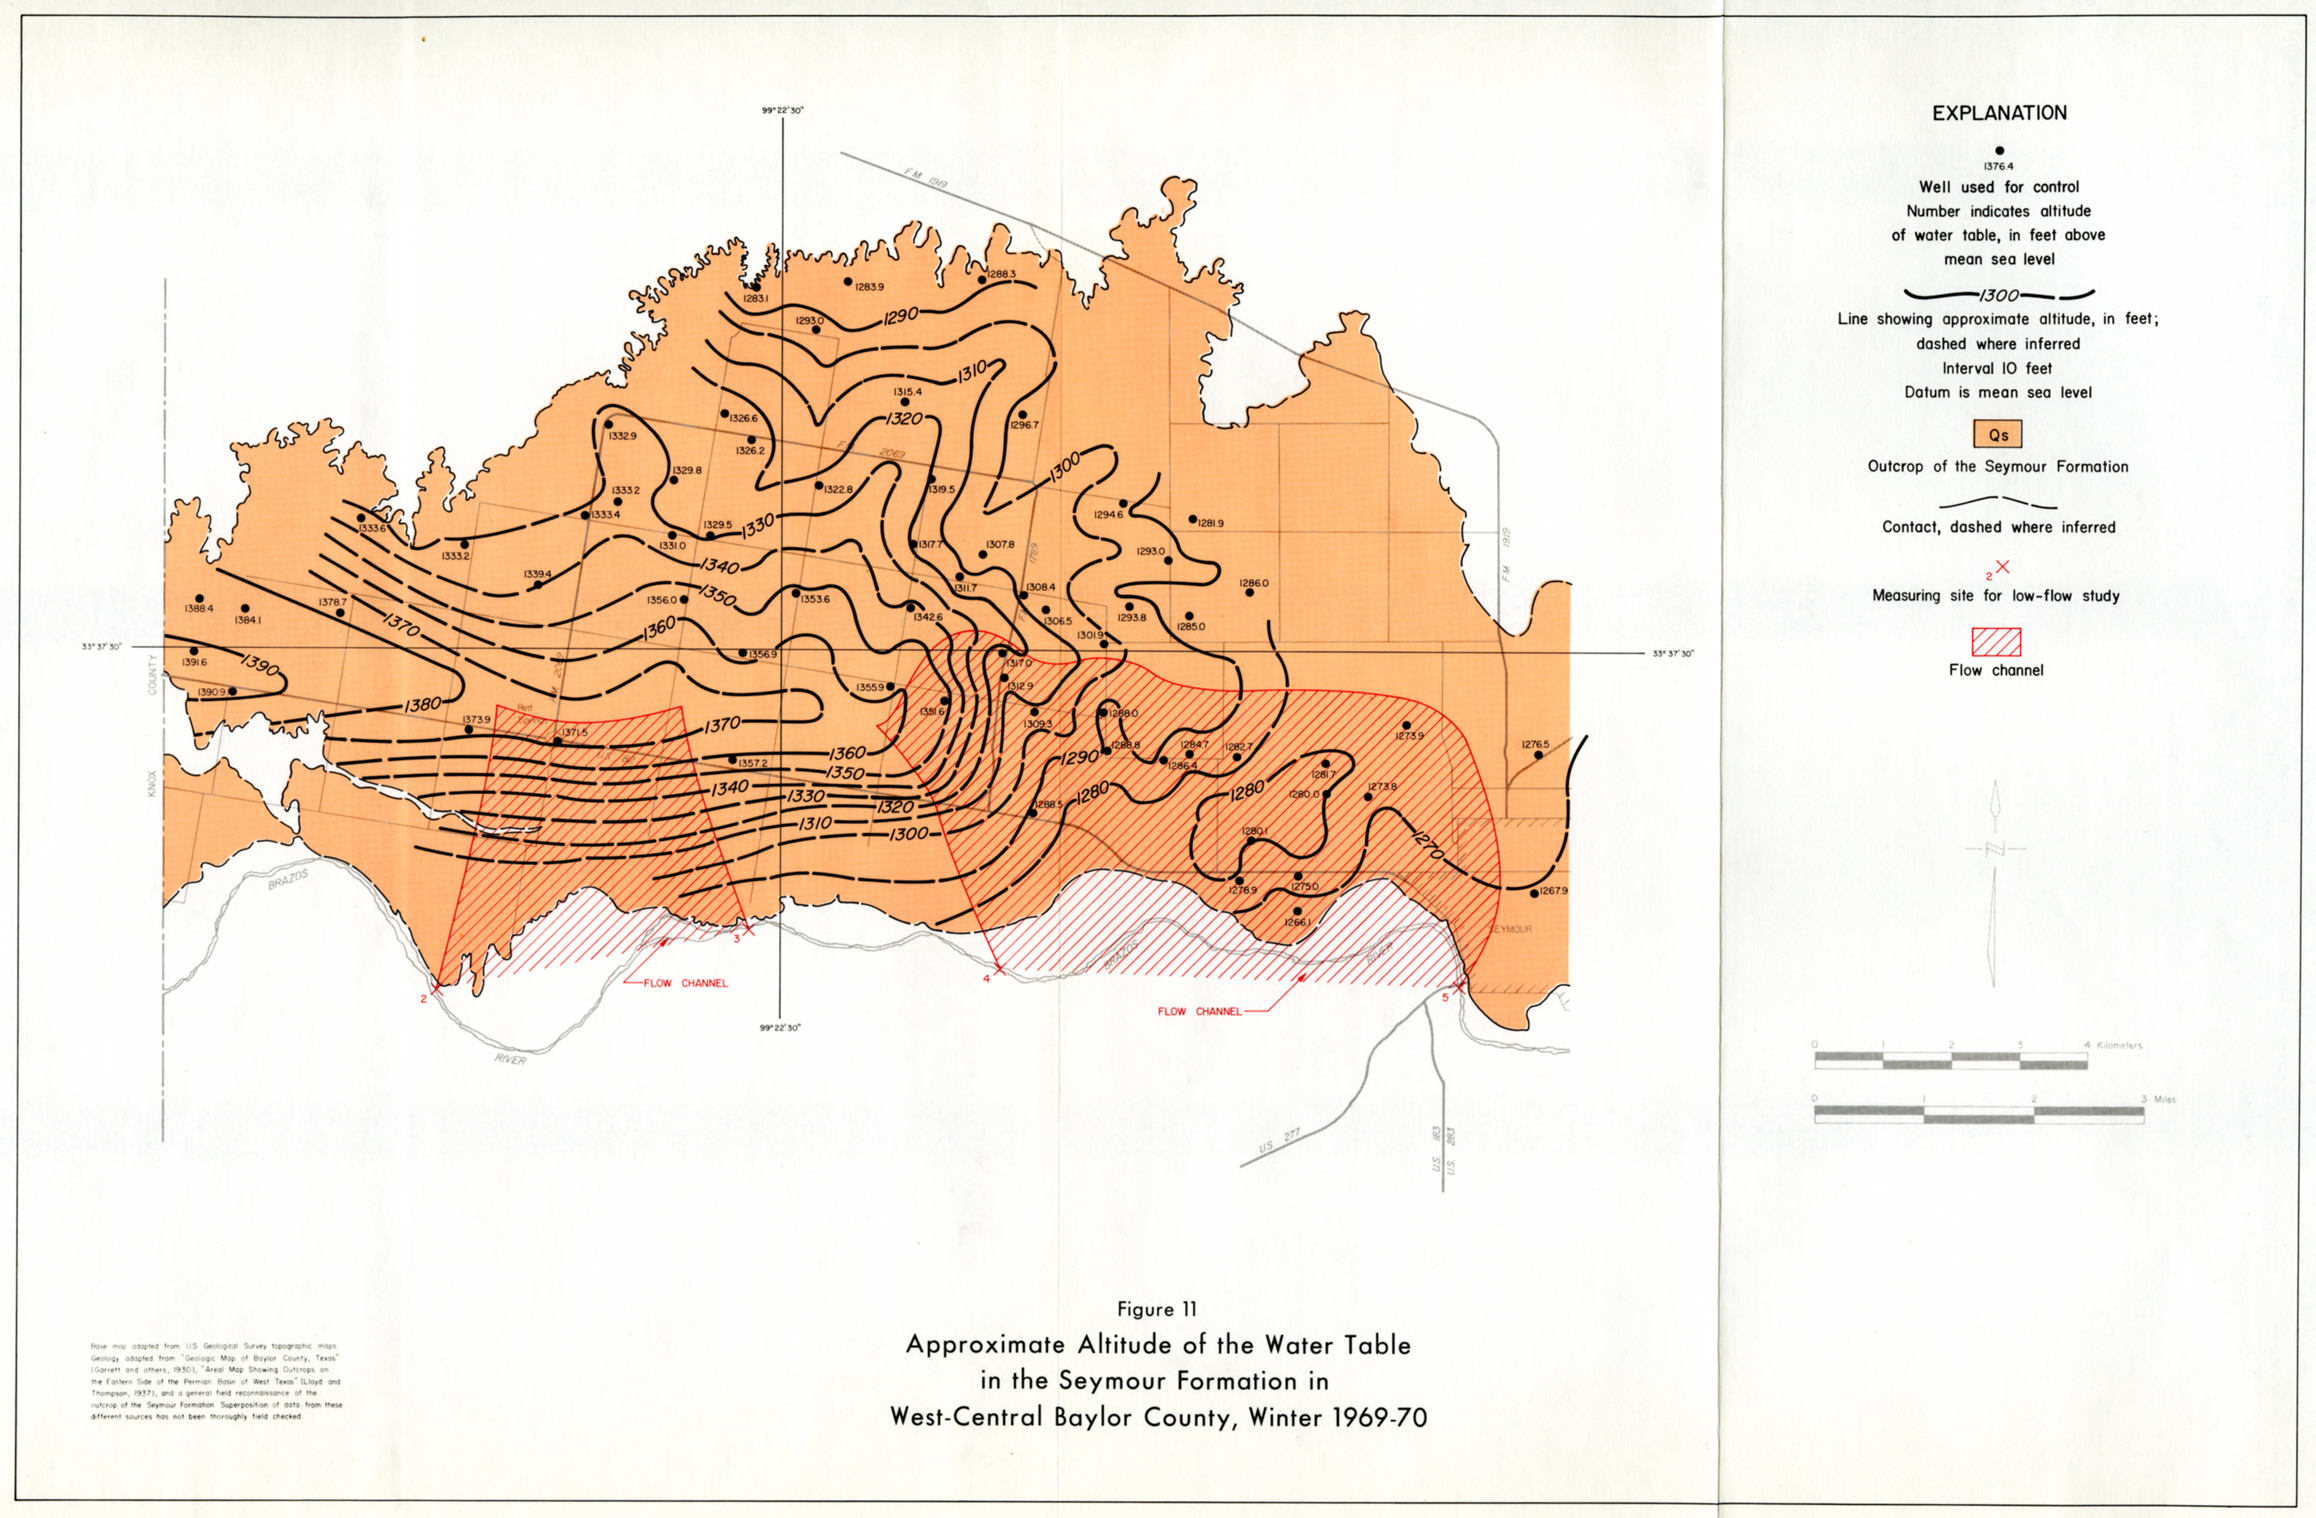
- Figure 11: Approximate Altitude of the Water Table in the Seymour Formation in West-Central Baylor County, Winter 1969-70
- Figure 14: Approximate Saturated Thickness of the Seymour Formation, December 1969 and areas favorable to future development
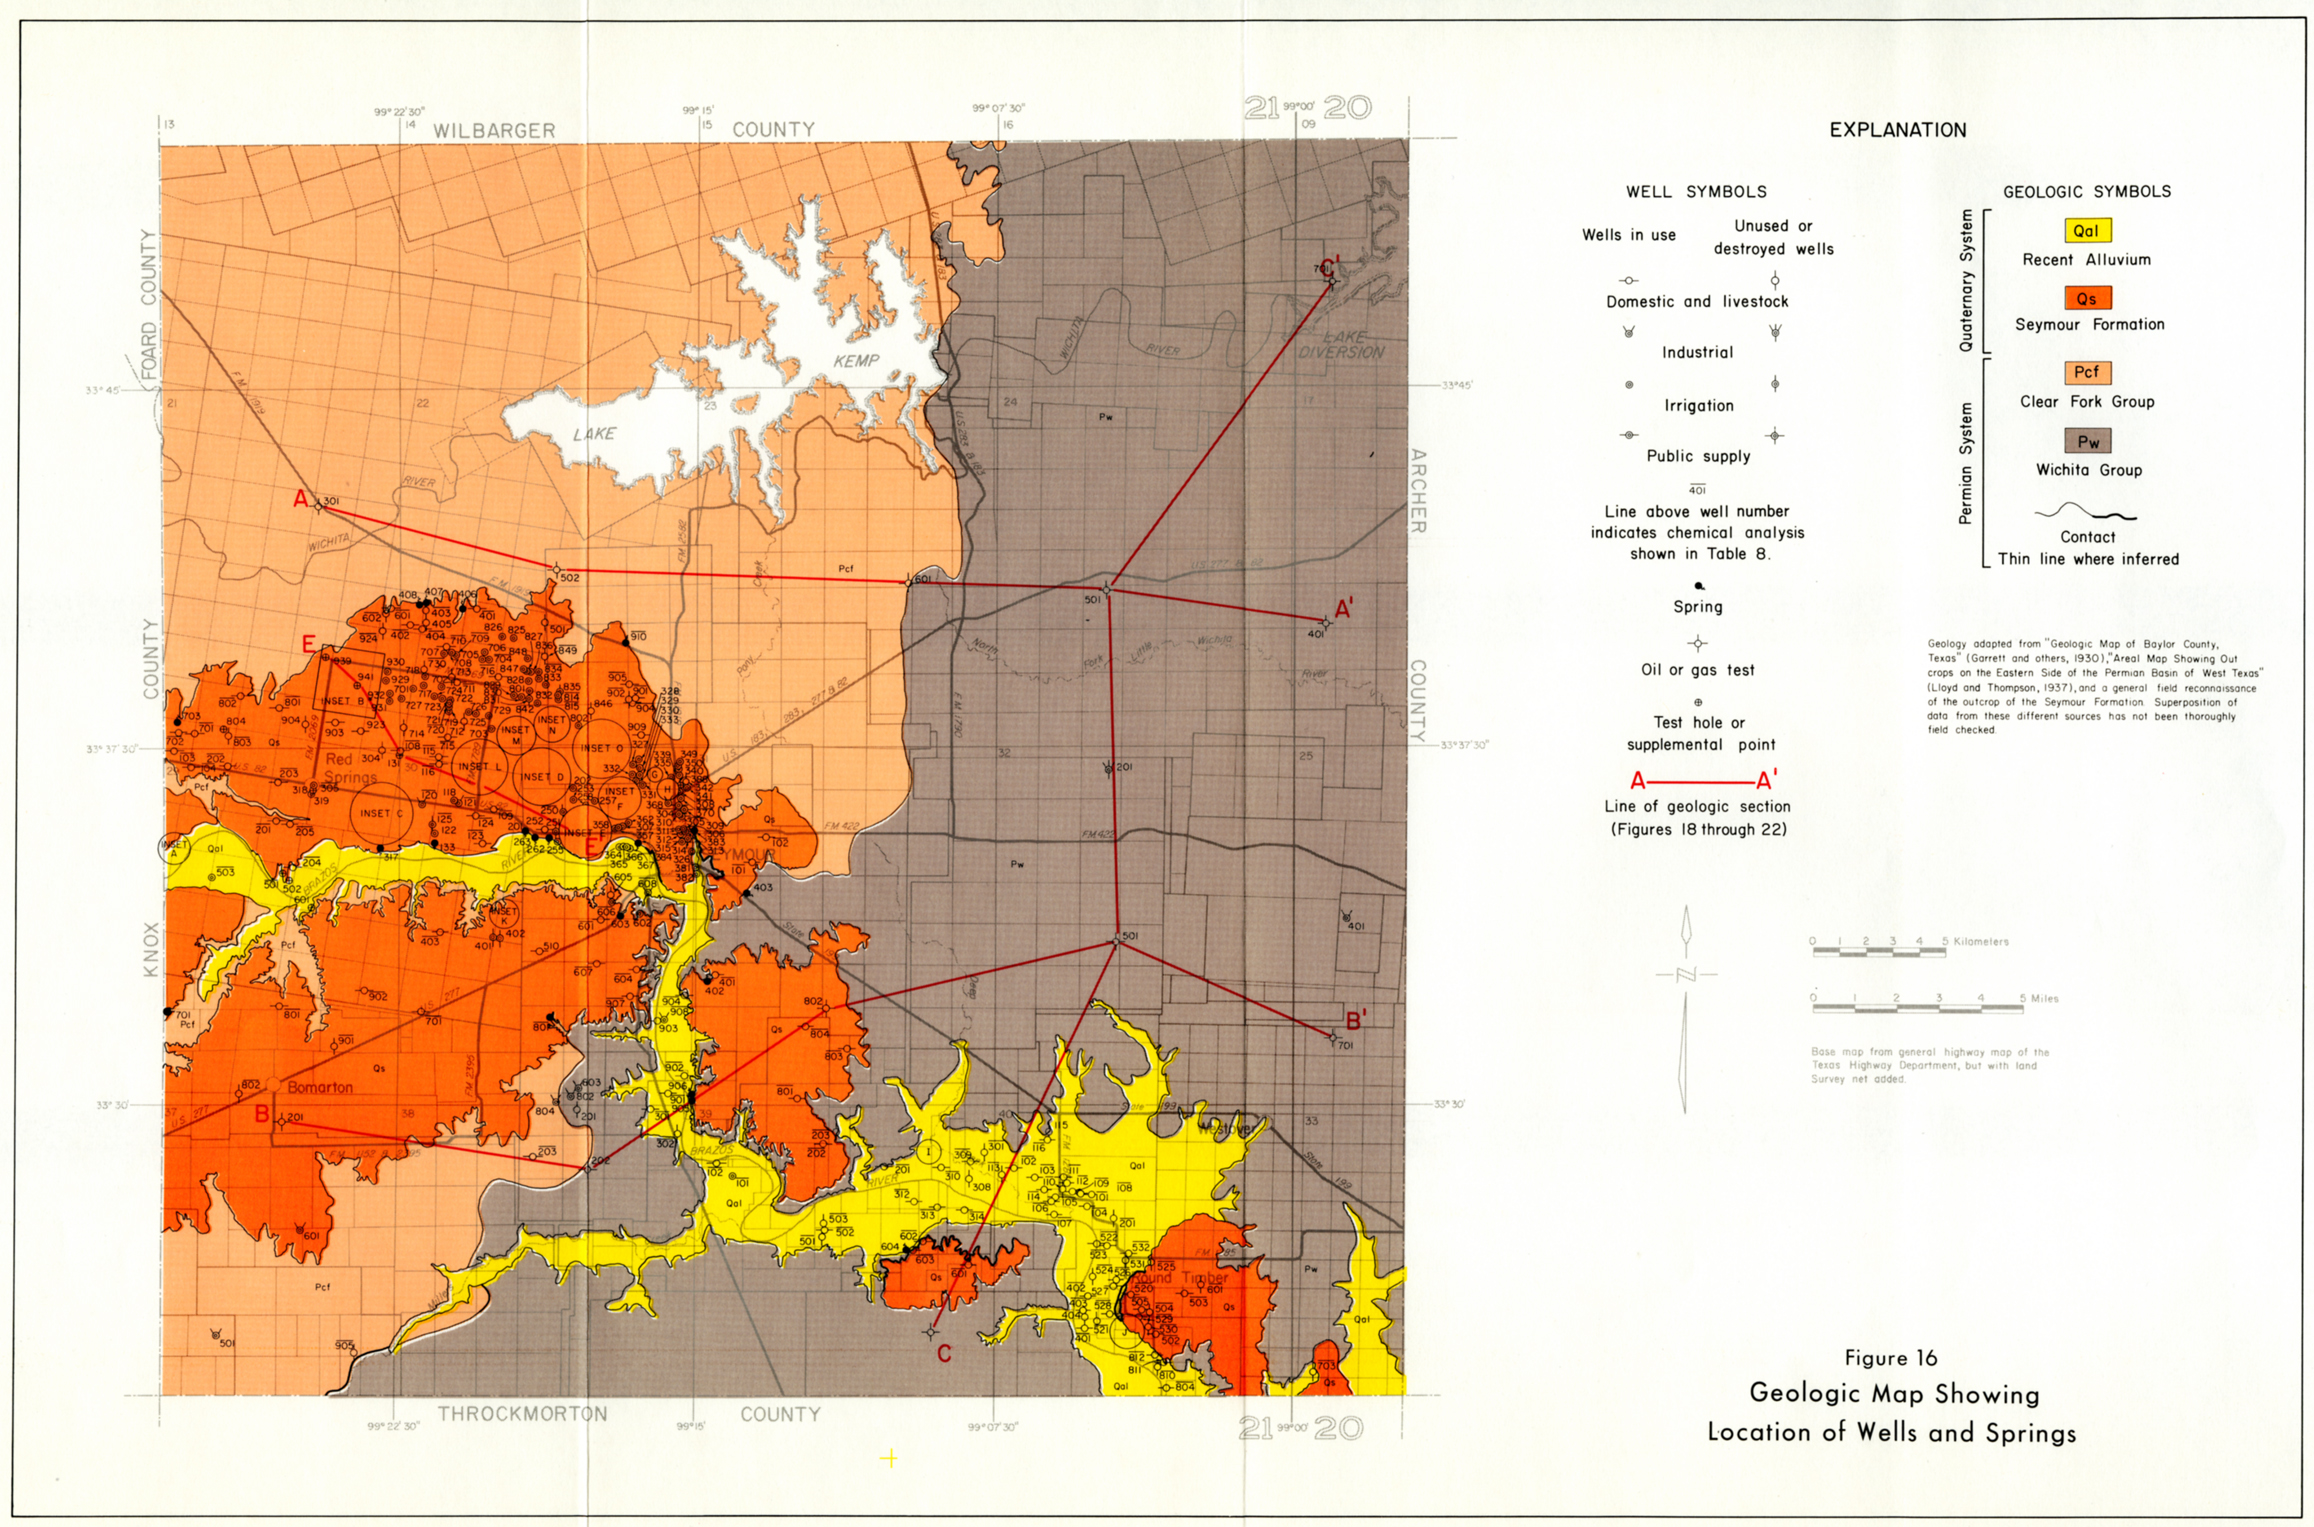
- Figure 16: Geologic Map showing Location of Wells and Springs
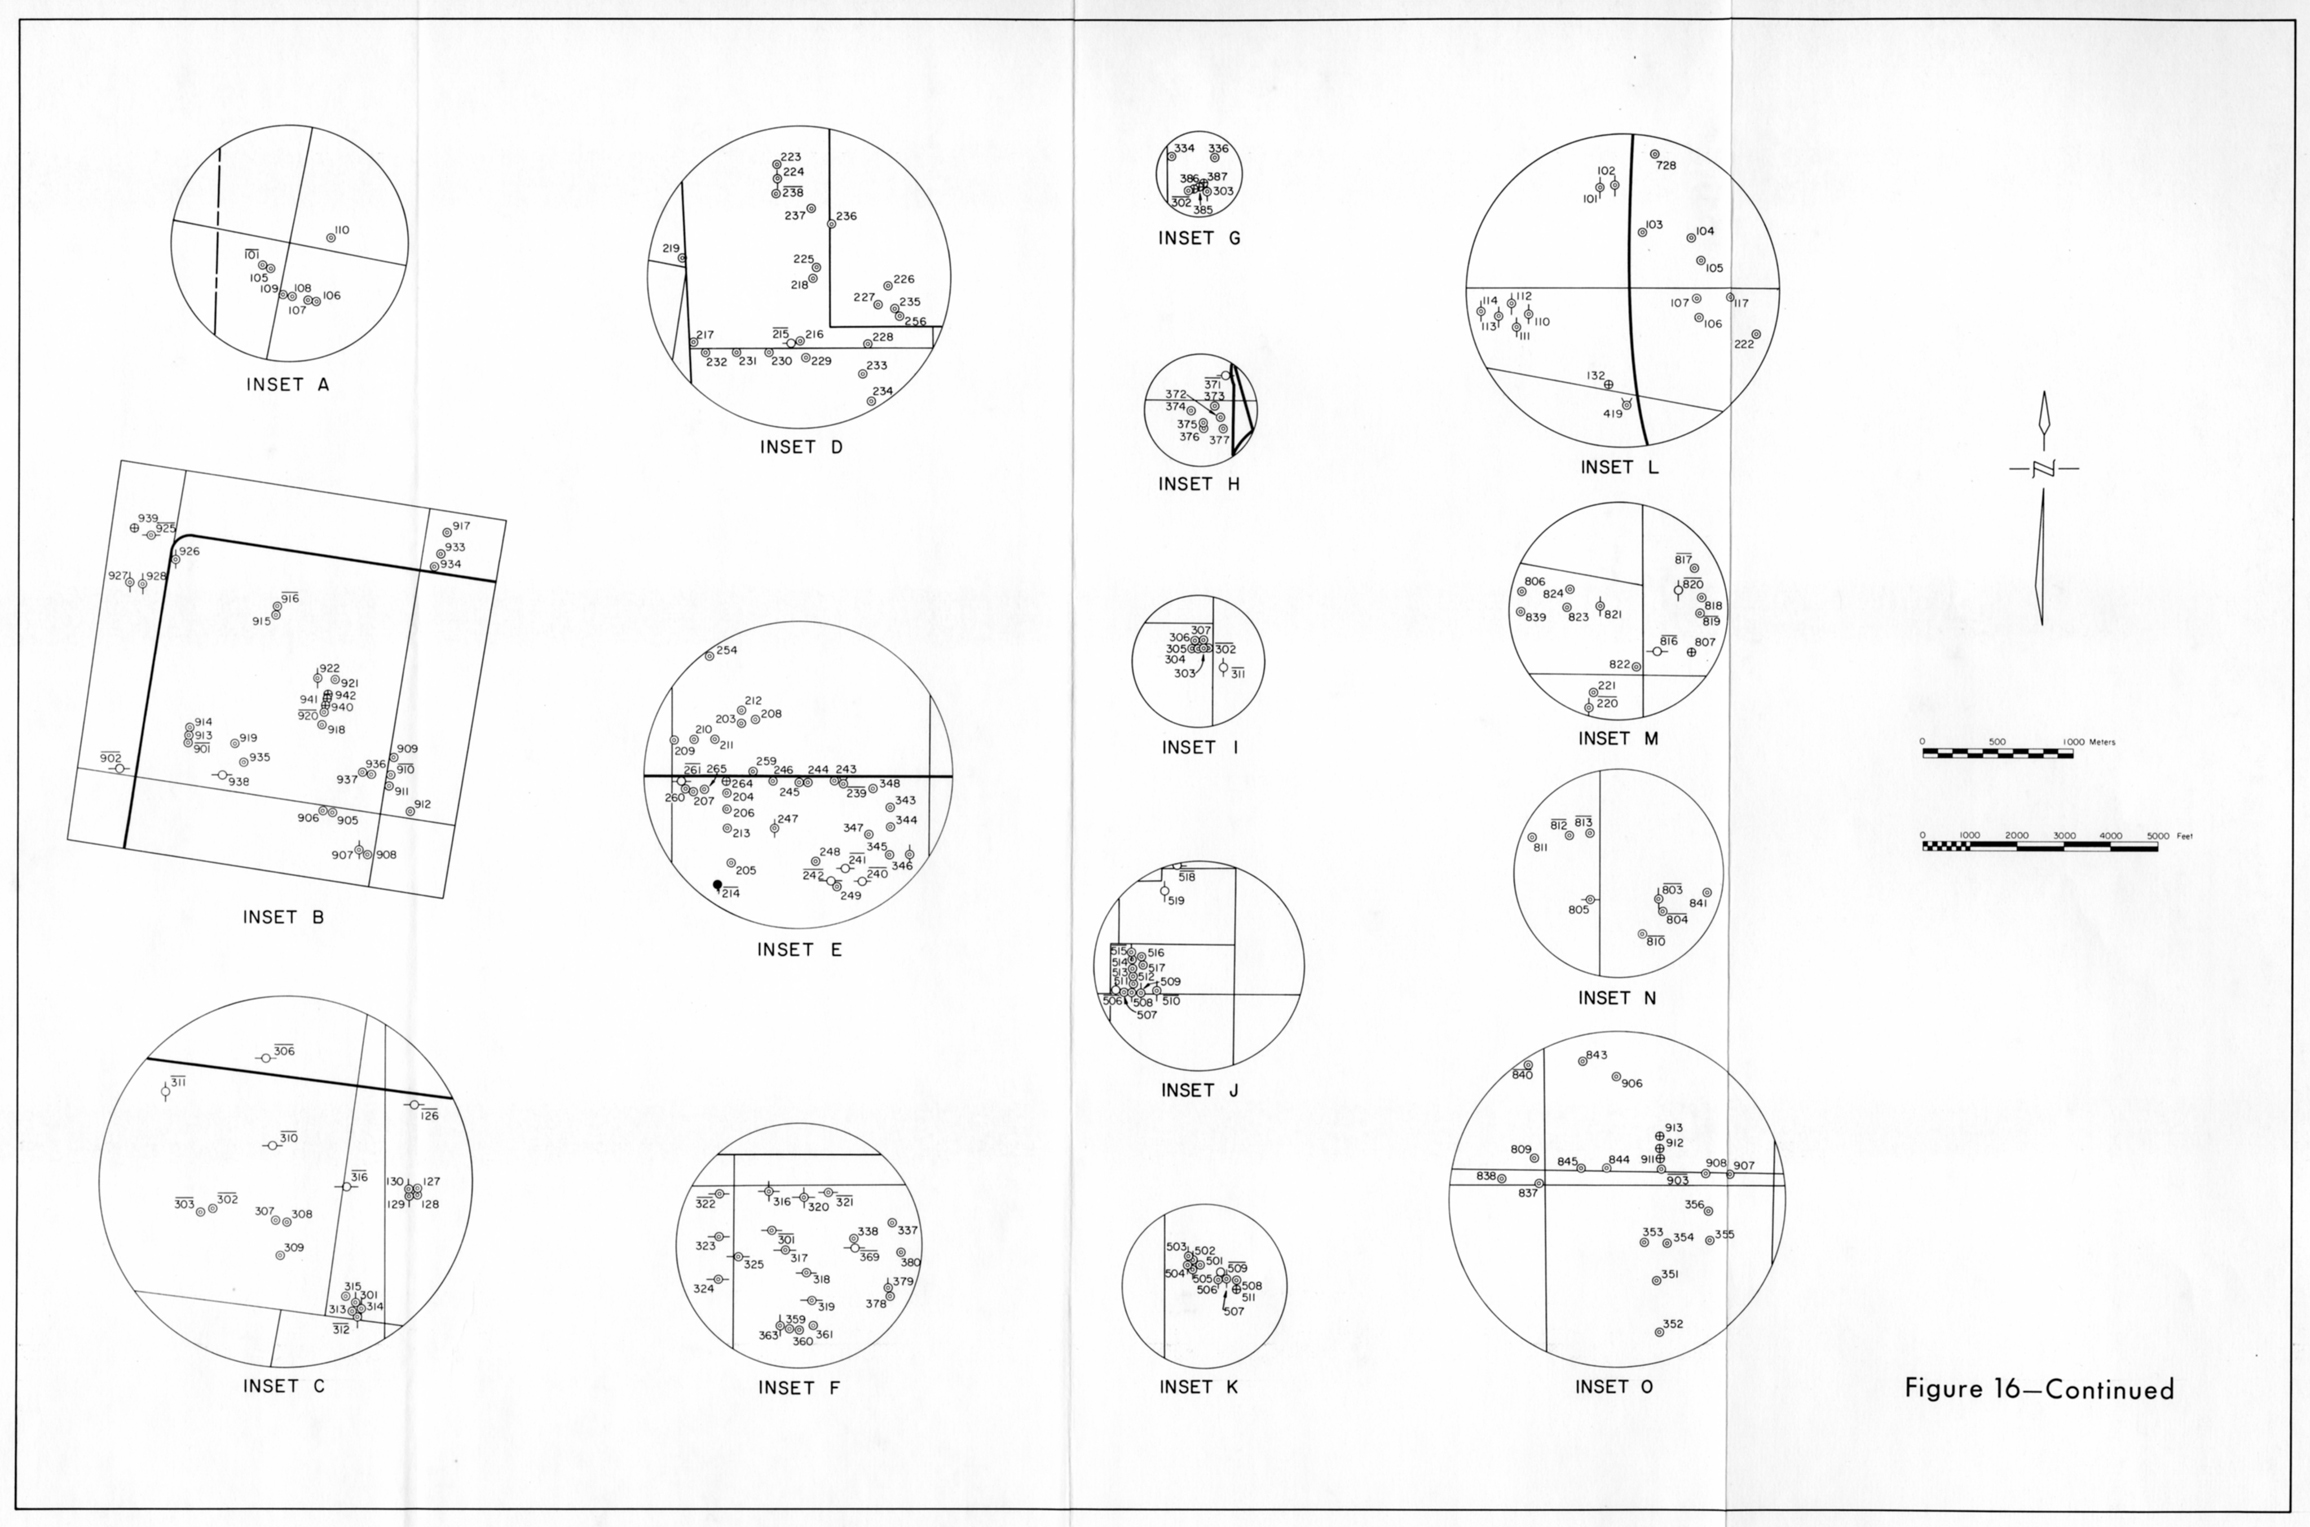
- Figure 16, continued: (insets & details)
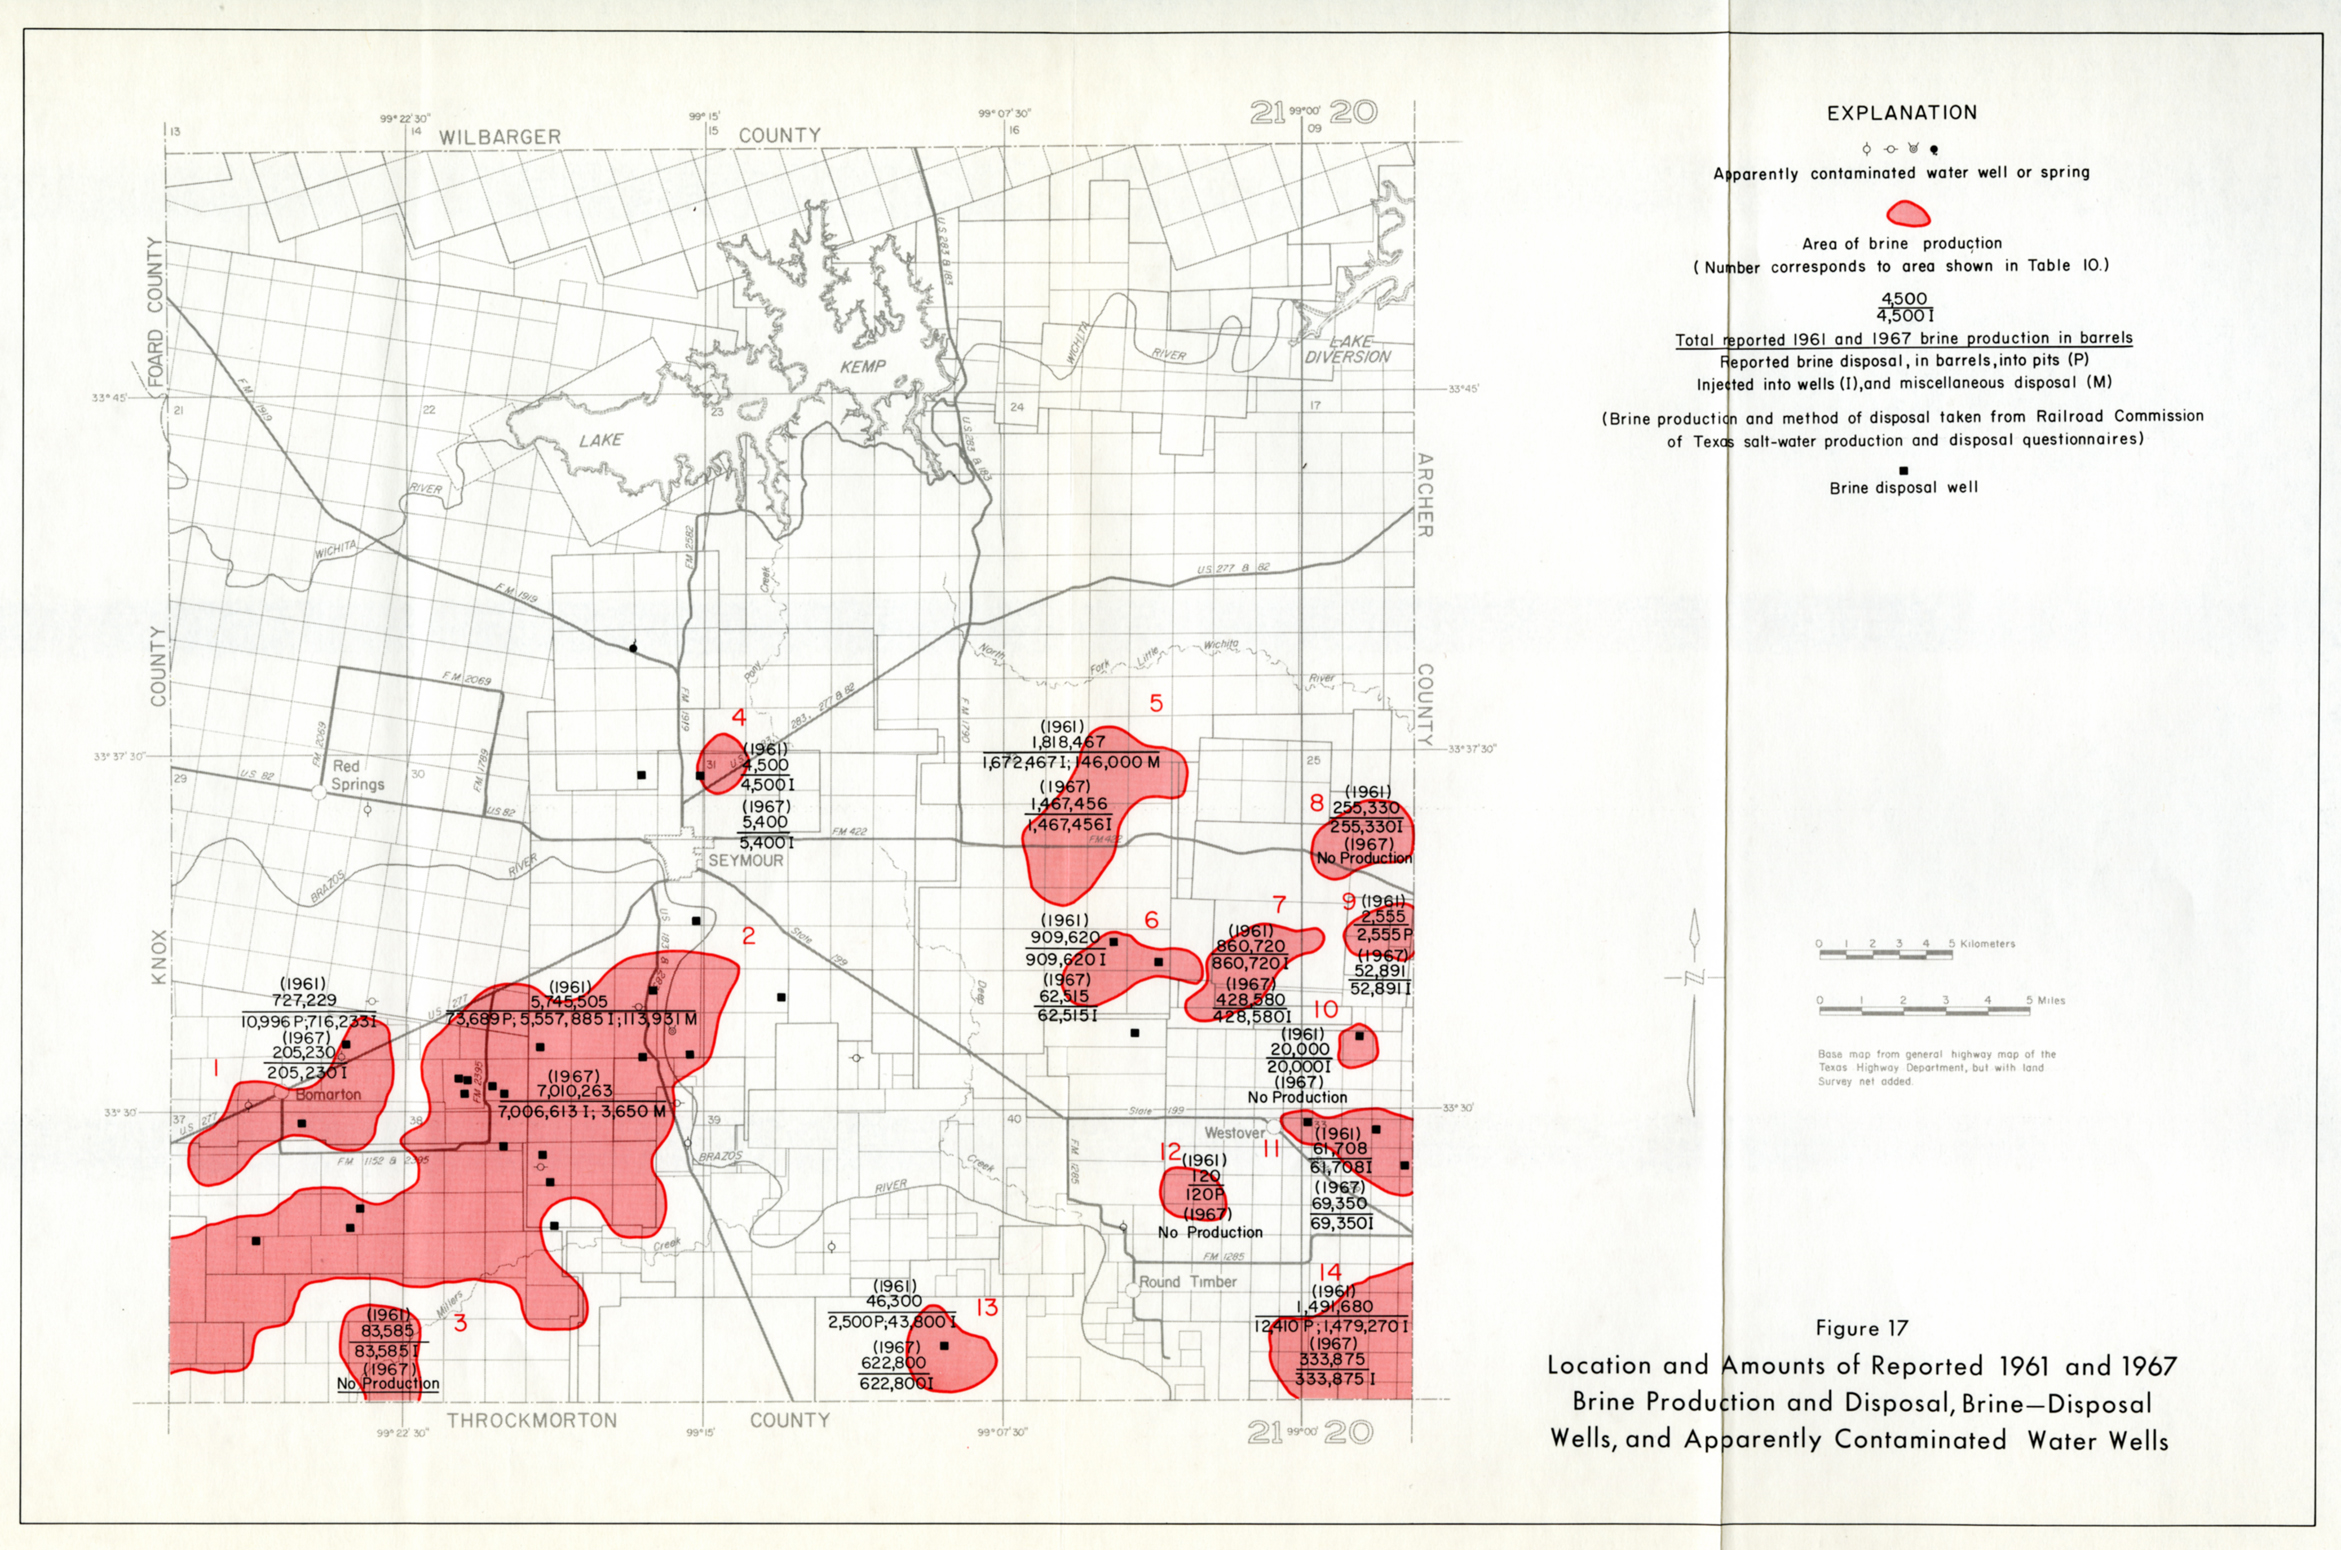
- Figure 17: Location of Amounts of Reported 1961 and 1967 Brine Production and Disposal, Brine Disposal wells, and apparent contamination
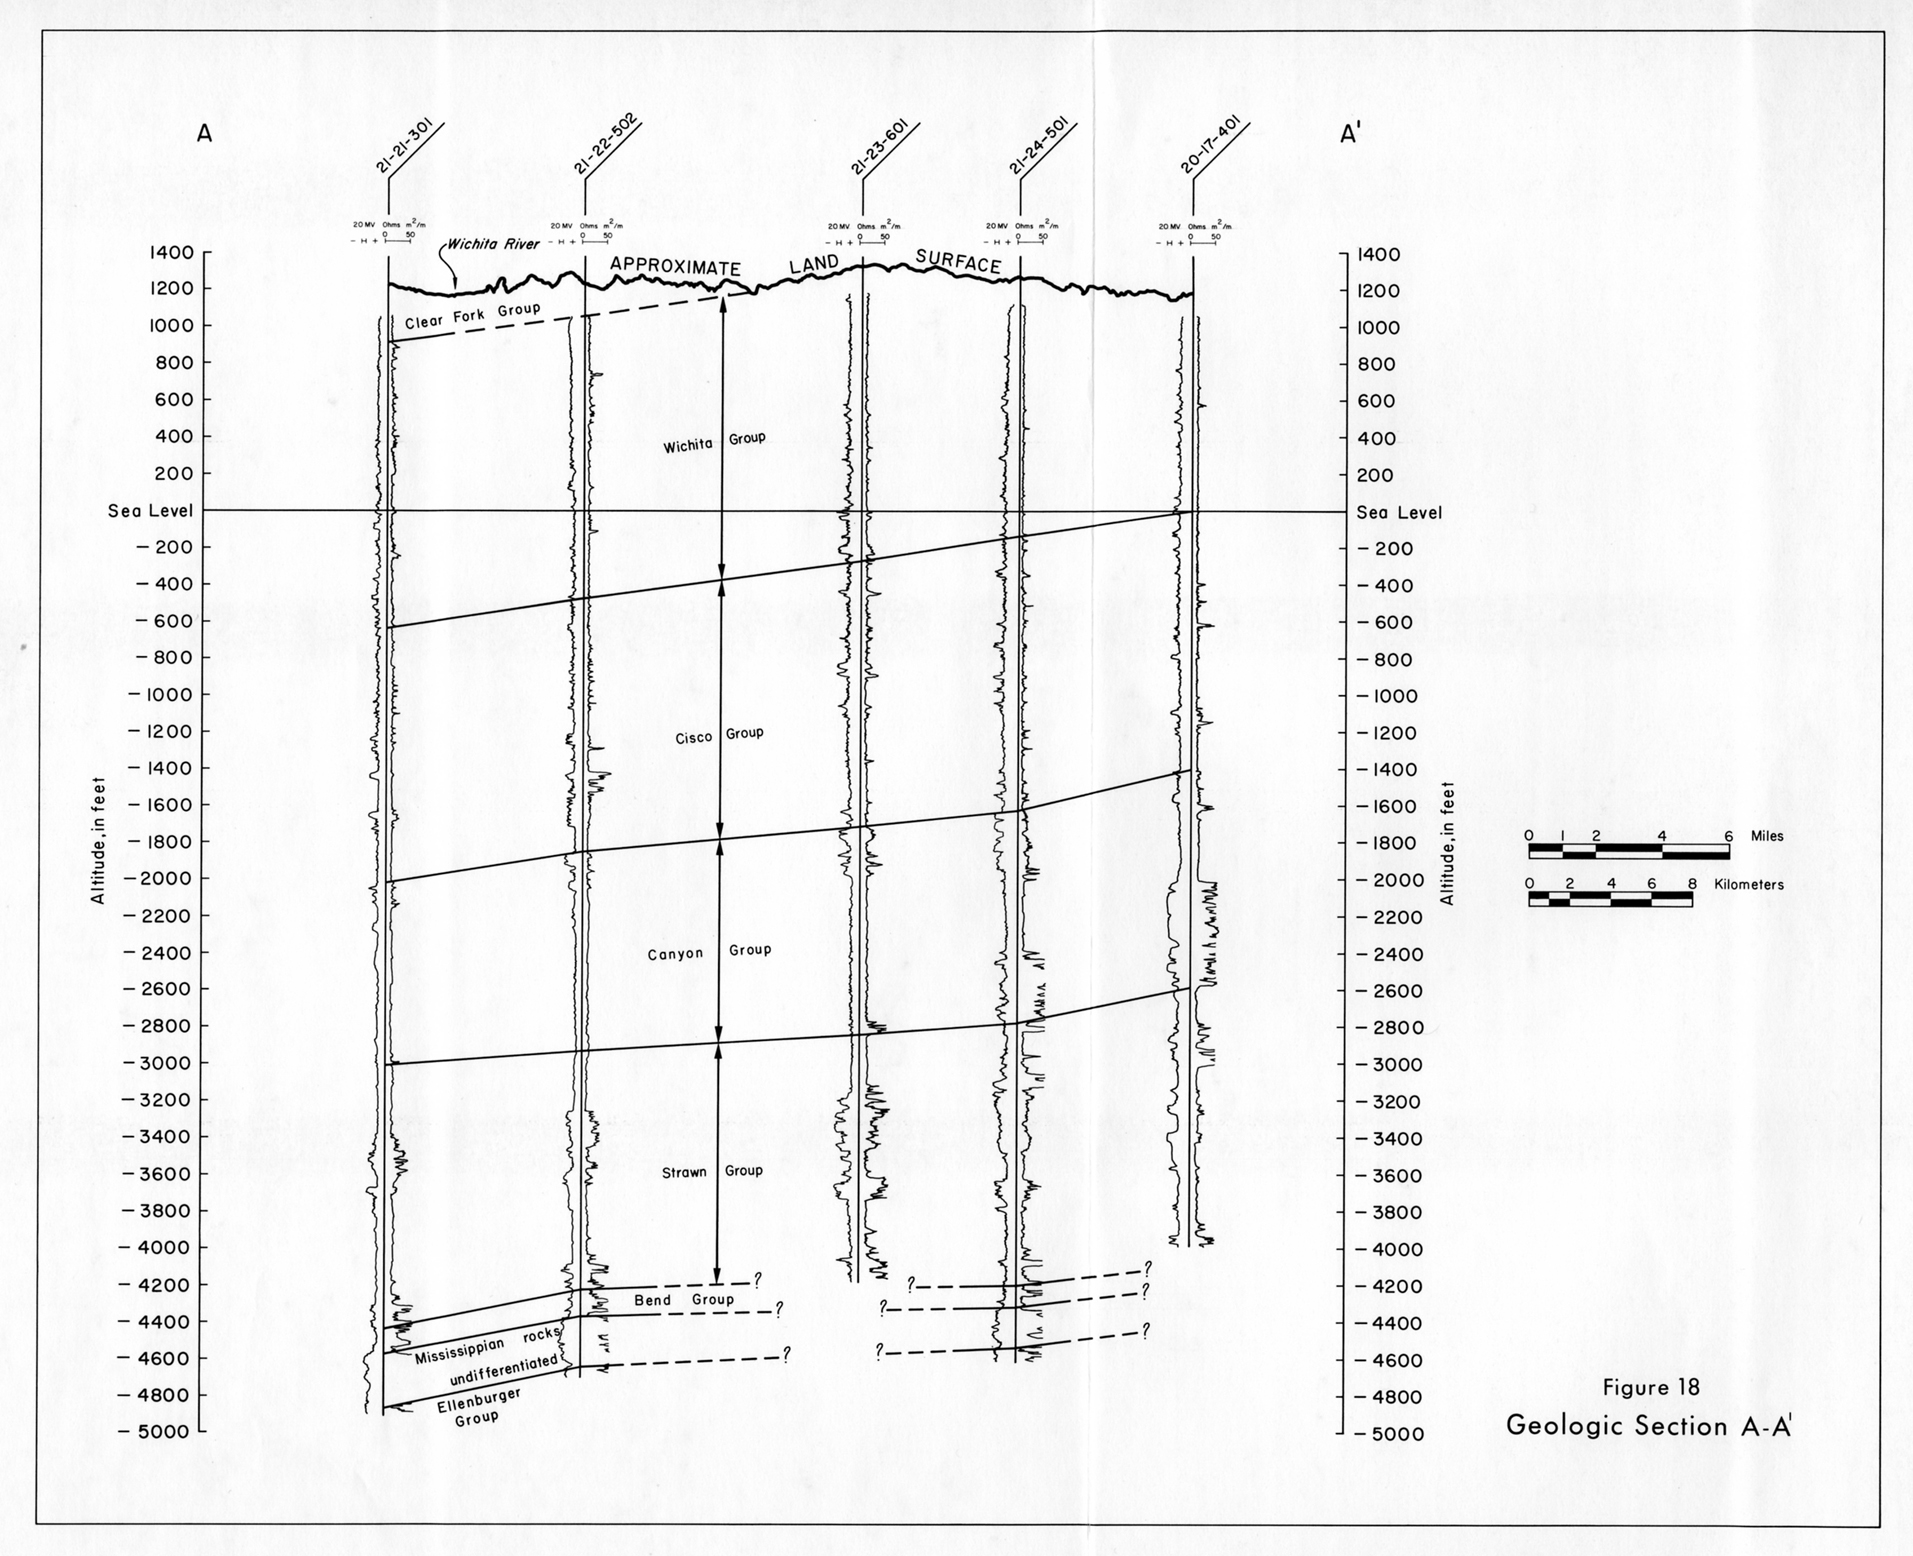
- Figure 18: Geologic Section A-A'
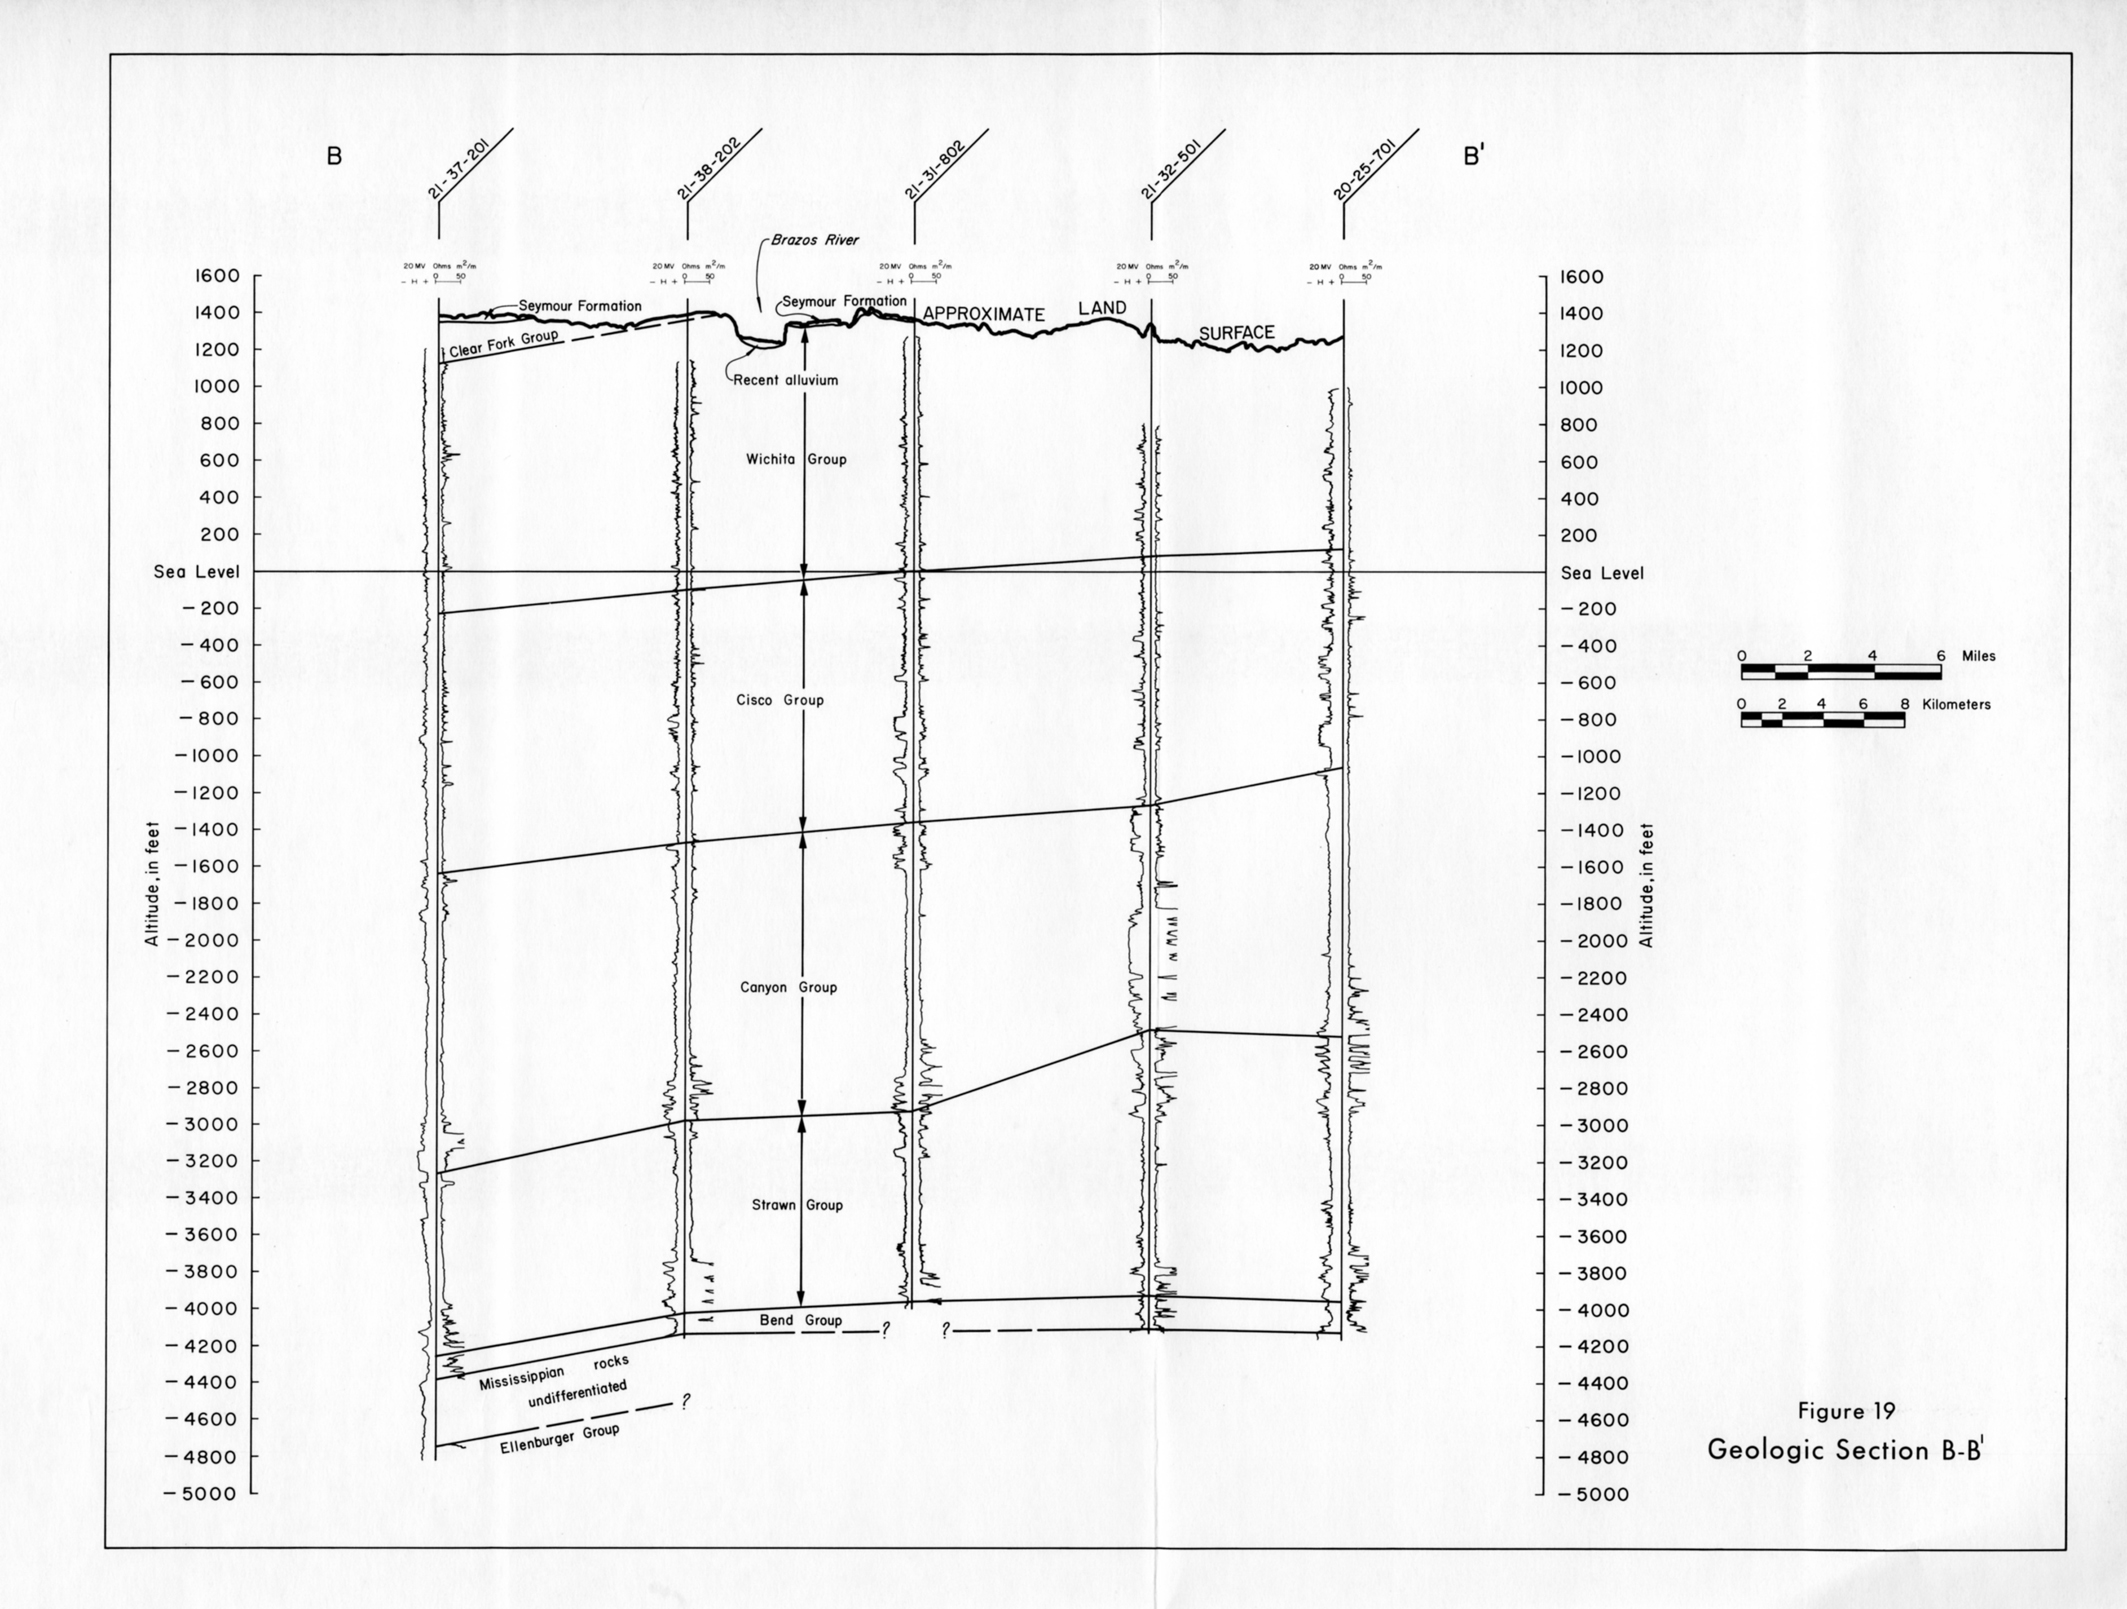
- Figure 19: Geologic Section B-B'
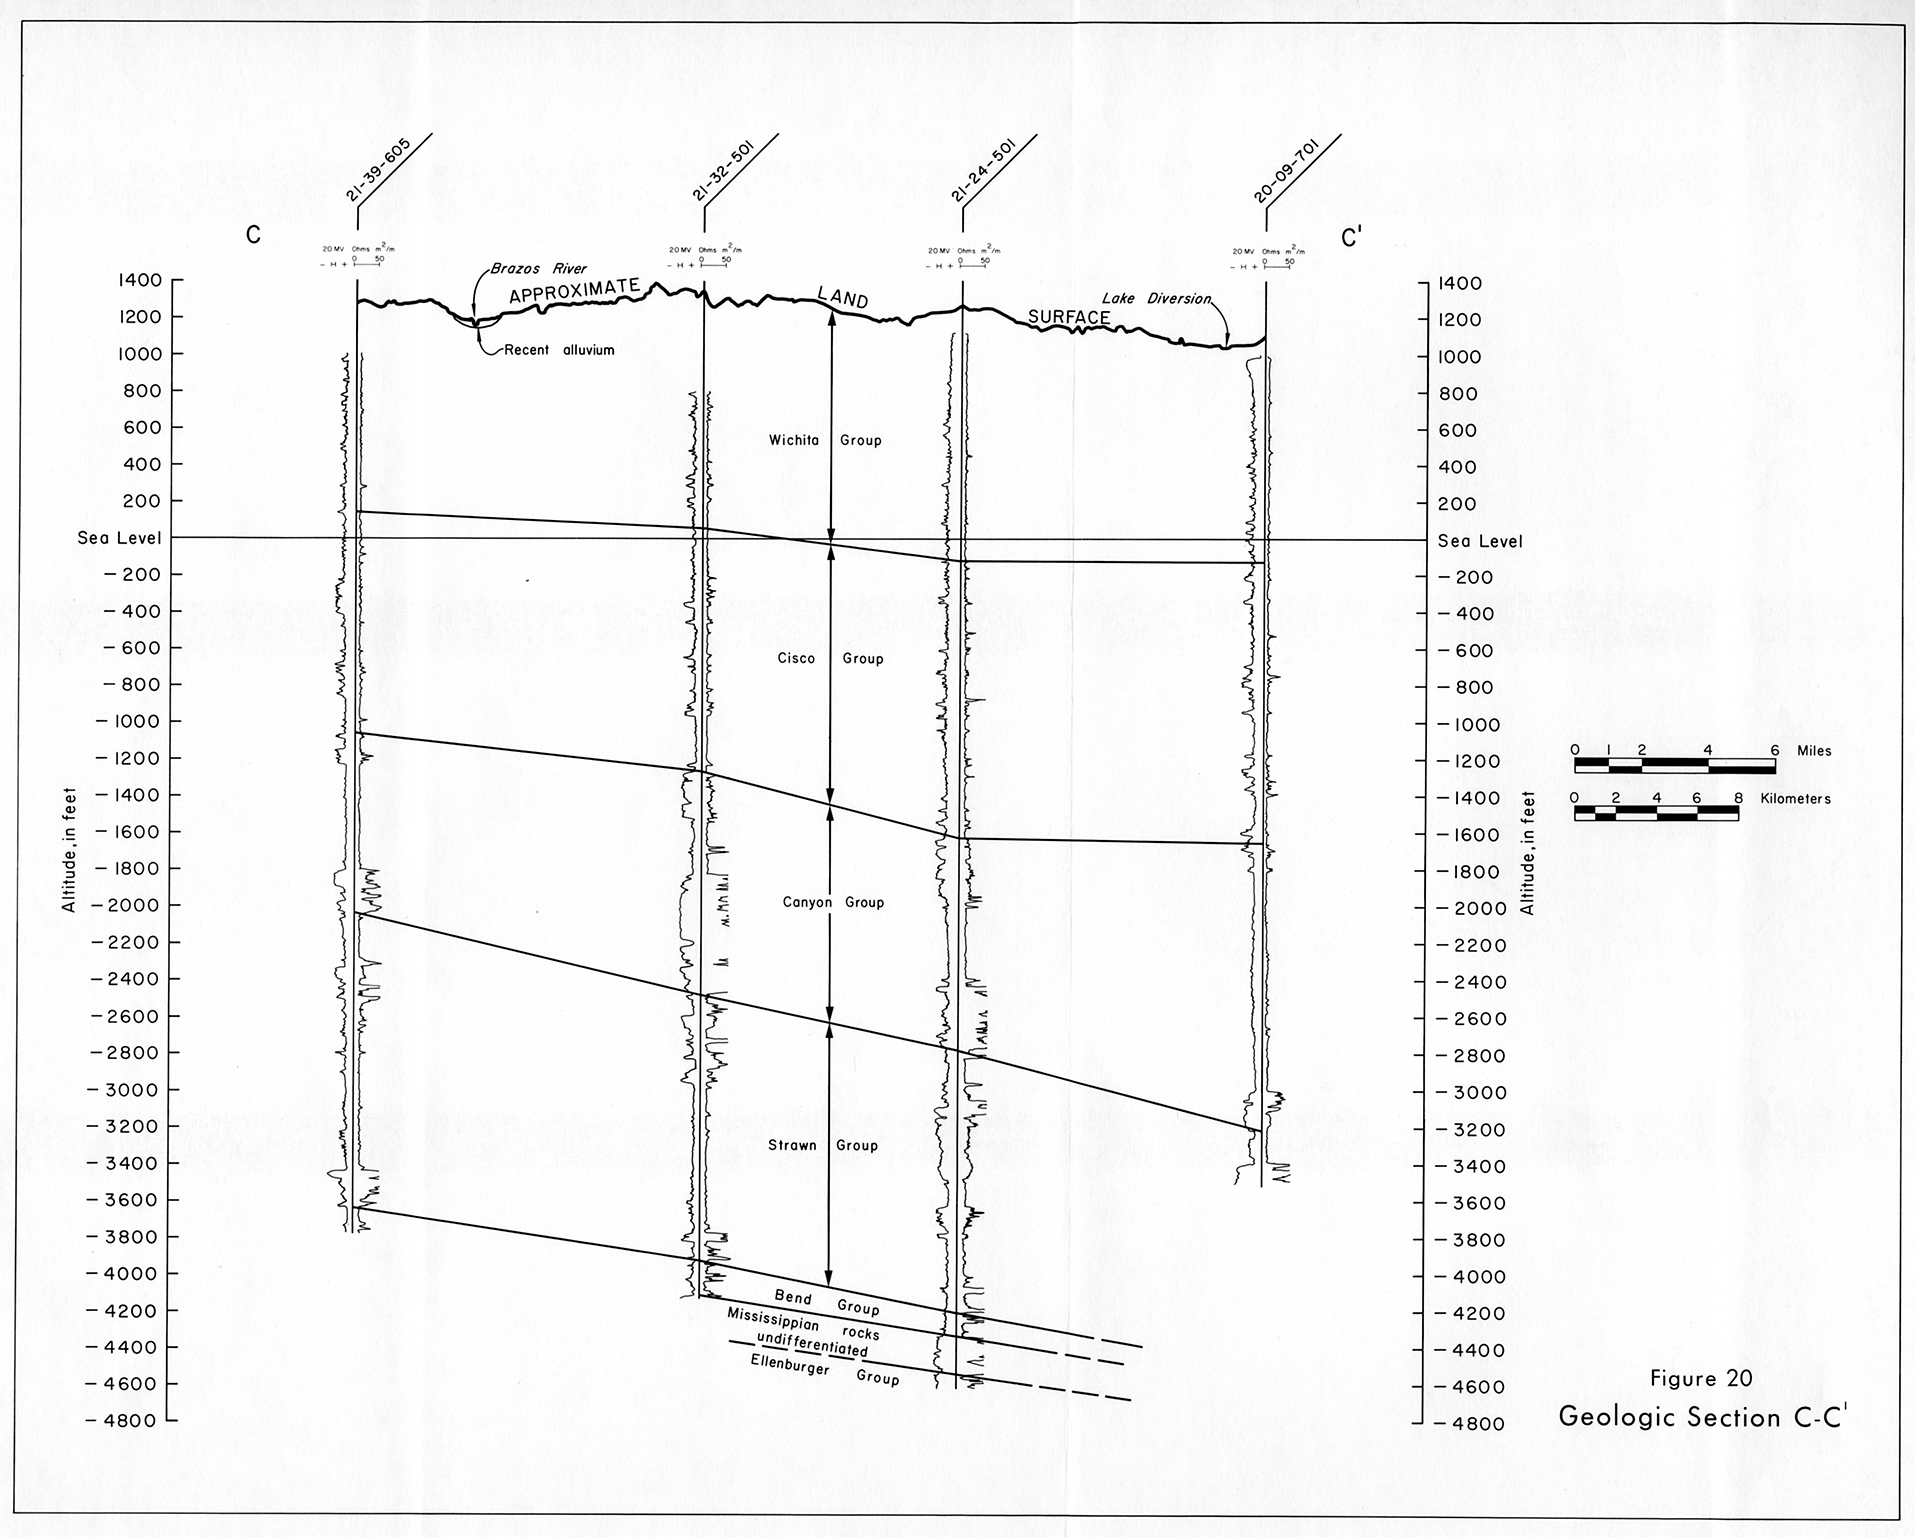
- Figure 20: Geologic Section C-C'
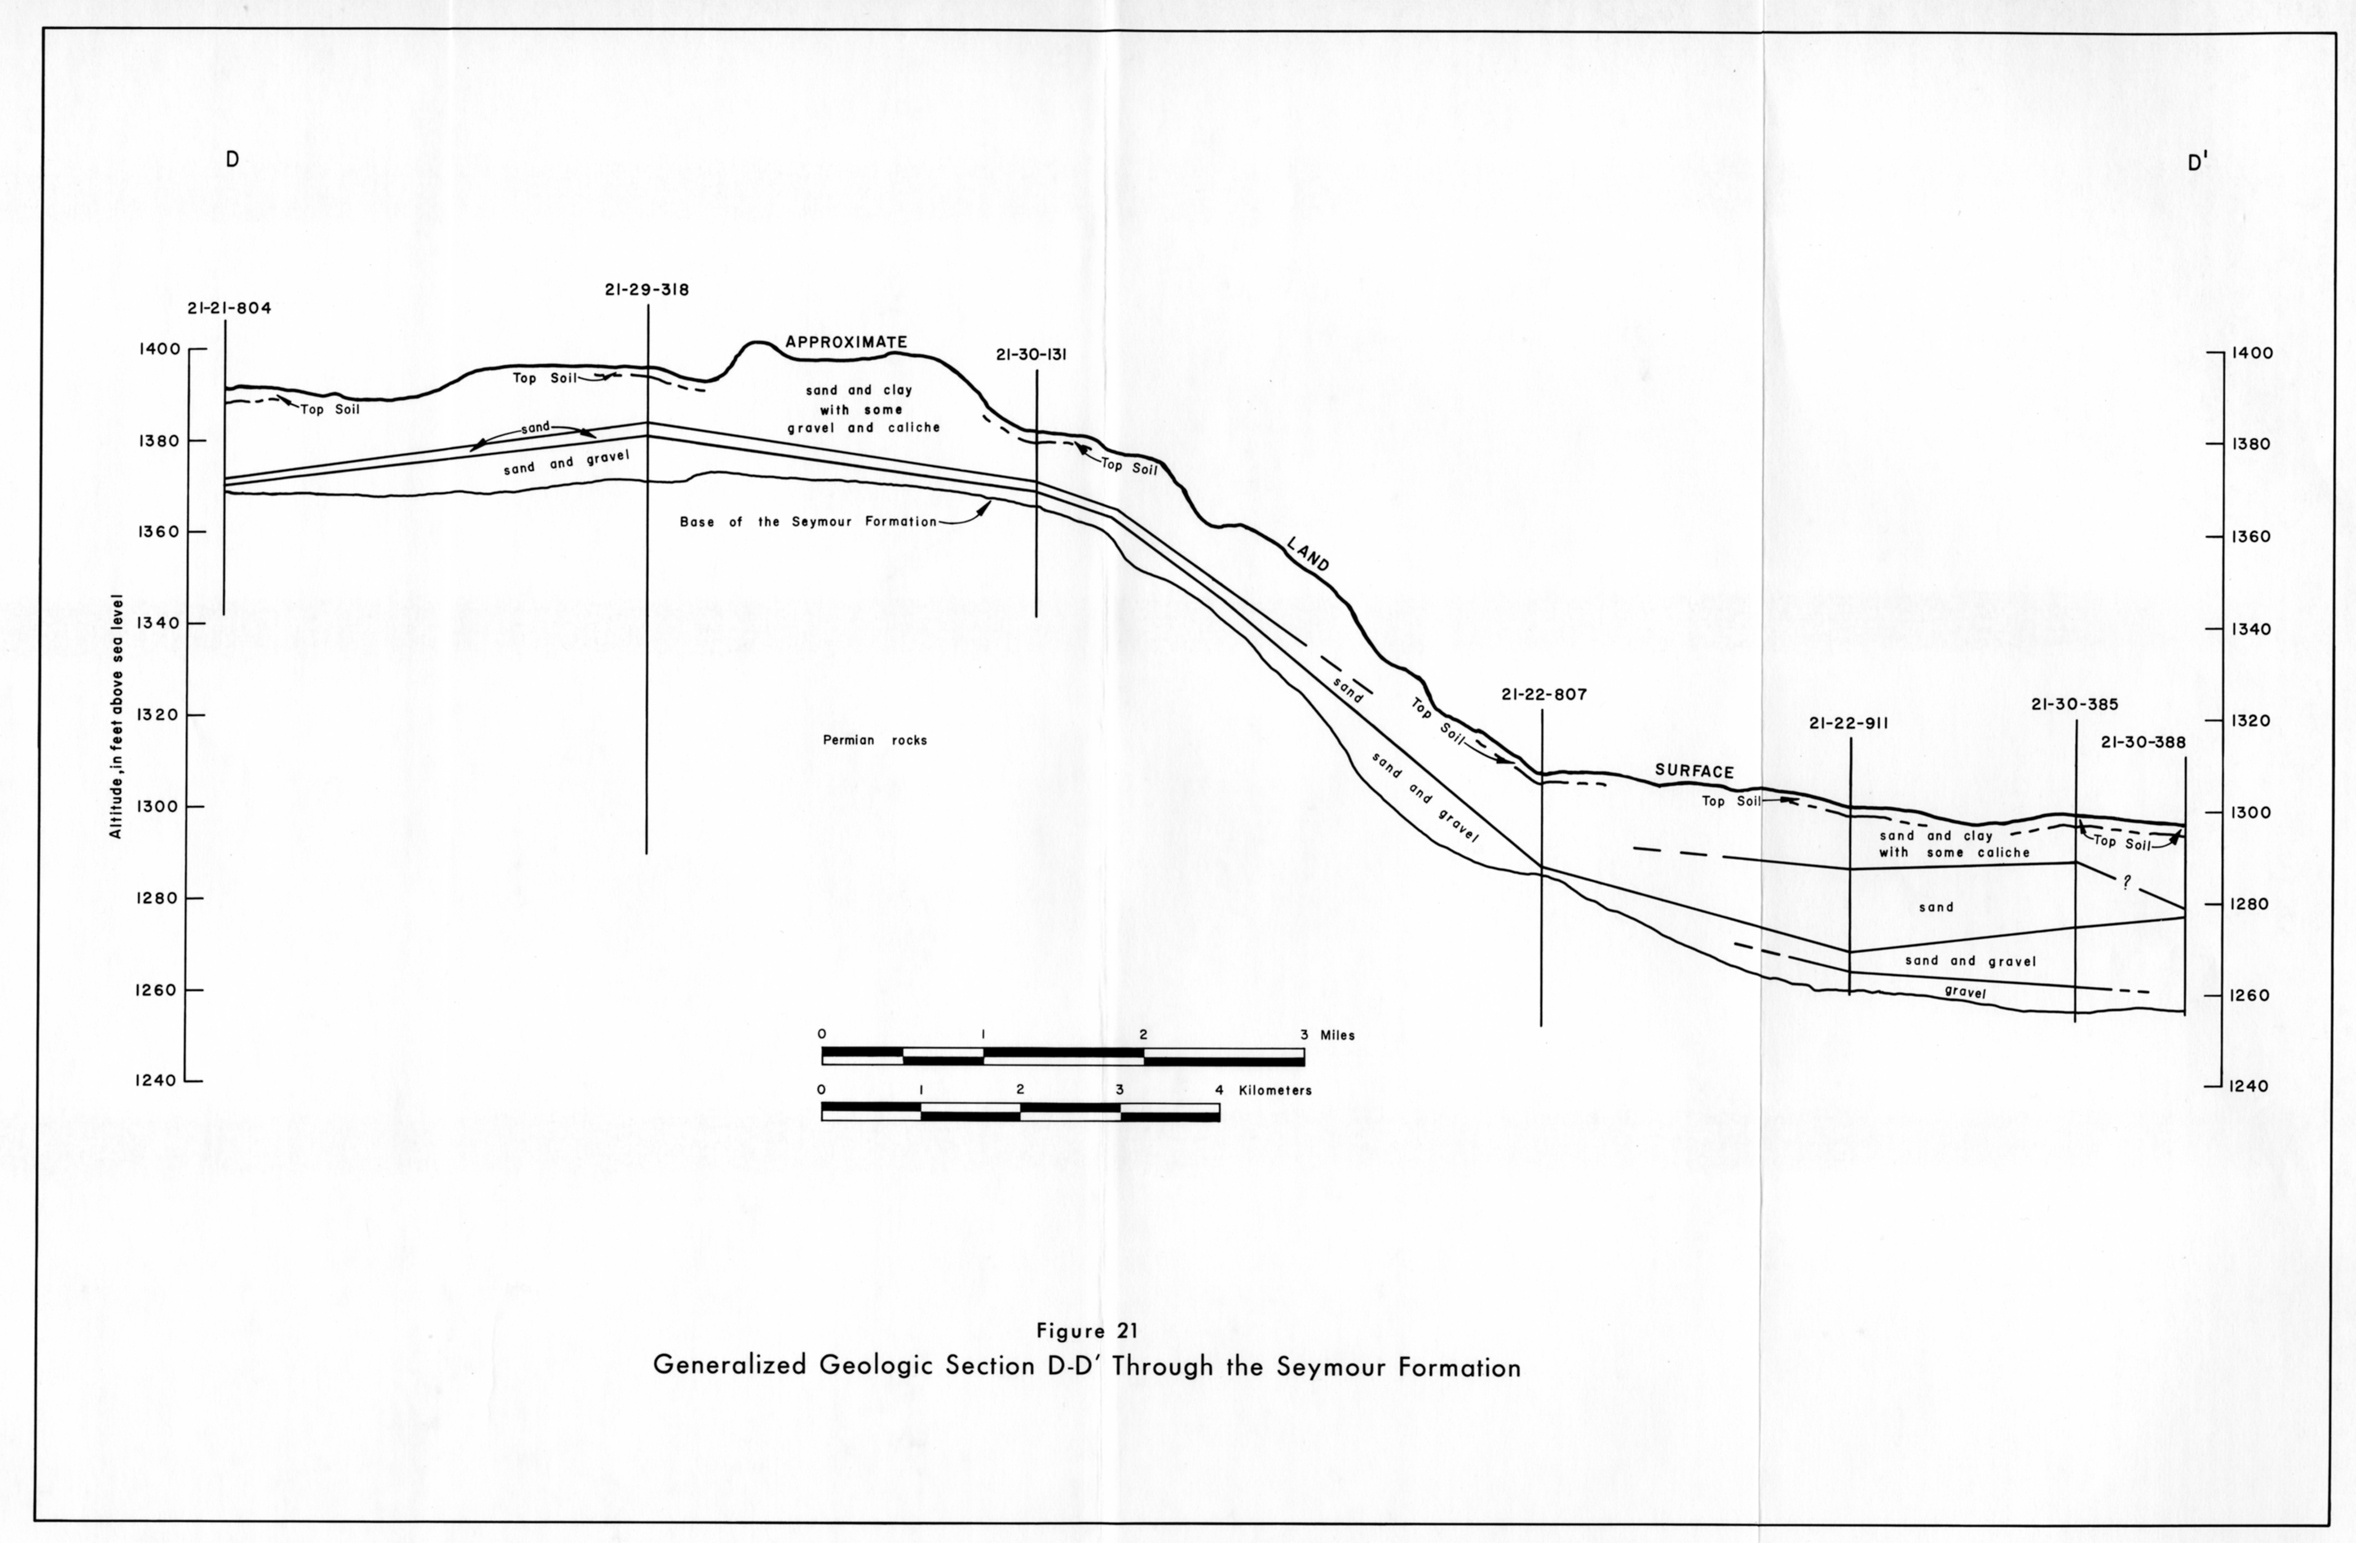
- Figure 21: Generalized Geologic Section D-D' Through the Seymour Formation
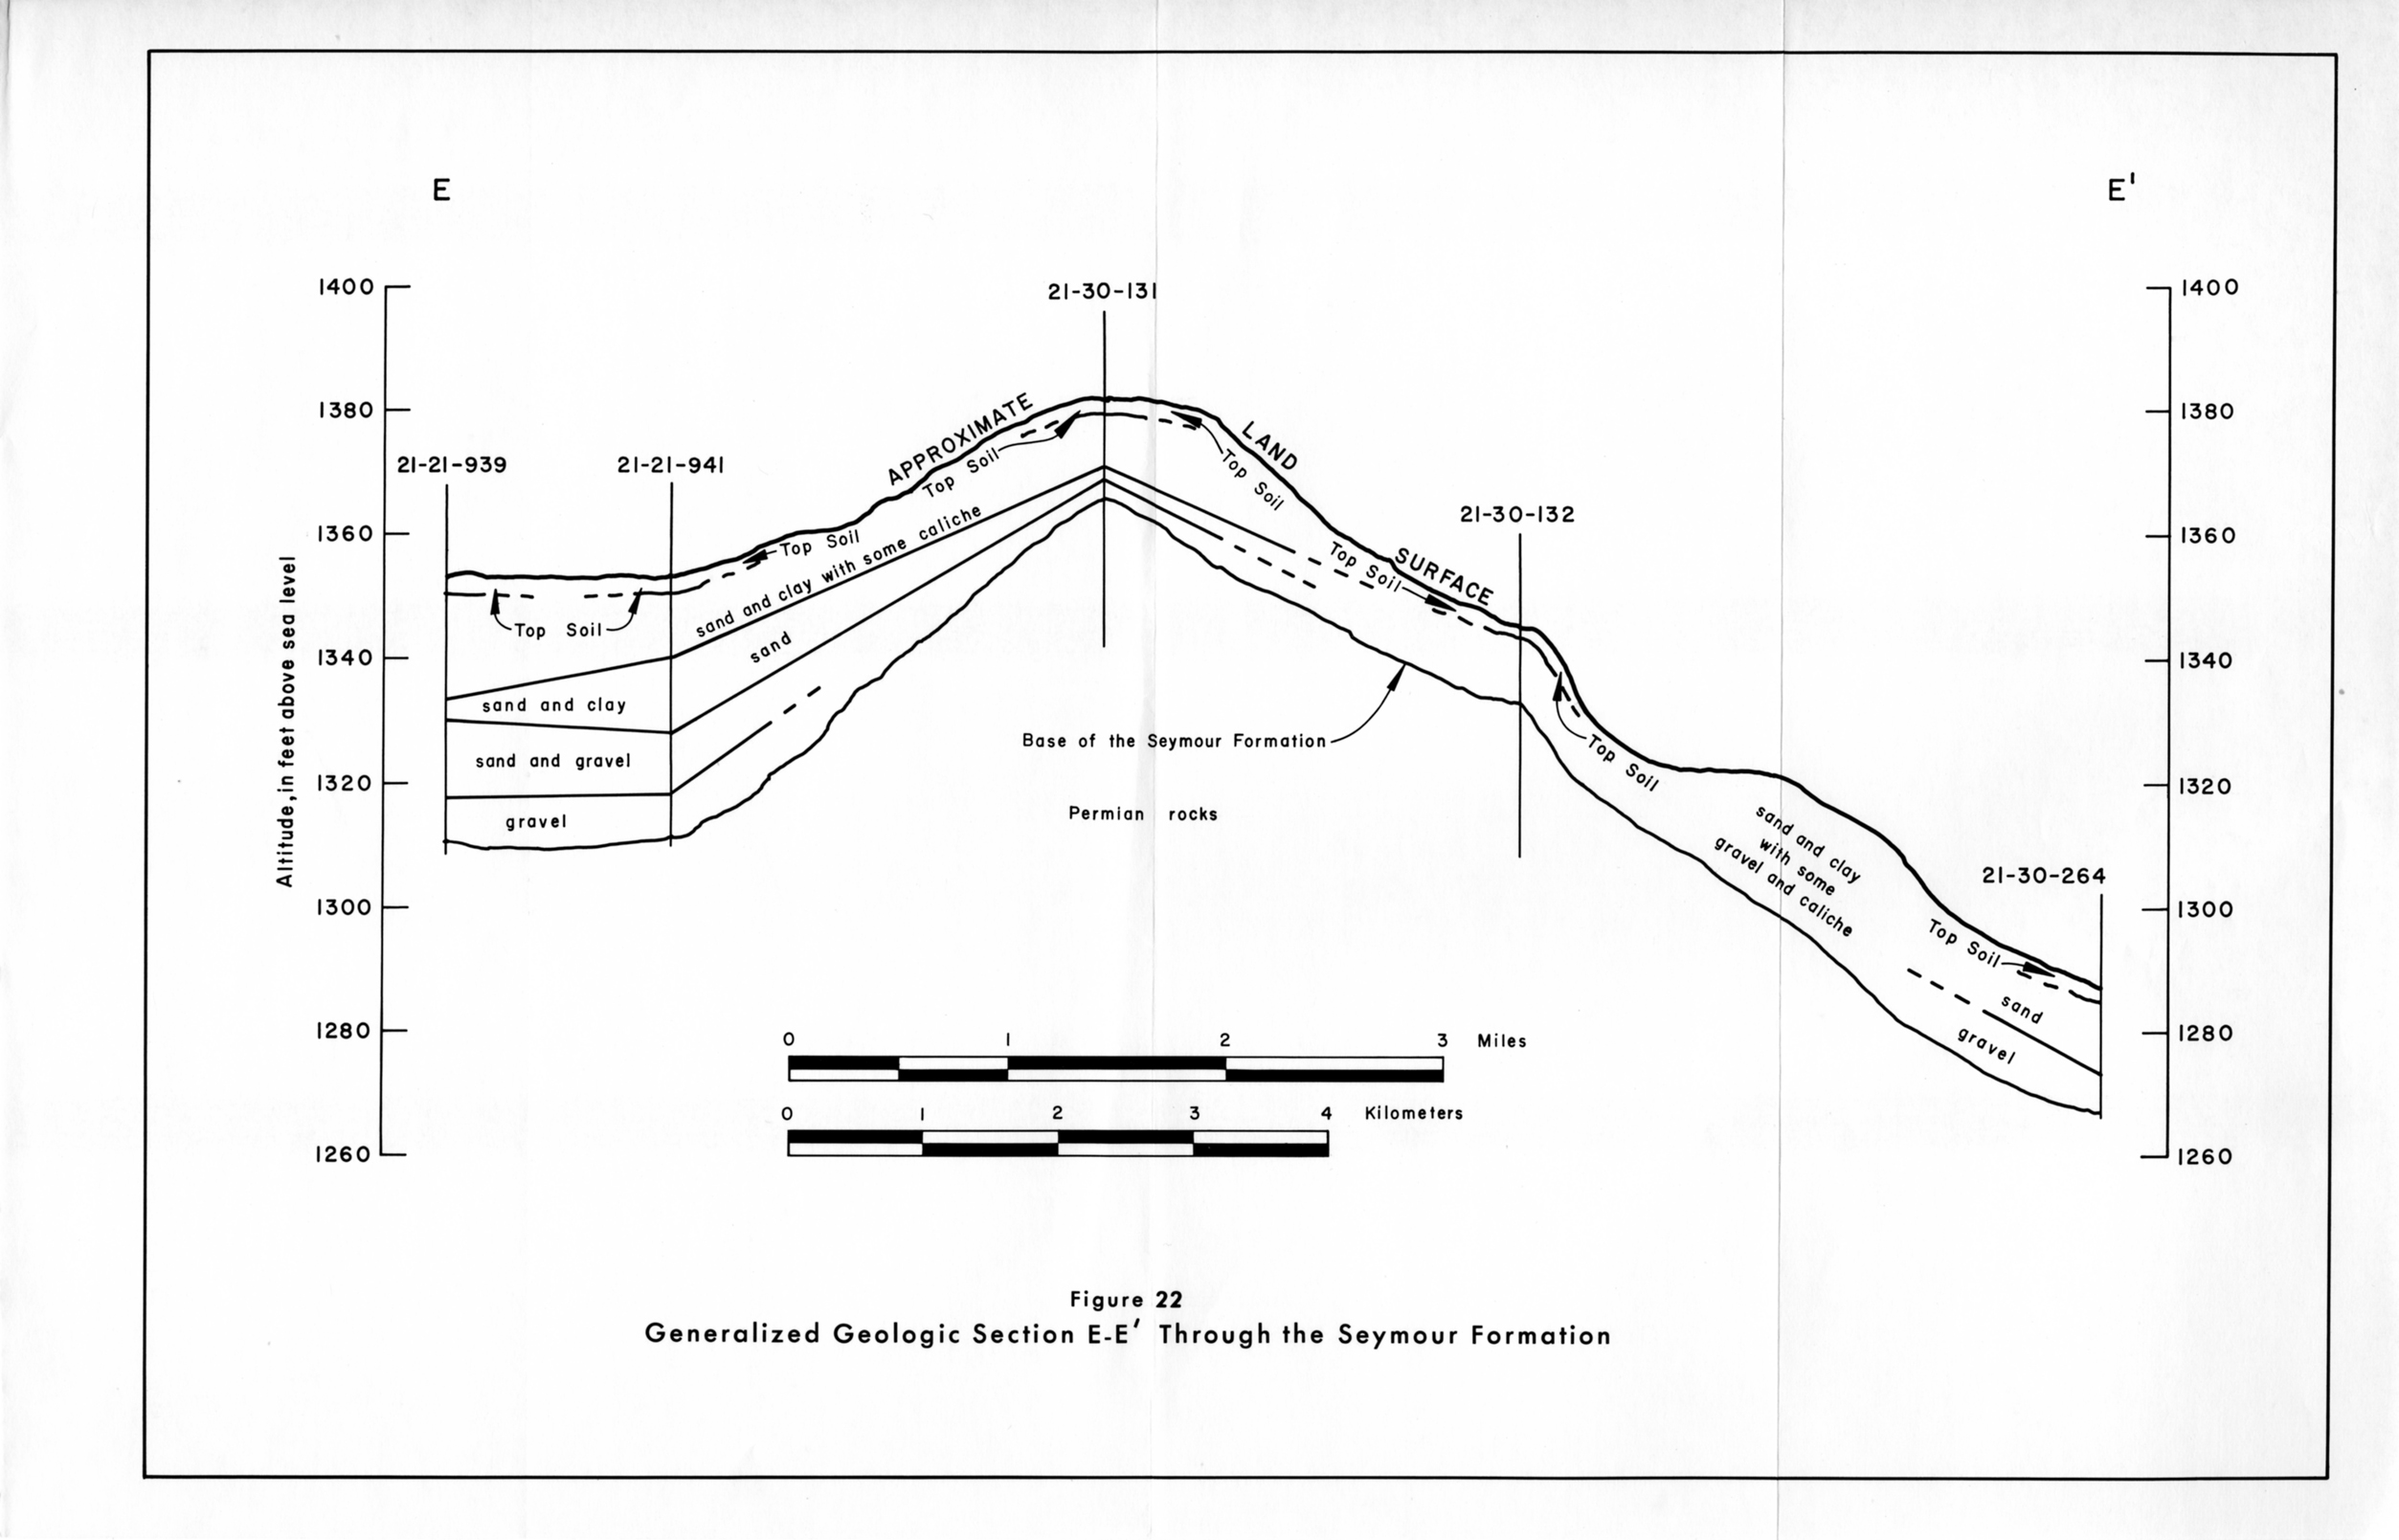
- Figure 22: Generalized Geologic Section E-E' Through the Seymour Formation