Report 163 By: William M. Sandeen and John B. Wesselman, U.S. Geological Survey | February 1973
Note: the following oversized fold-out maps were scanned separately from the body of the report above. "missing pages" in the report are actually these fold out maps.
- Report 163 - Ground-Water Resources of Brazoria County, Texas (pdf - 26.9 MB)
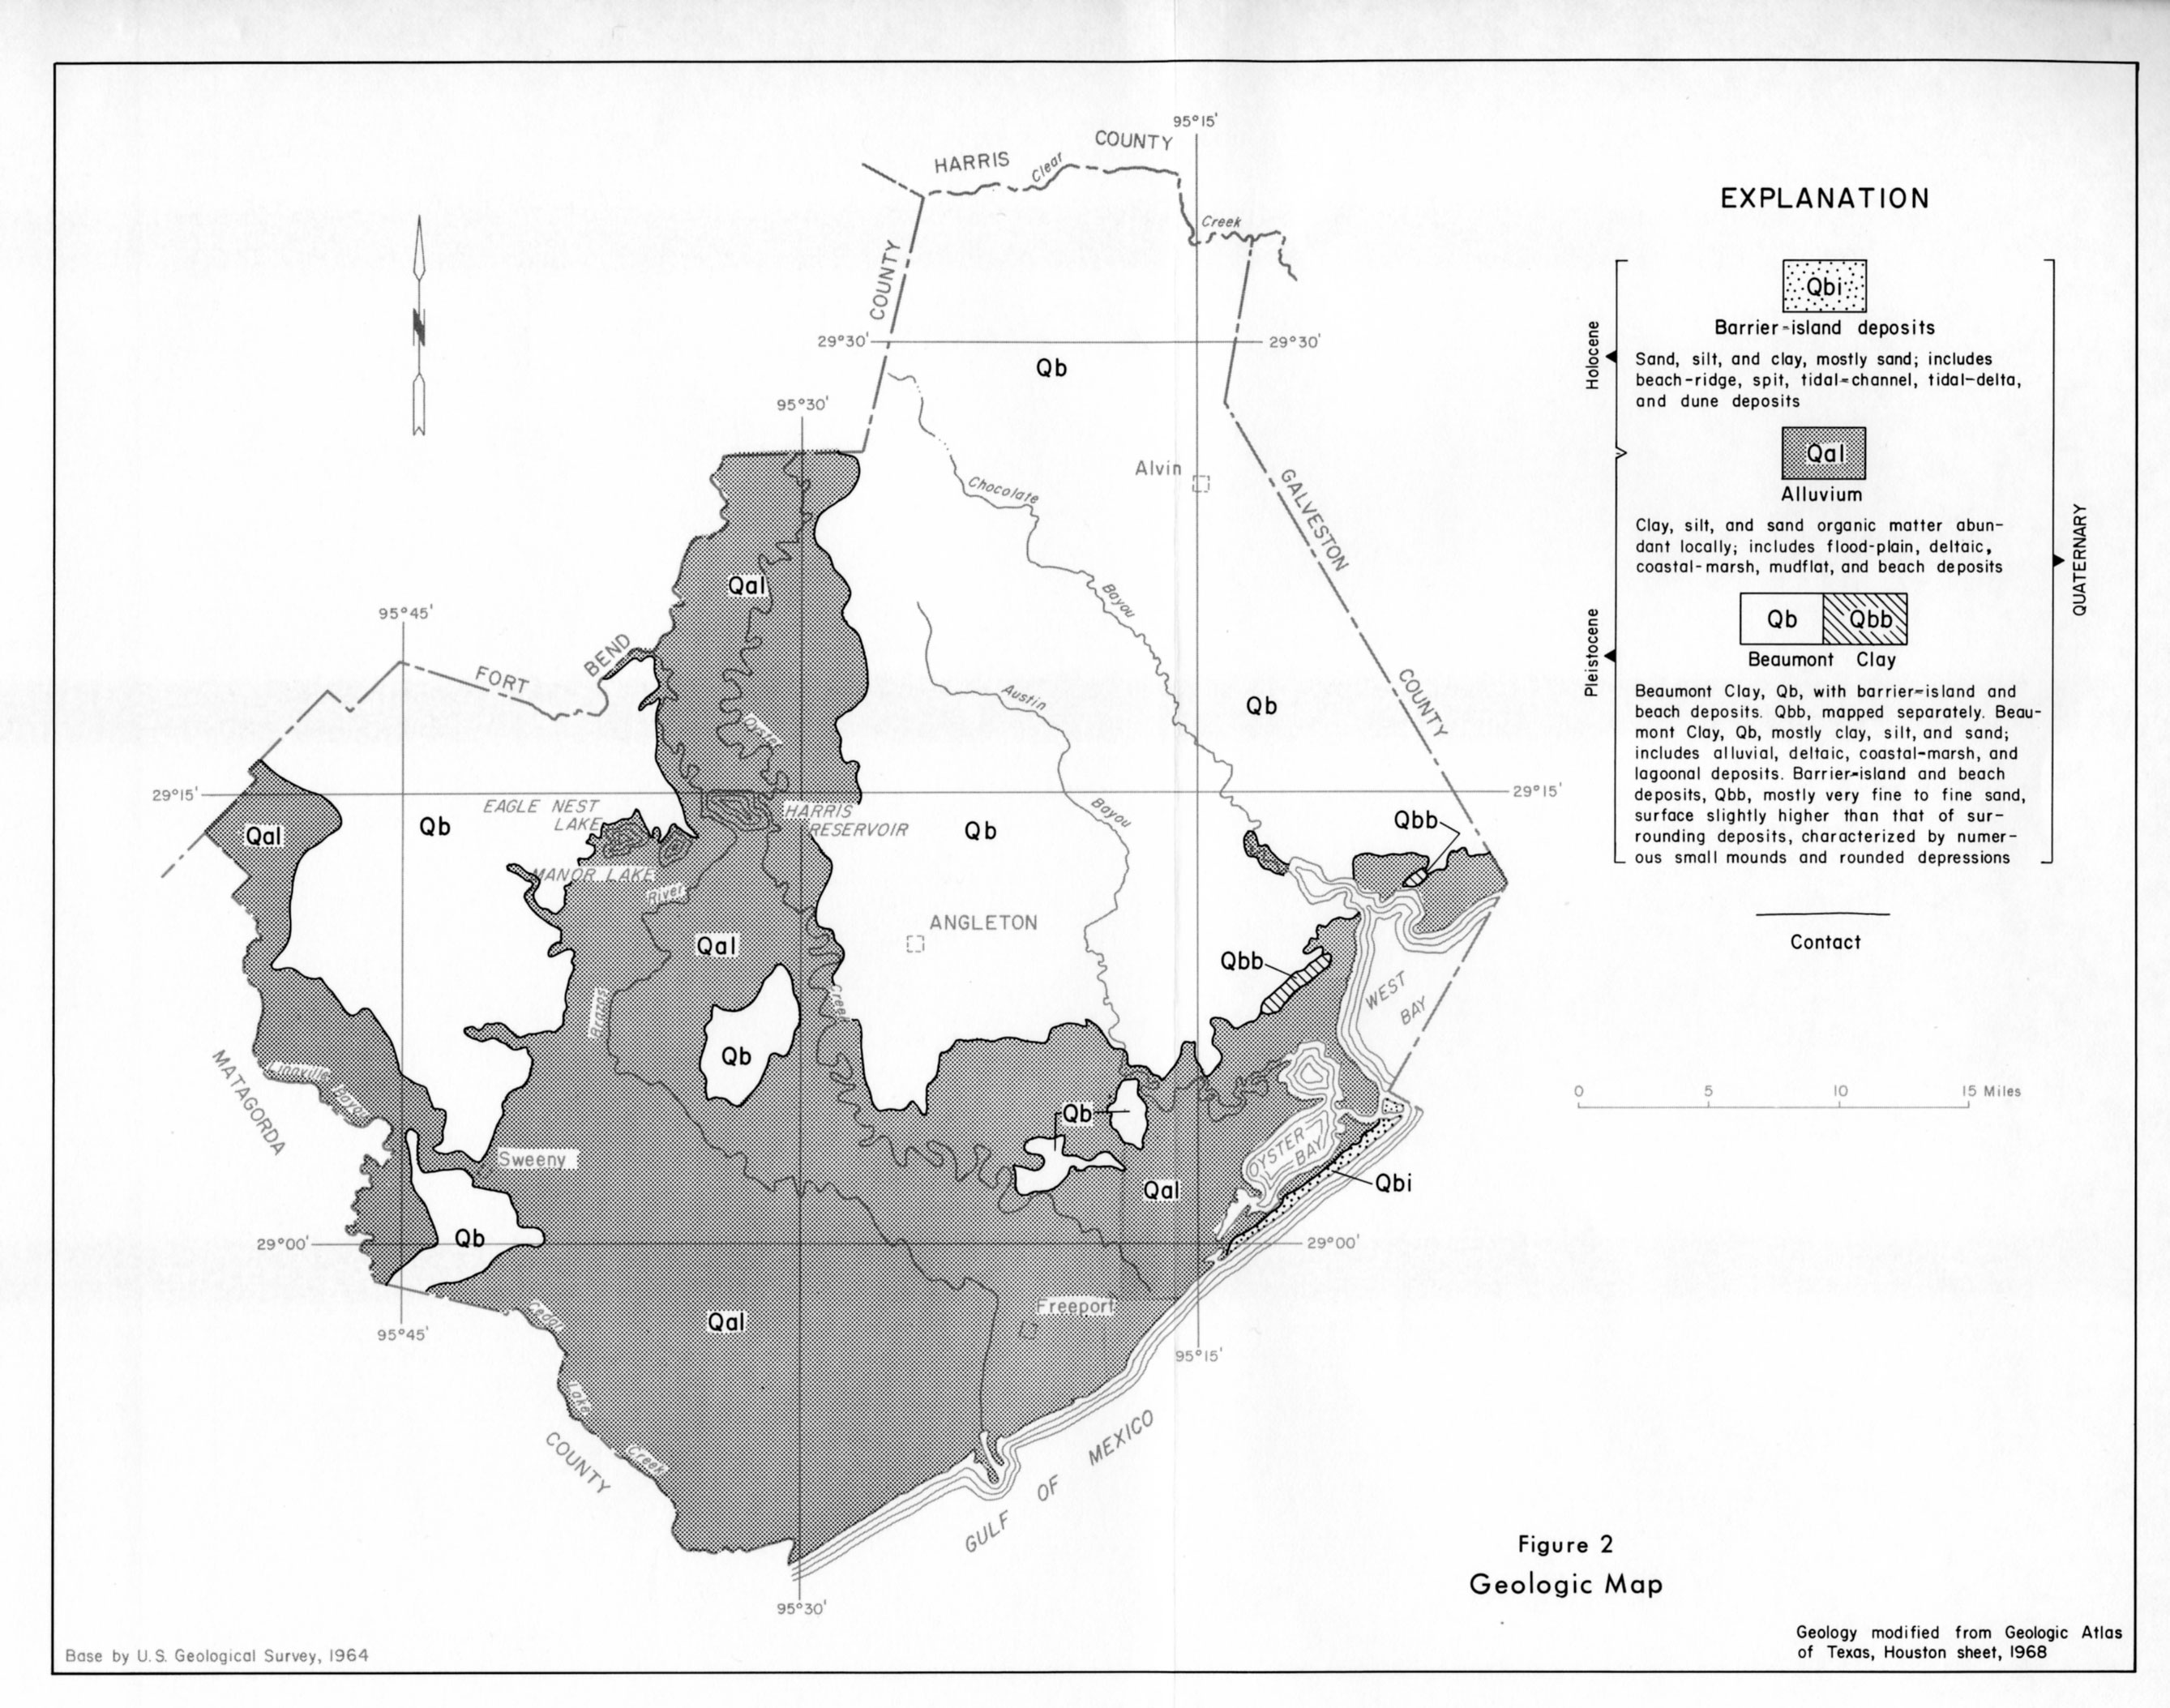
- Figure 2: Geologic Map
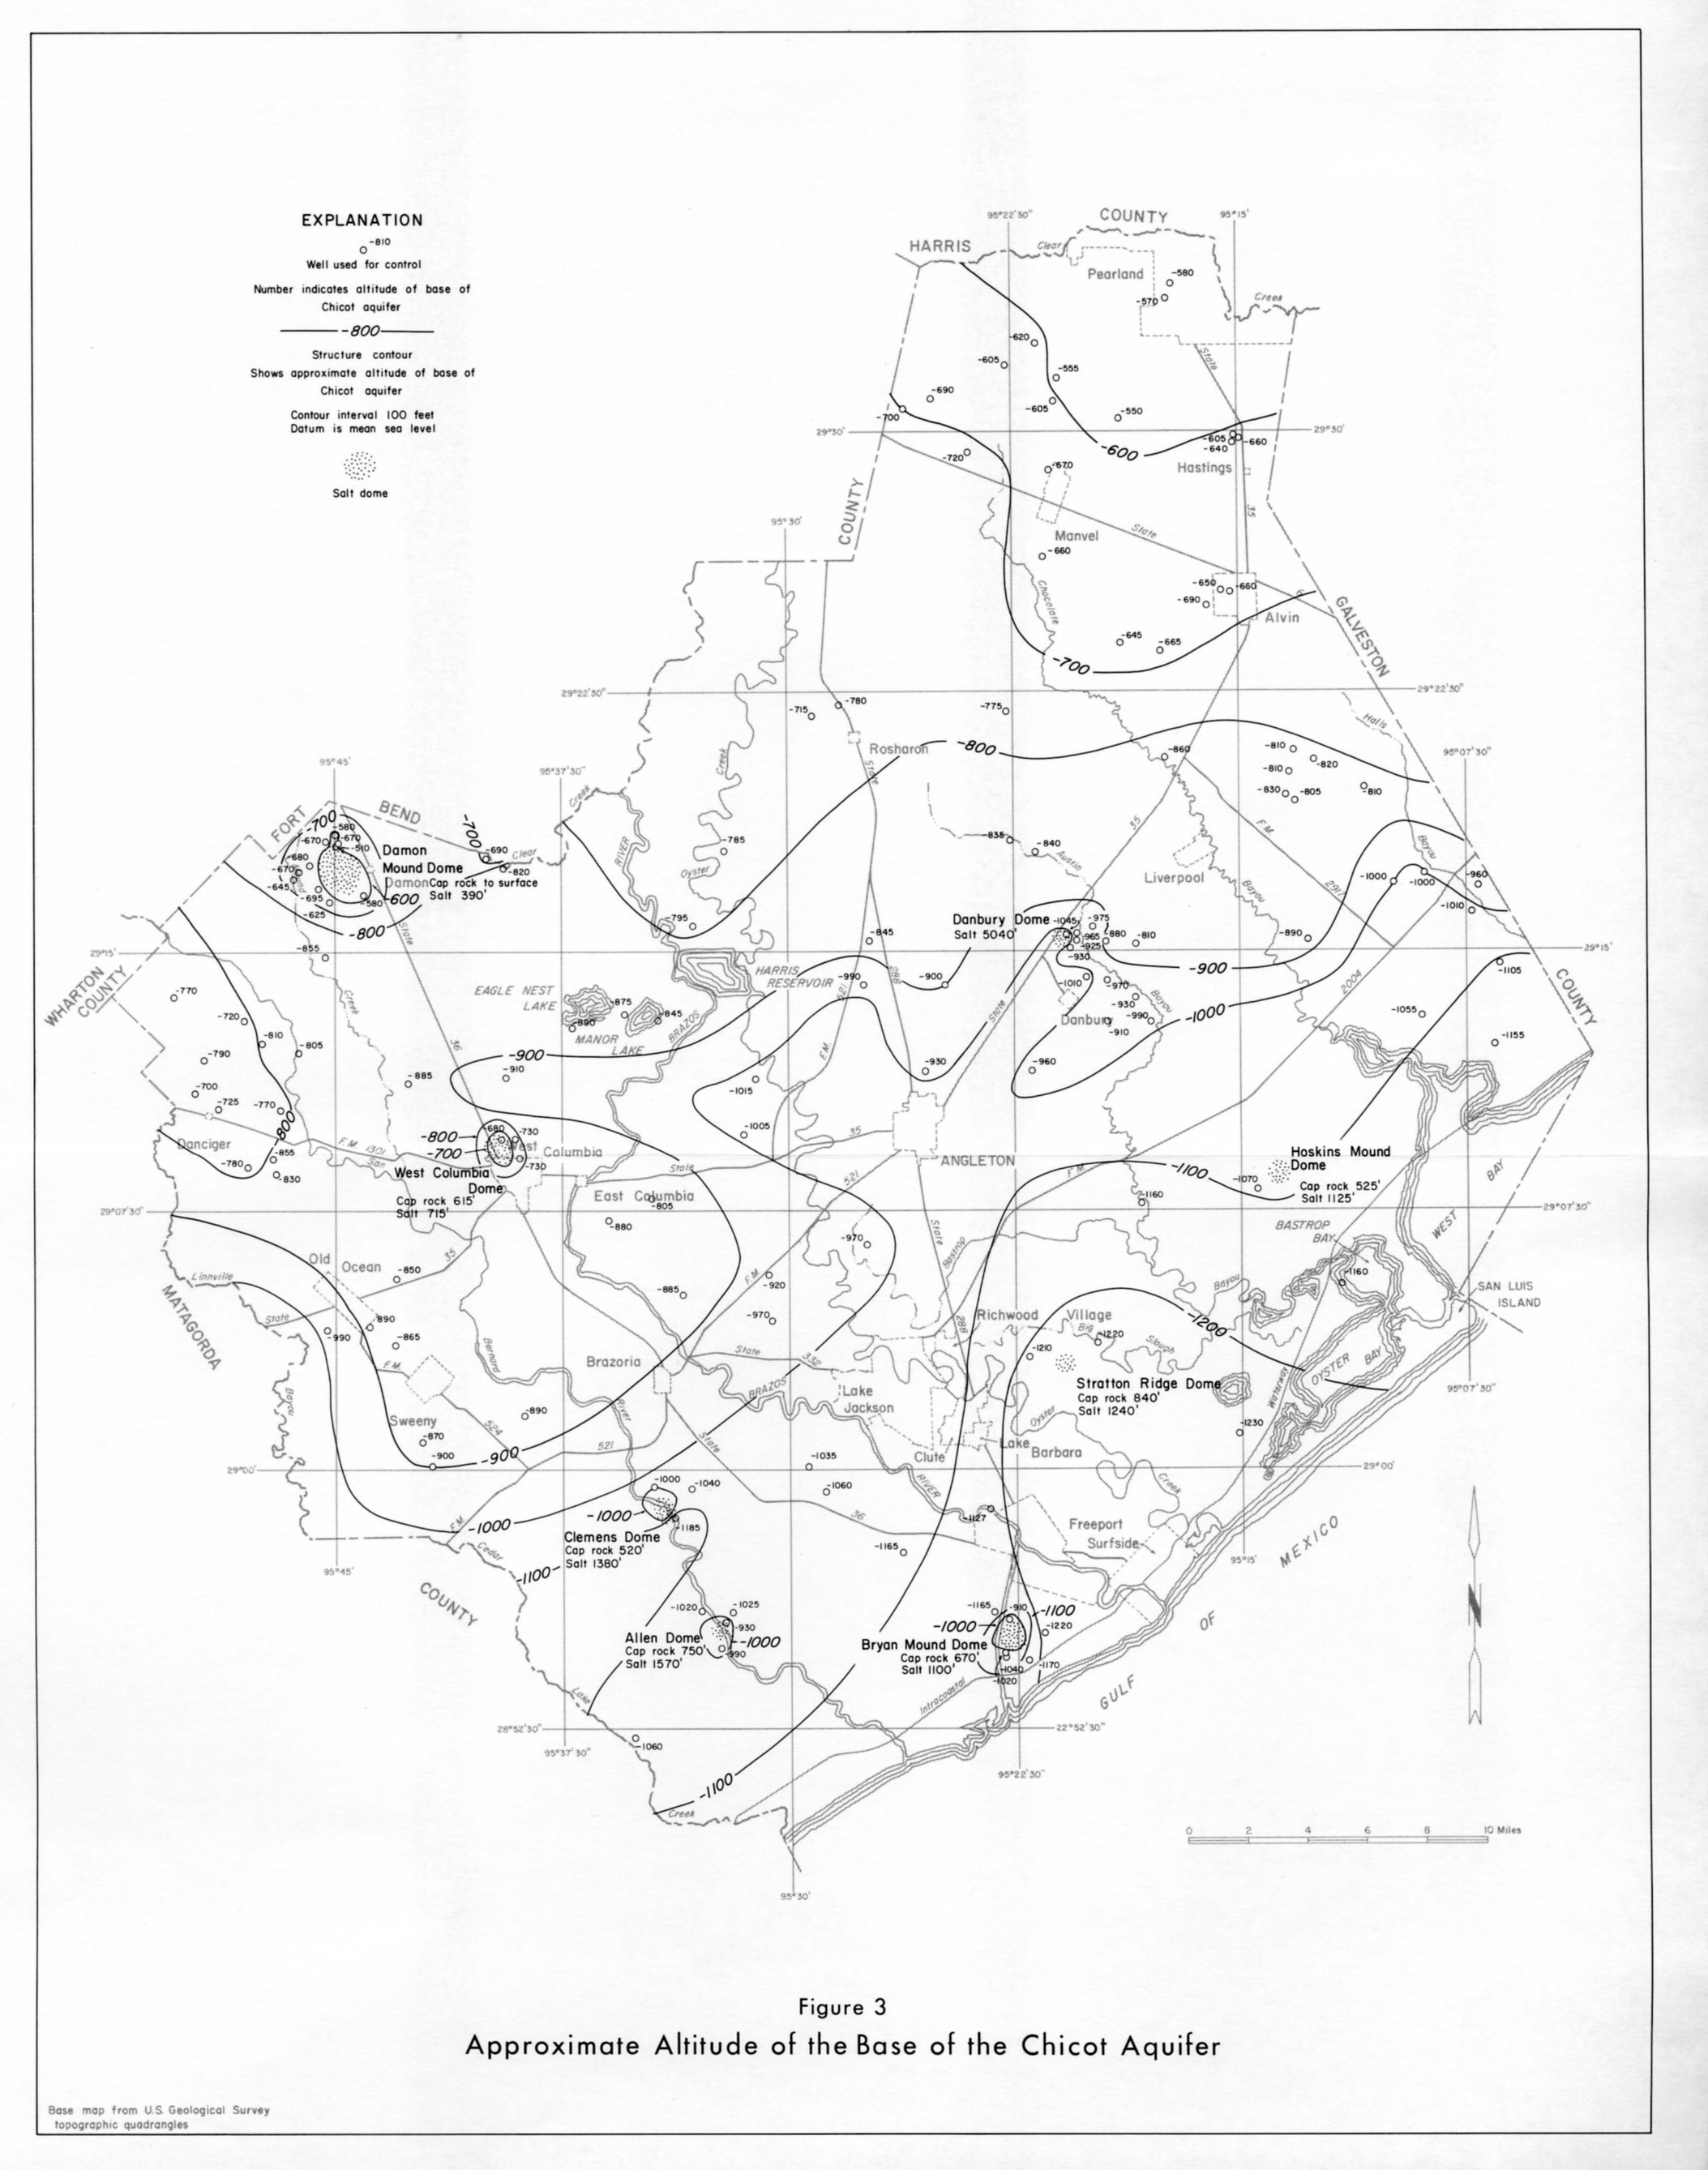
- Figure 3: Approximate Altitude of the Base of the Chicot Aquifer
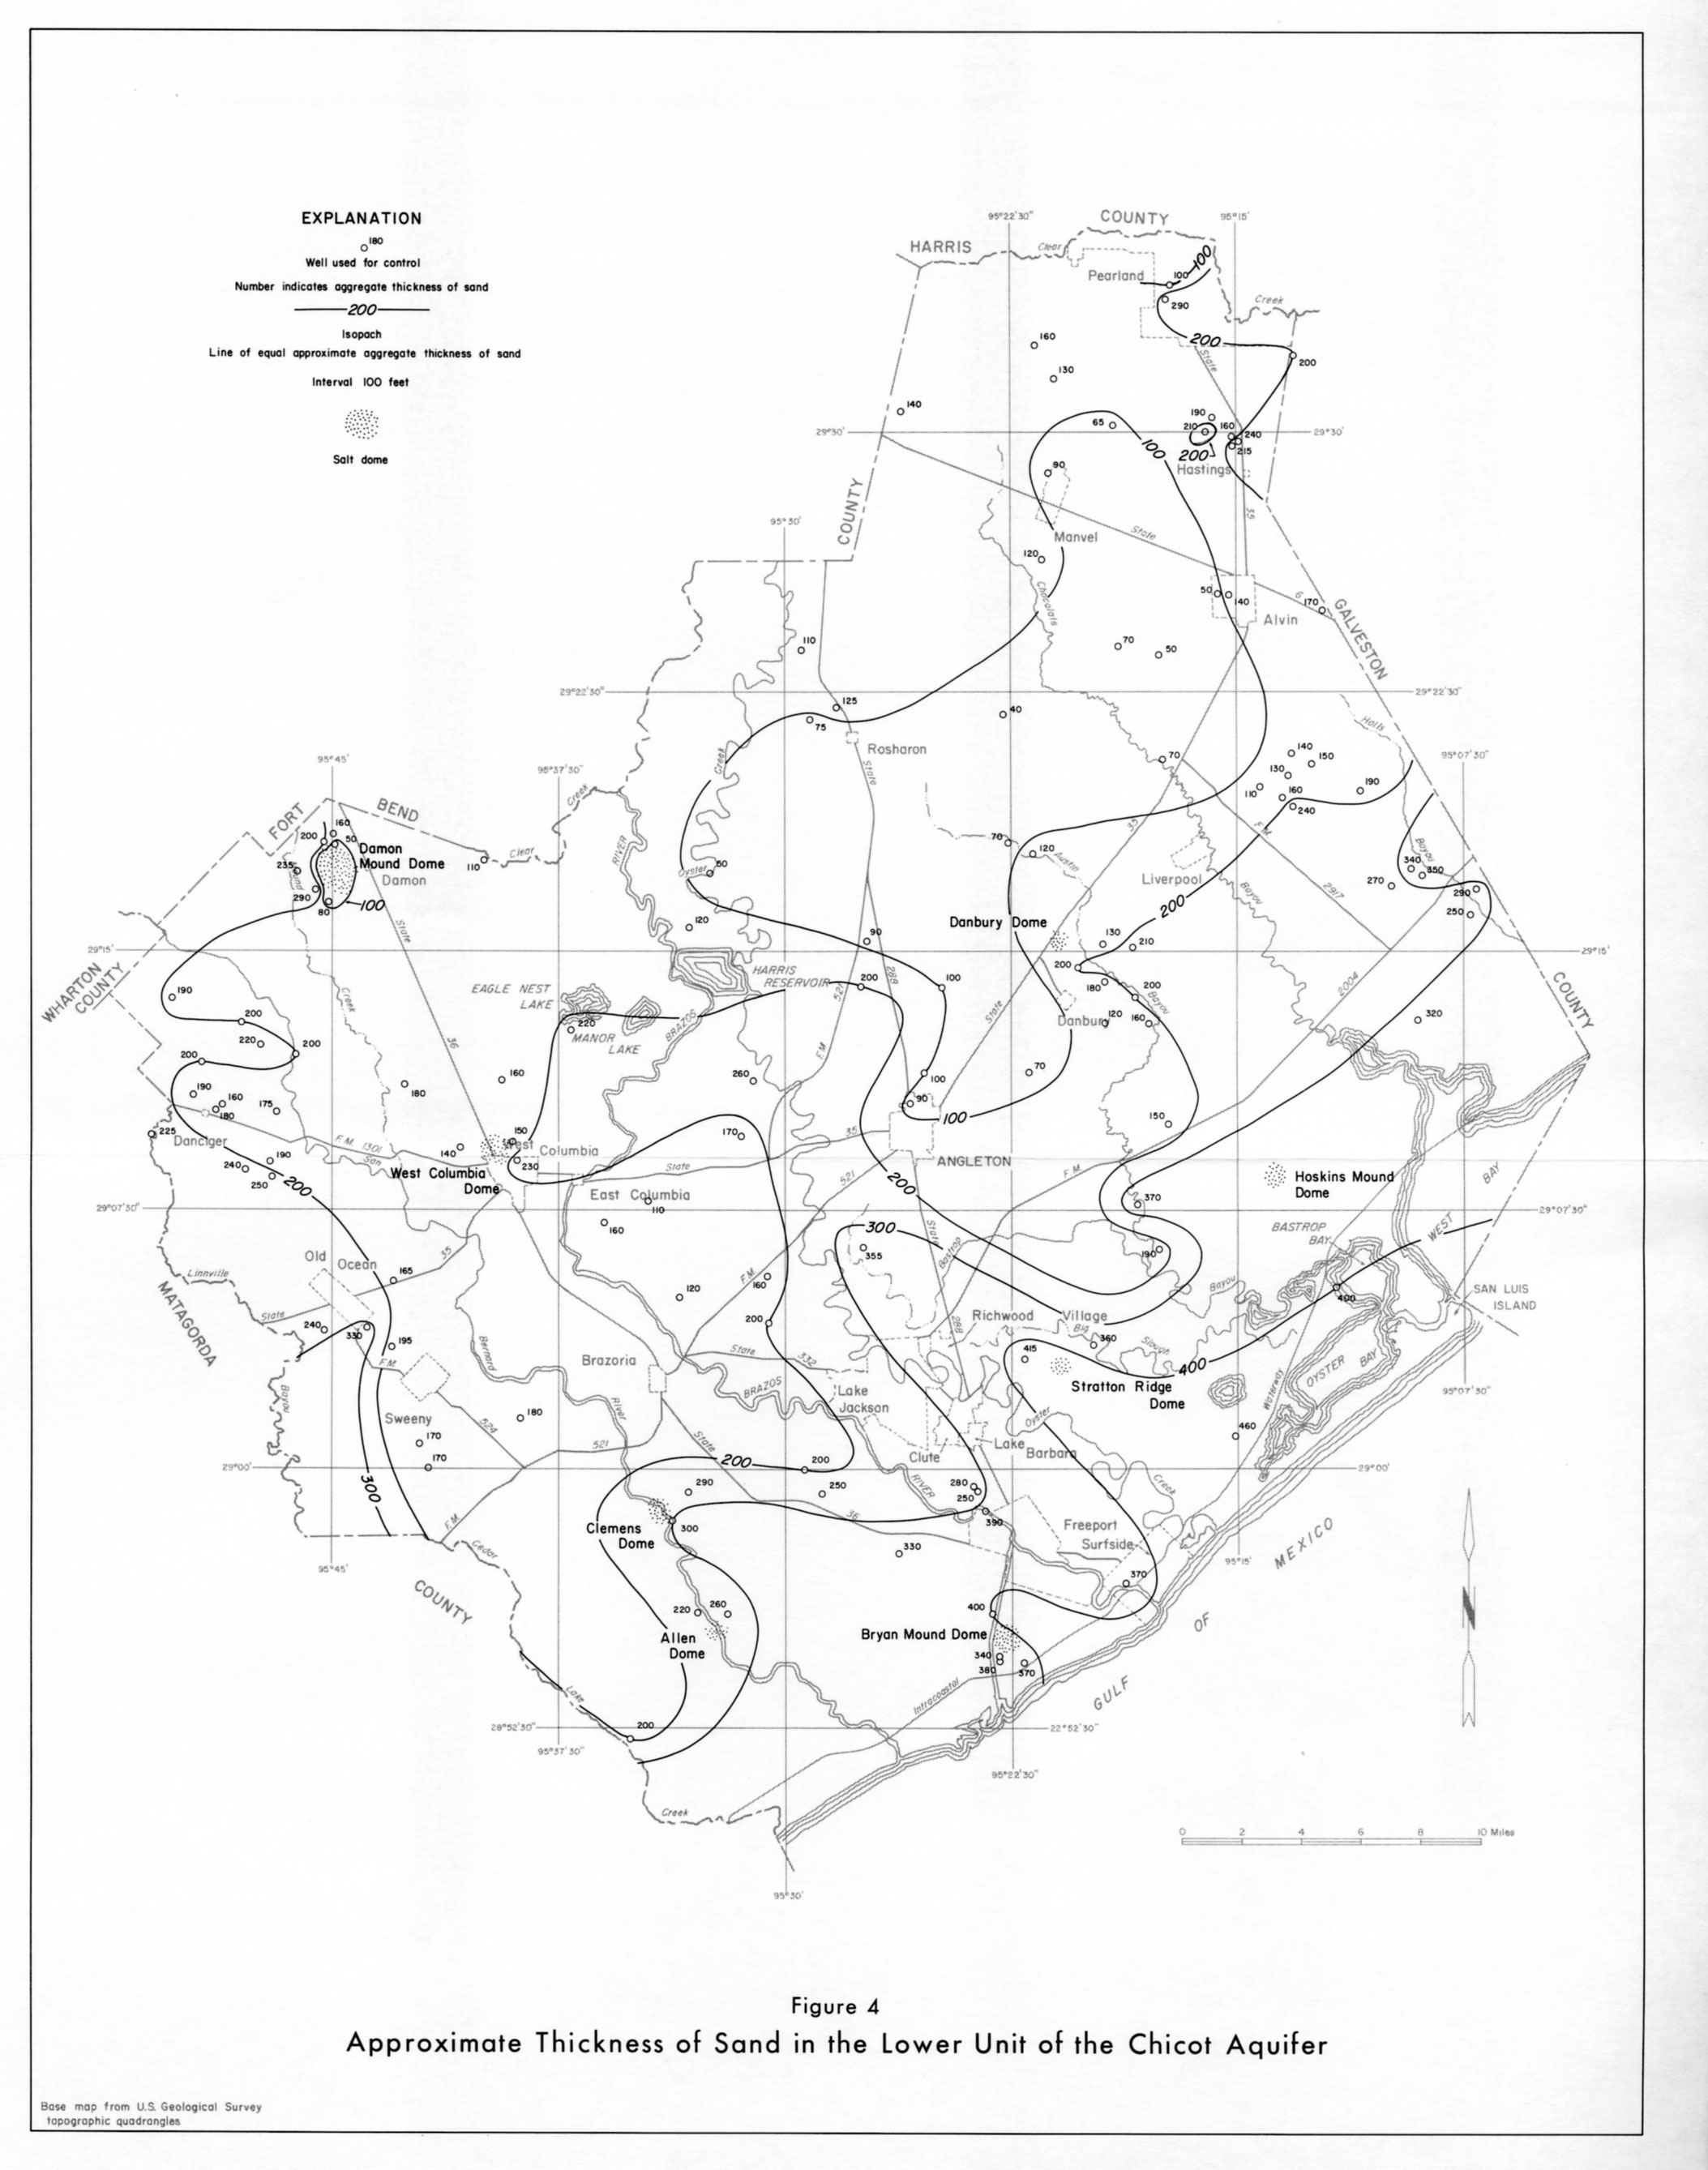
- Figure 4: Approximate Thickness of Sand in the Lower Unit of the Chicot Aquifer
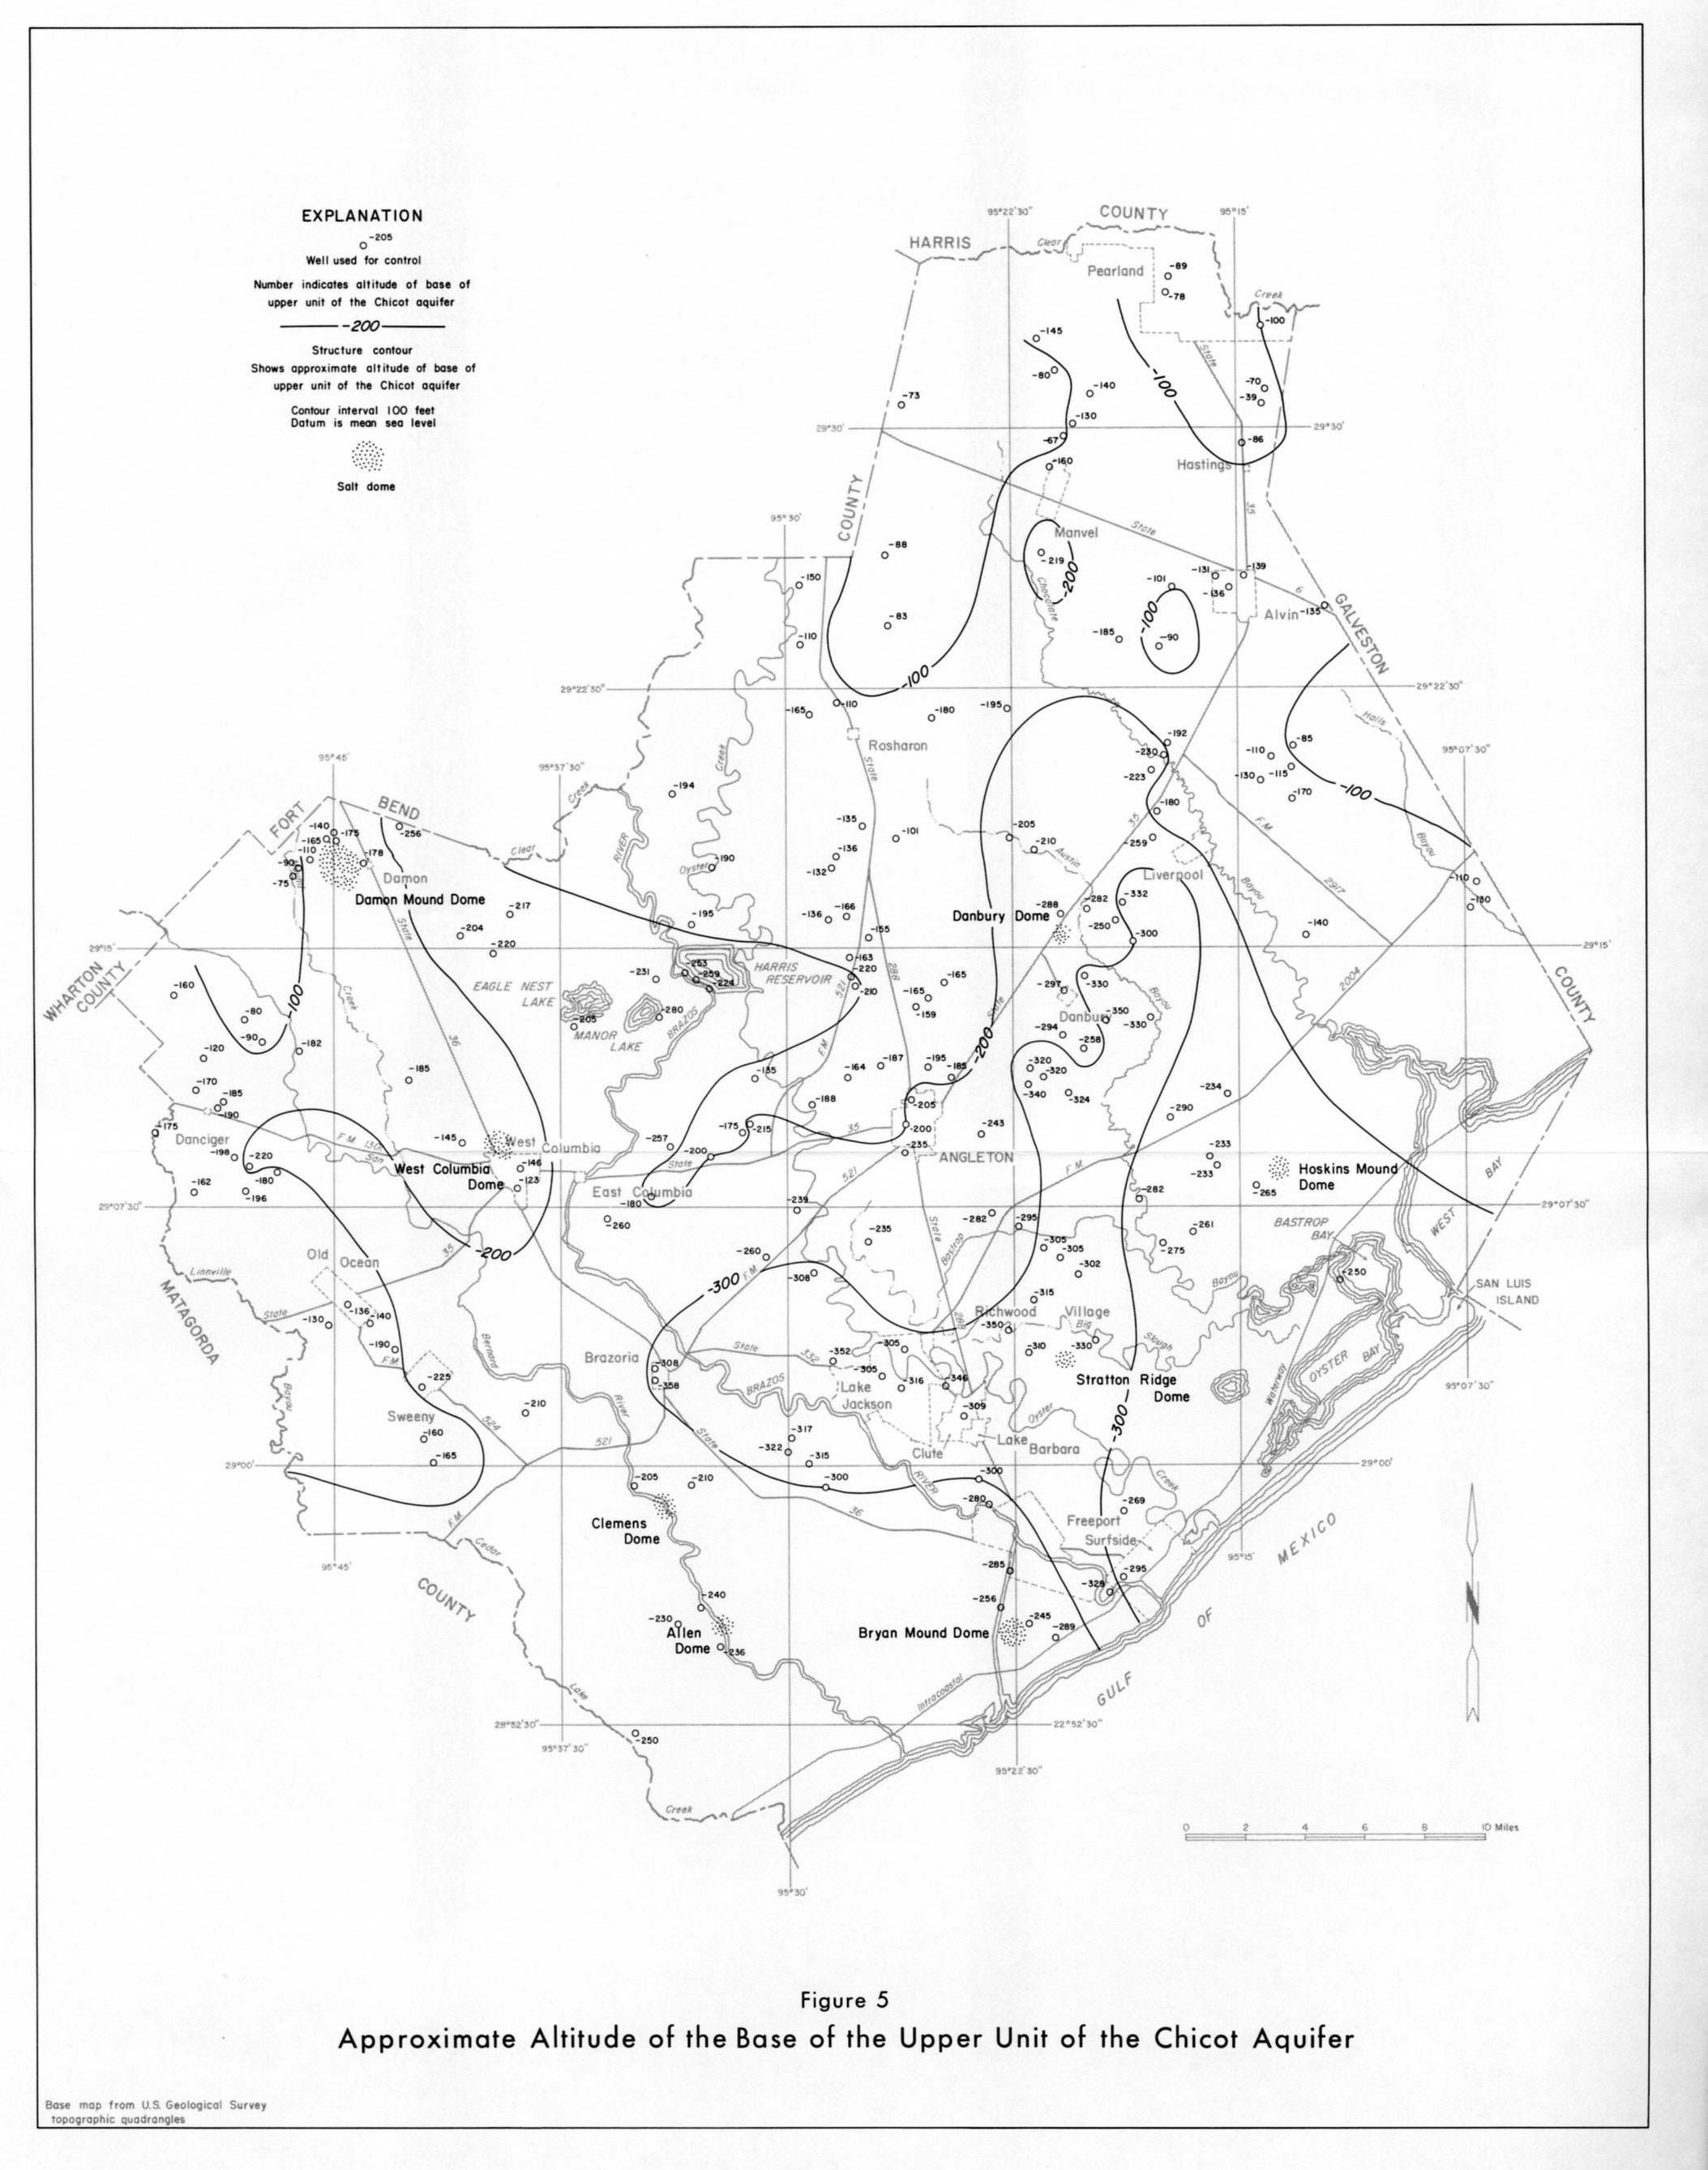
- Figure 5: Approximate Altitude of the Base of the Upper Unit of the Chicot Aquifer
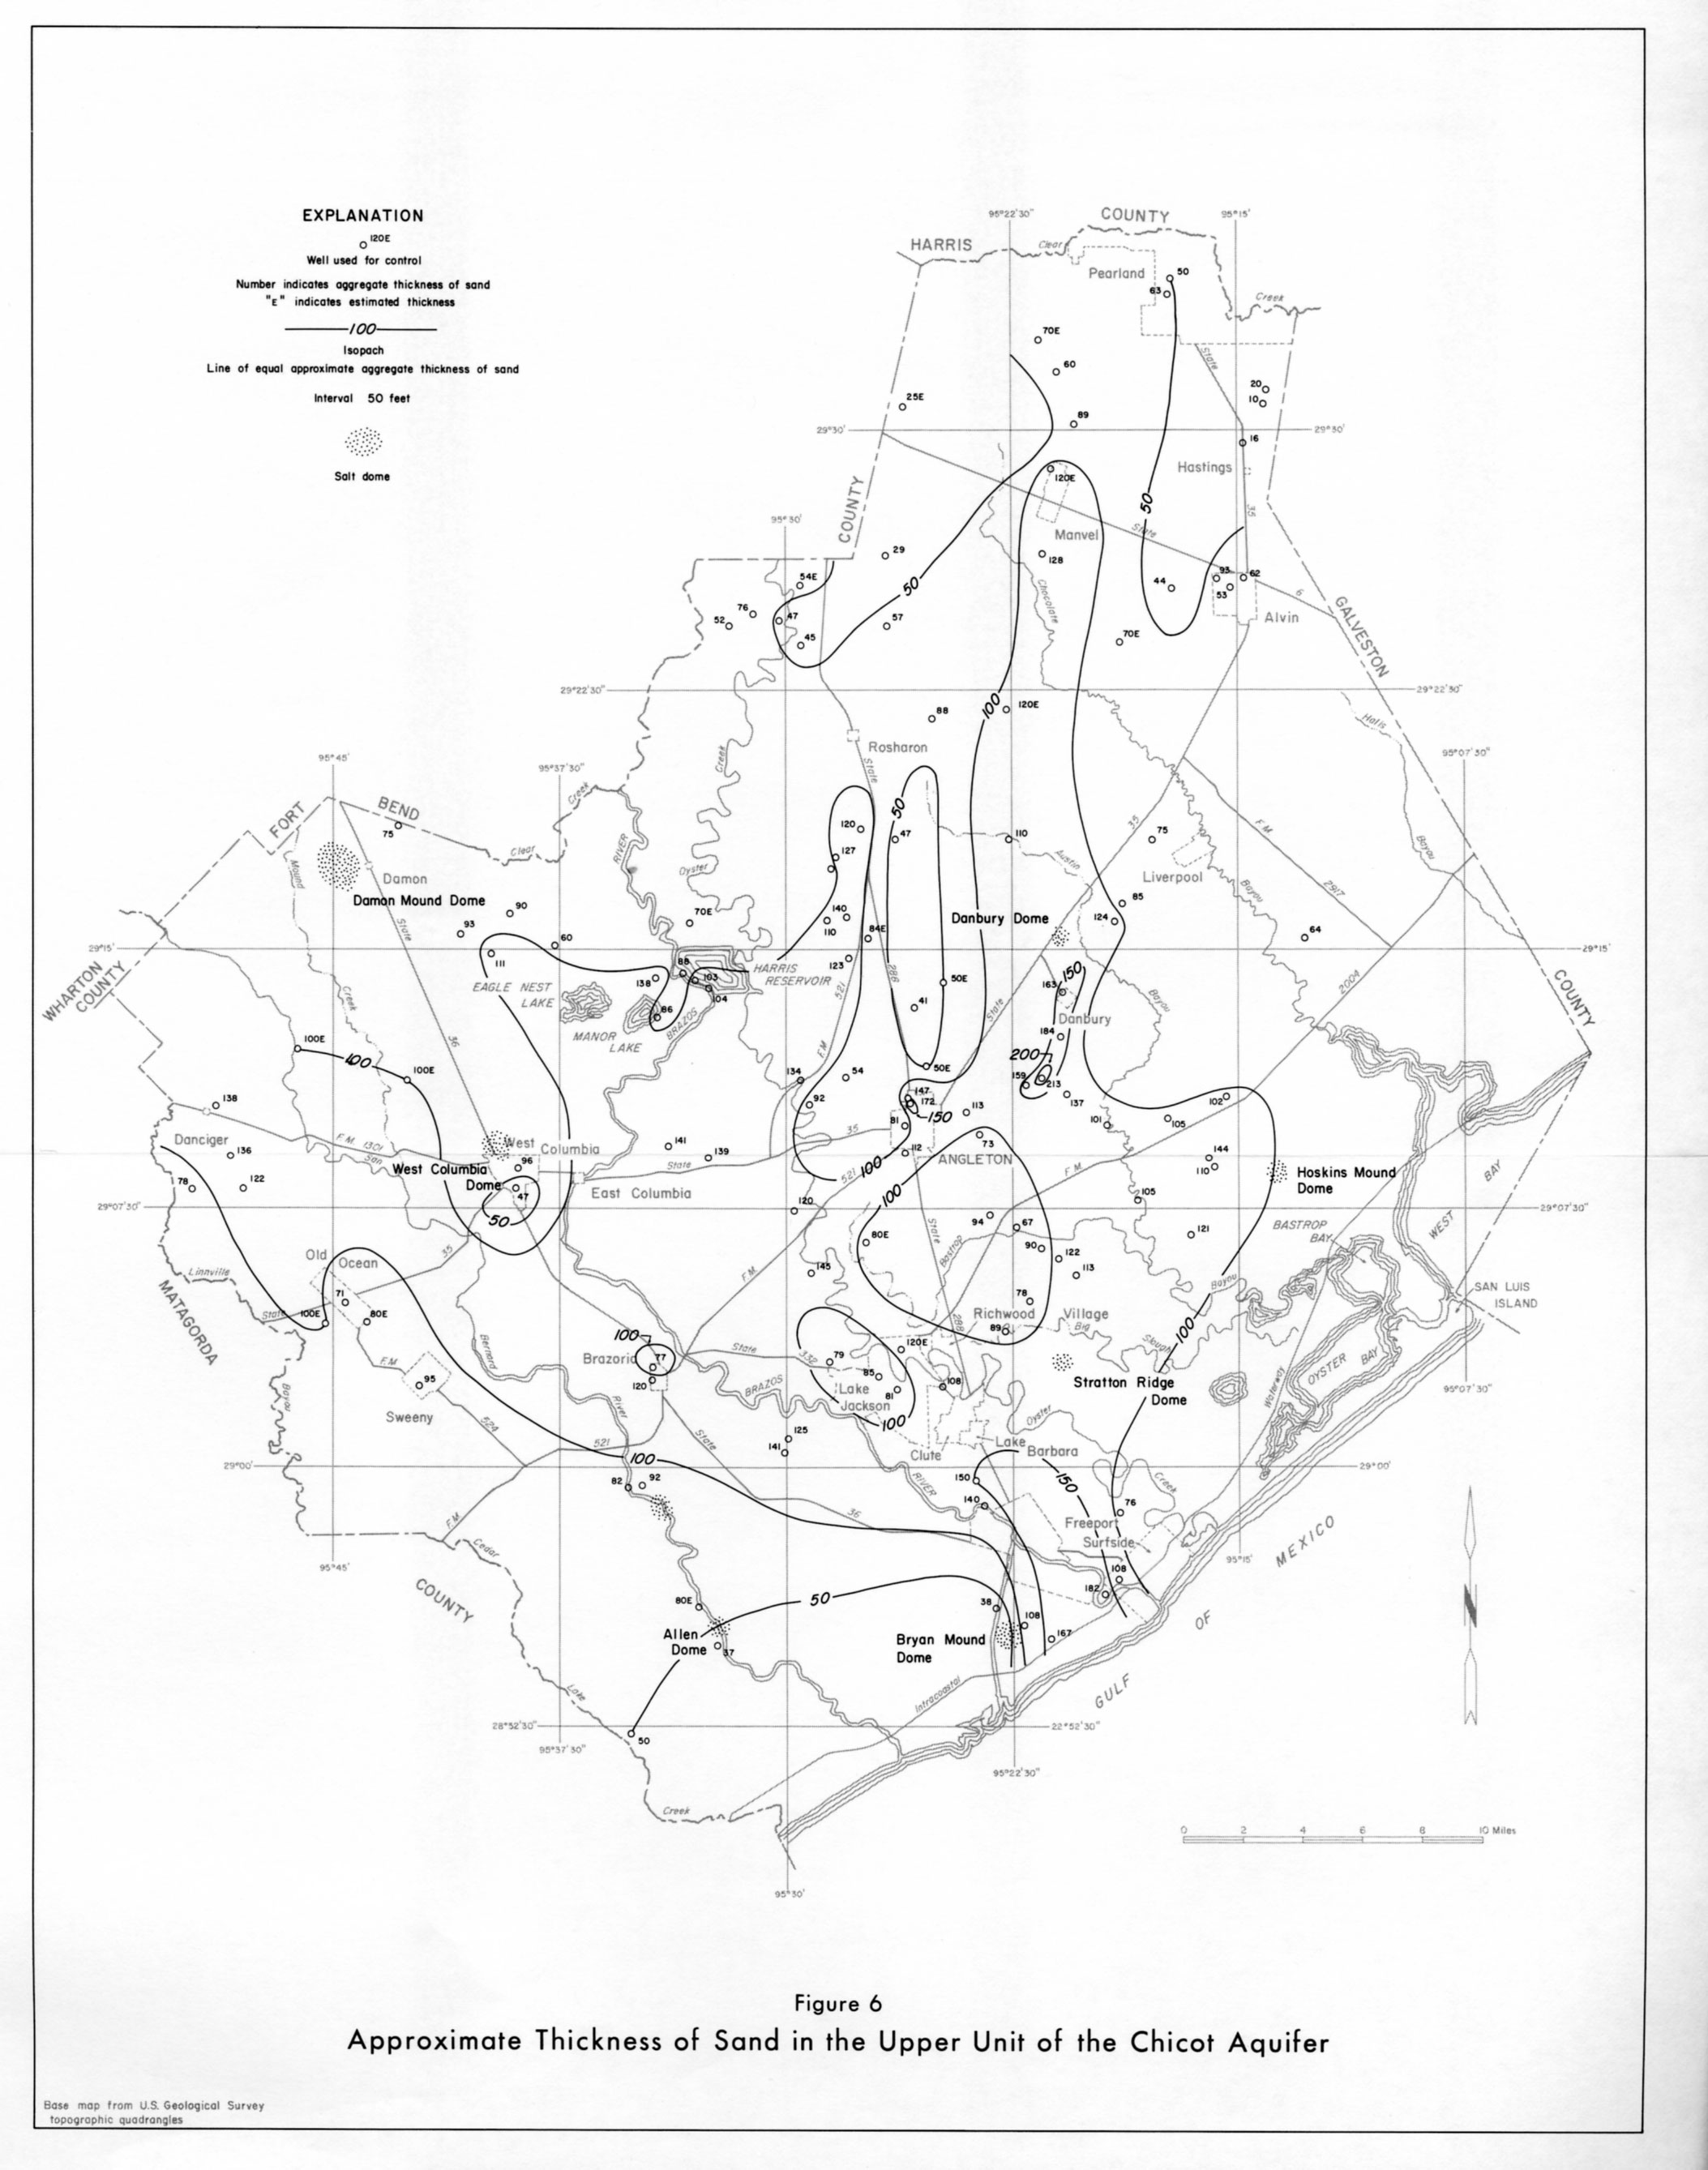
- Figure 6: Approximate Thickness of Sand in the Upper Unit of the Chicot Aquifer
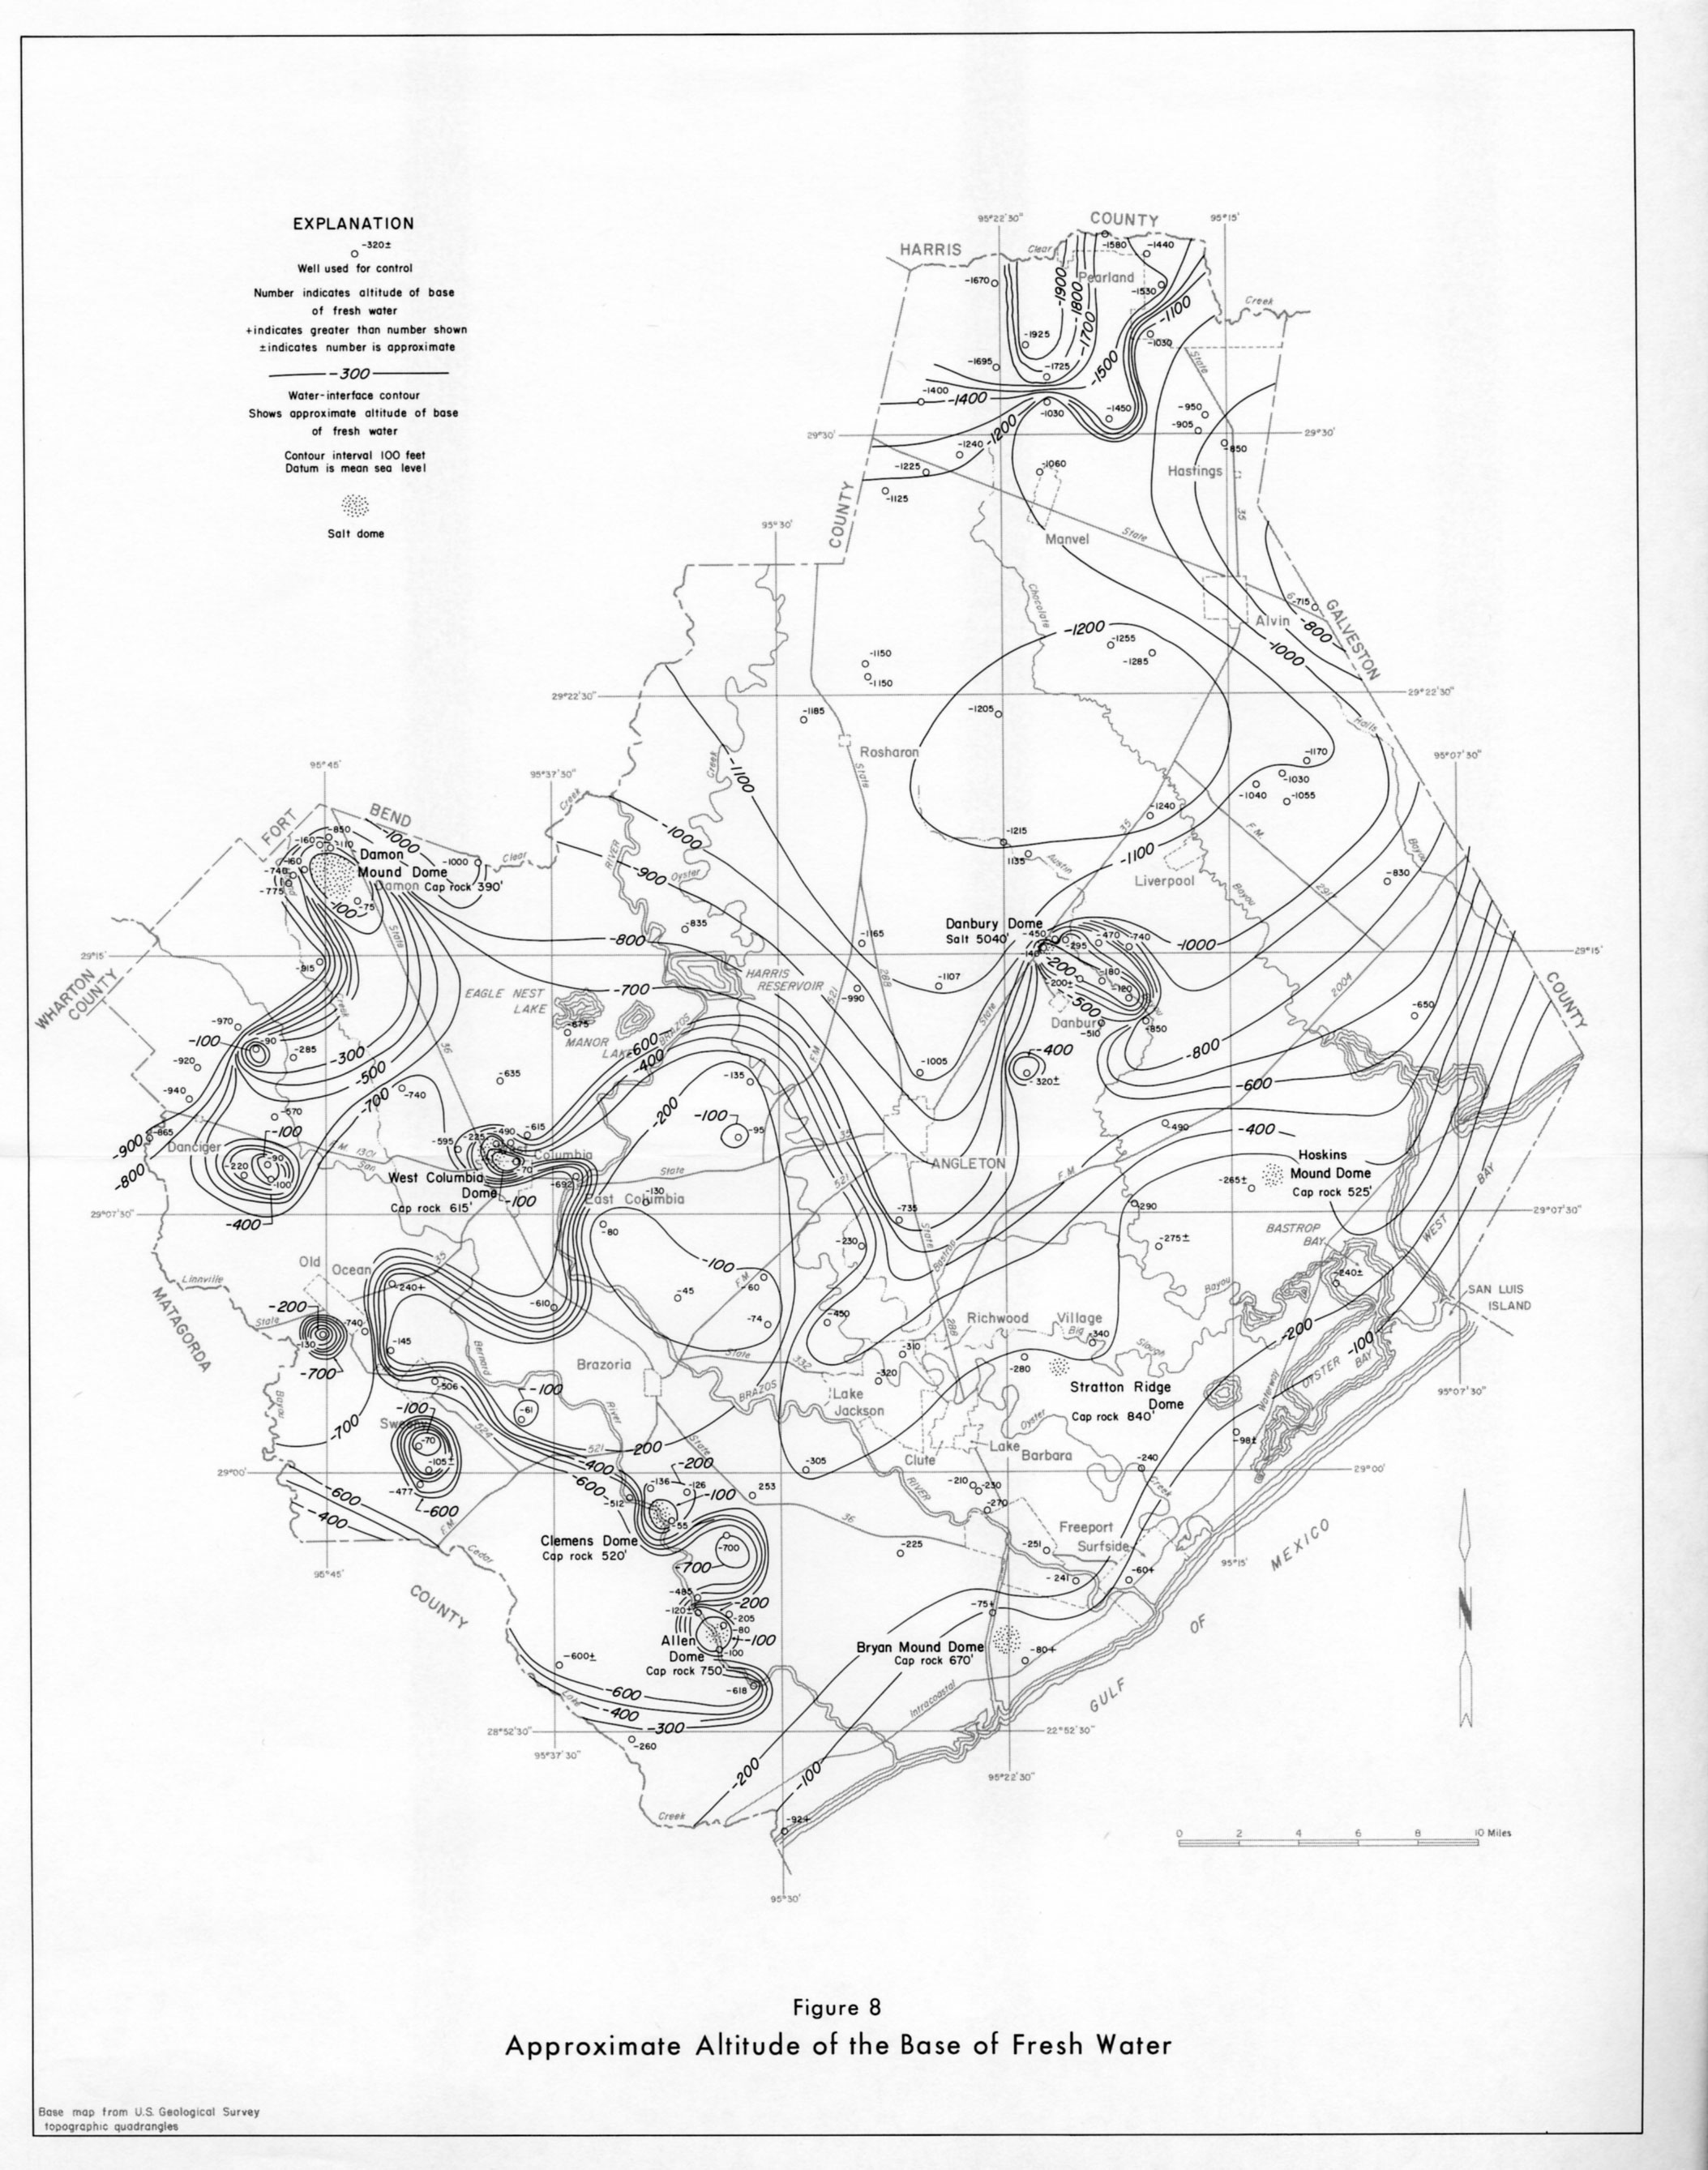
- Figure 8: Approximate Altitude of the Base of Fresh Water
- Figure 9: Approximate Altitude of the Base of Slightly Saline Water
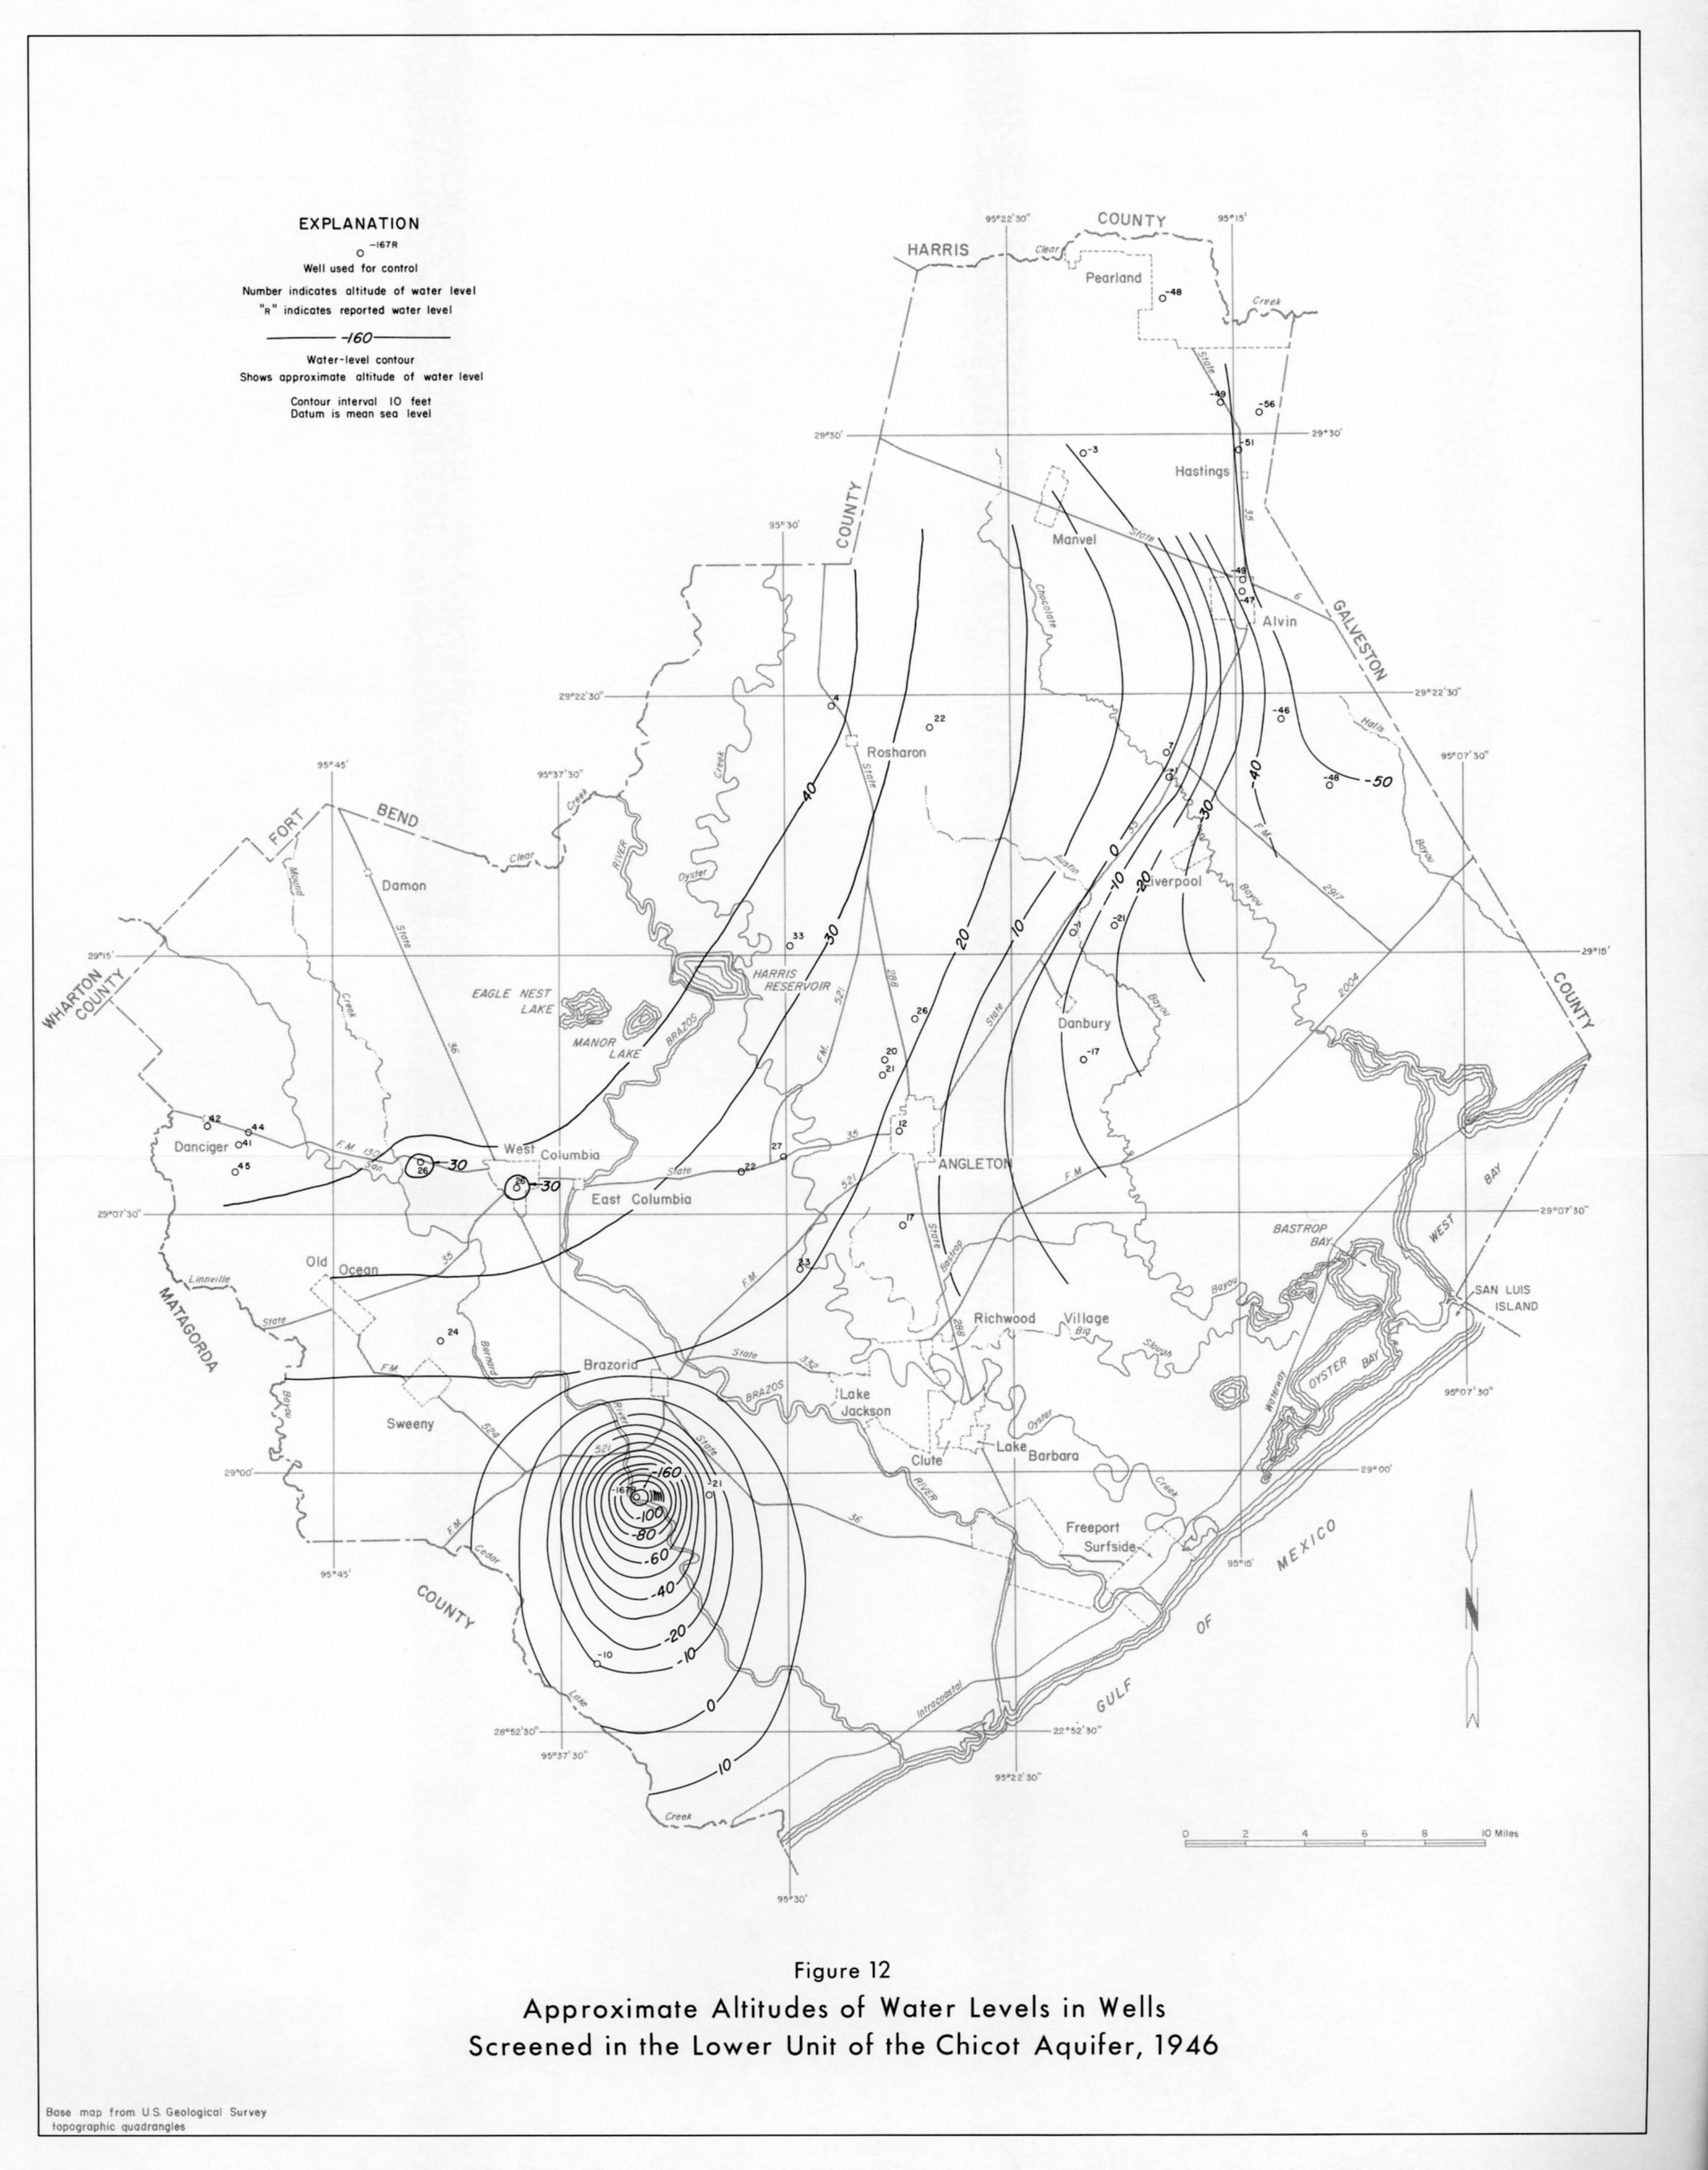
- Figure 12: Approximate Altitudes of Water Levels in Wells Screened in the Lower Unit of the Chicot Aquifer, 1946
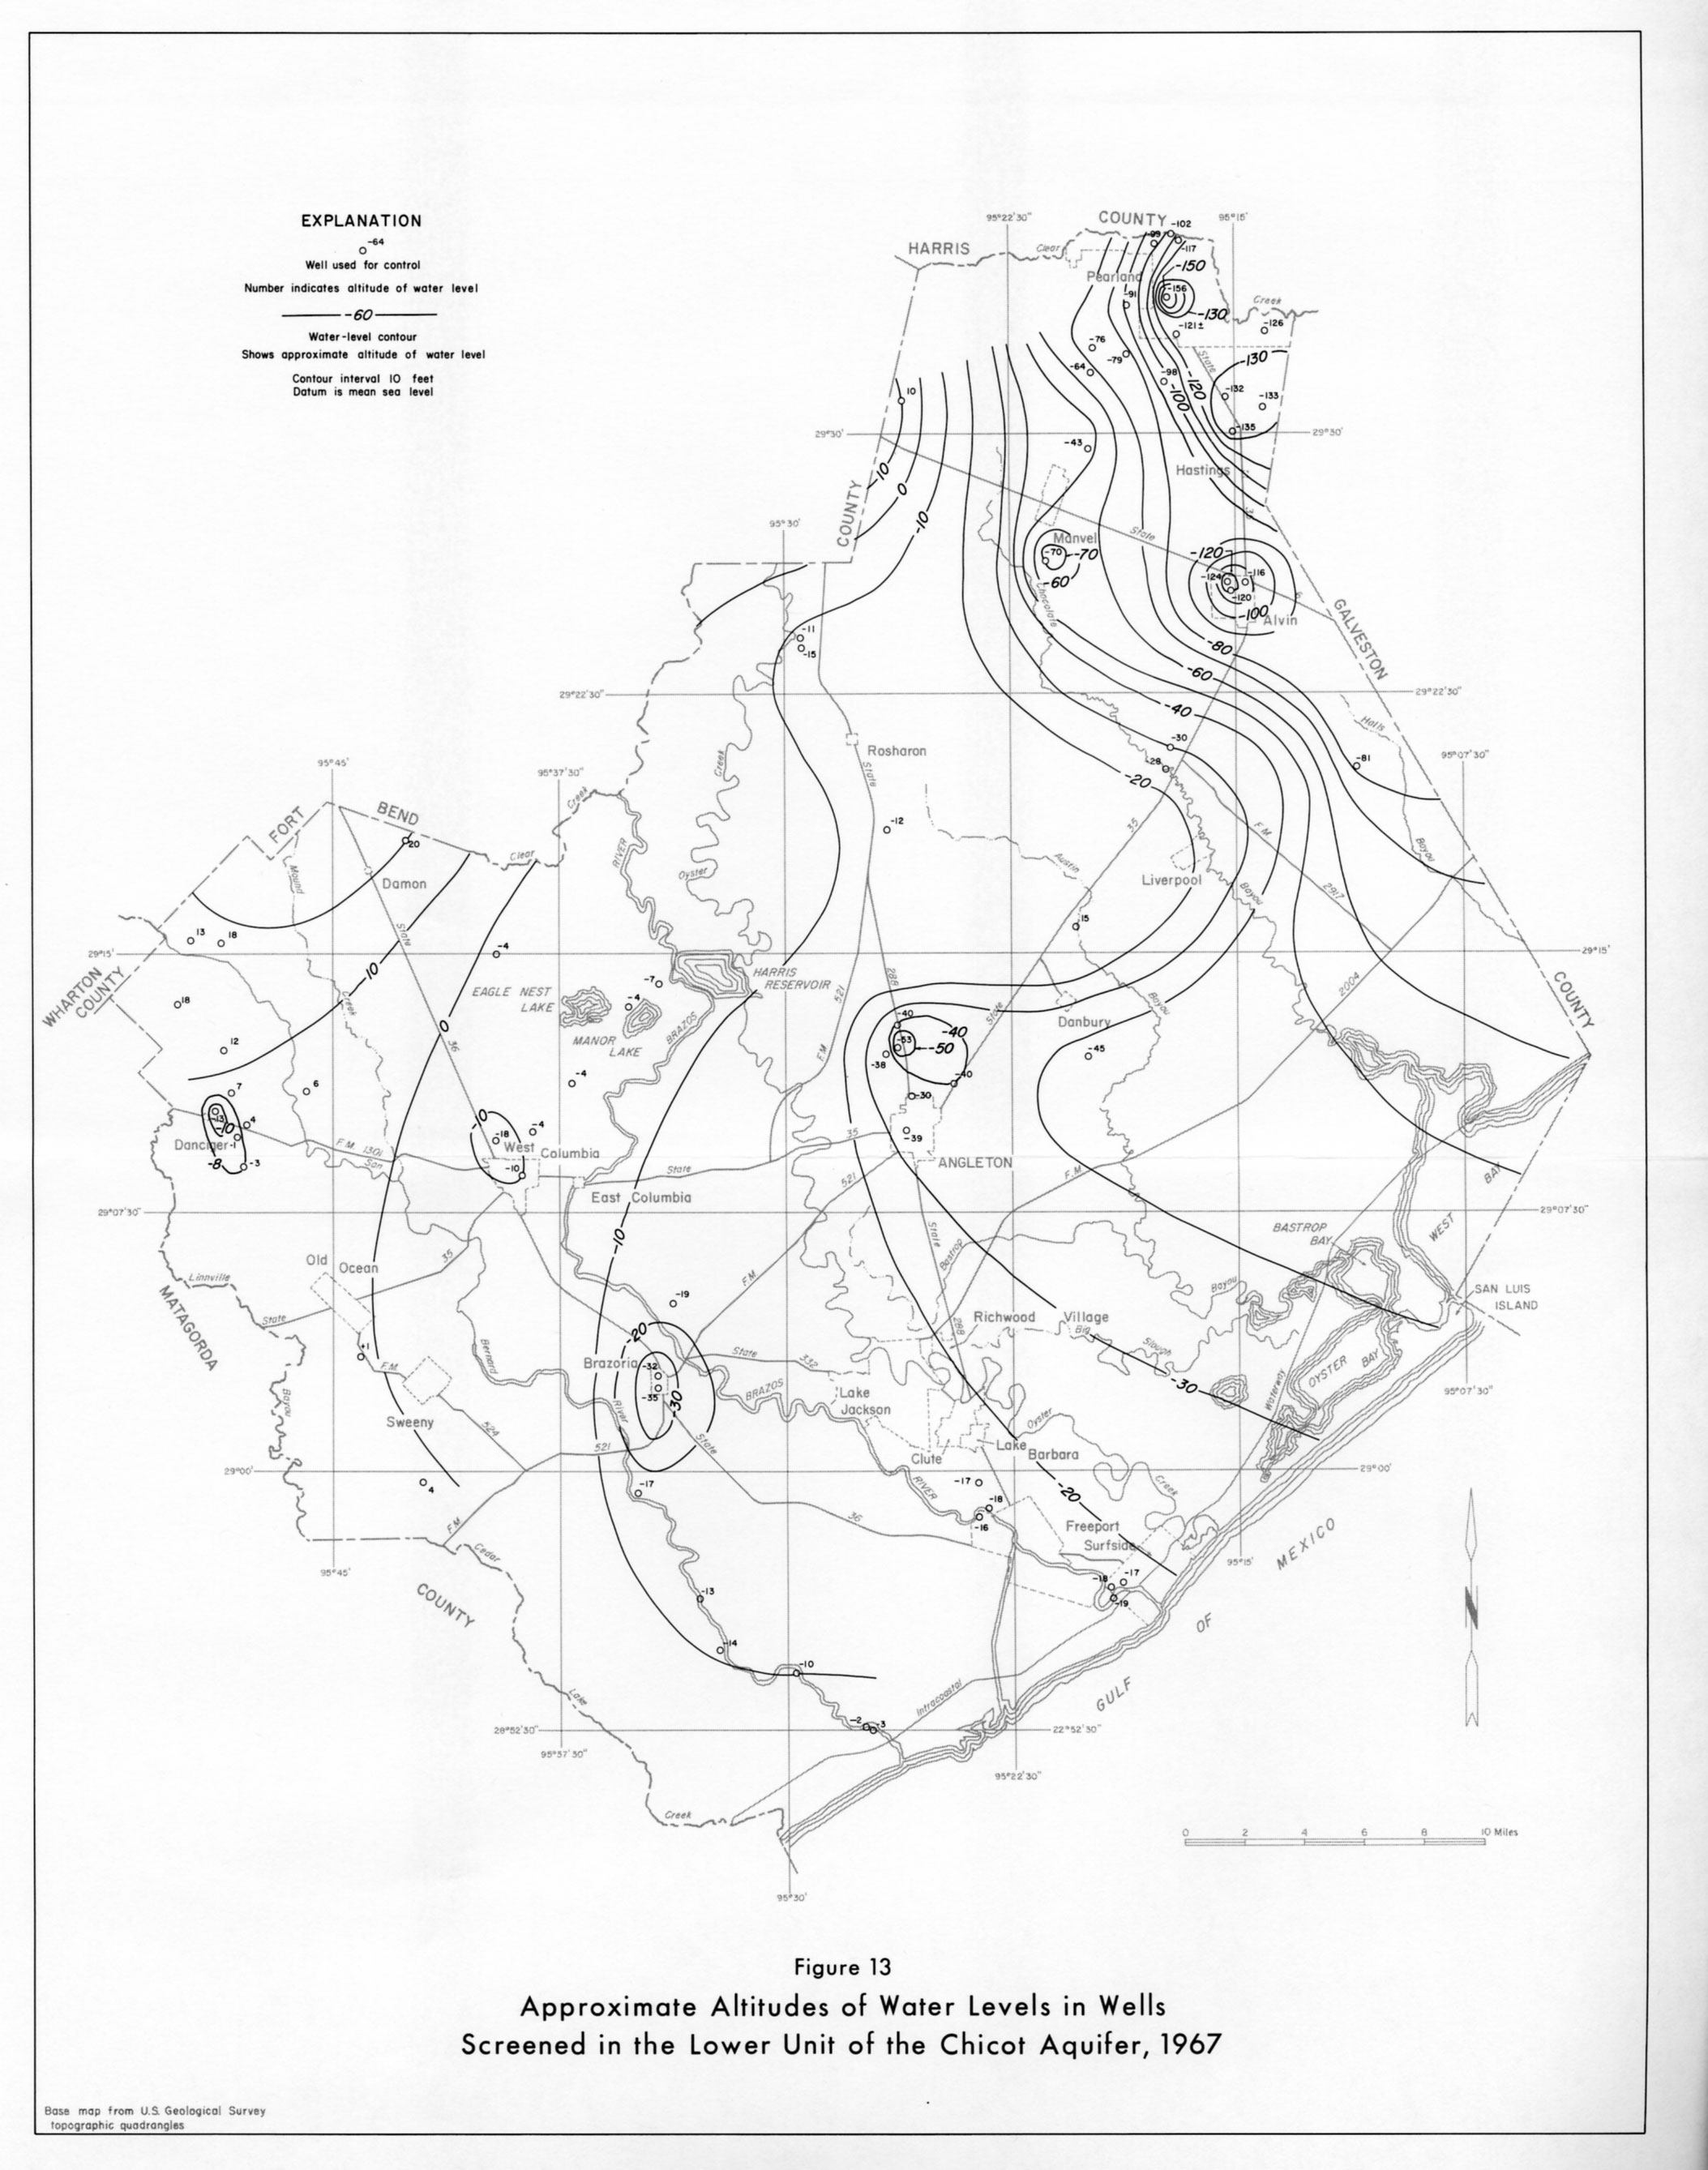
- Figure 13: Approximate Altitudes of Water Levels in Wells Screened in the Lower Unit of the Chicot Aquifer, 1967
- Figure 14: Approximate Altitude of the Earliest Recorded Water Levels in Wells Screened in the Upper Unit of the Chicot Aquifer in Five Local Areas
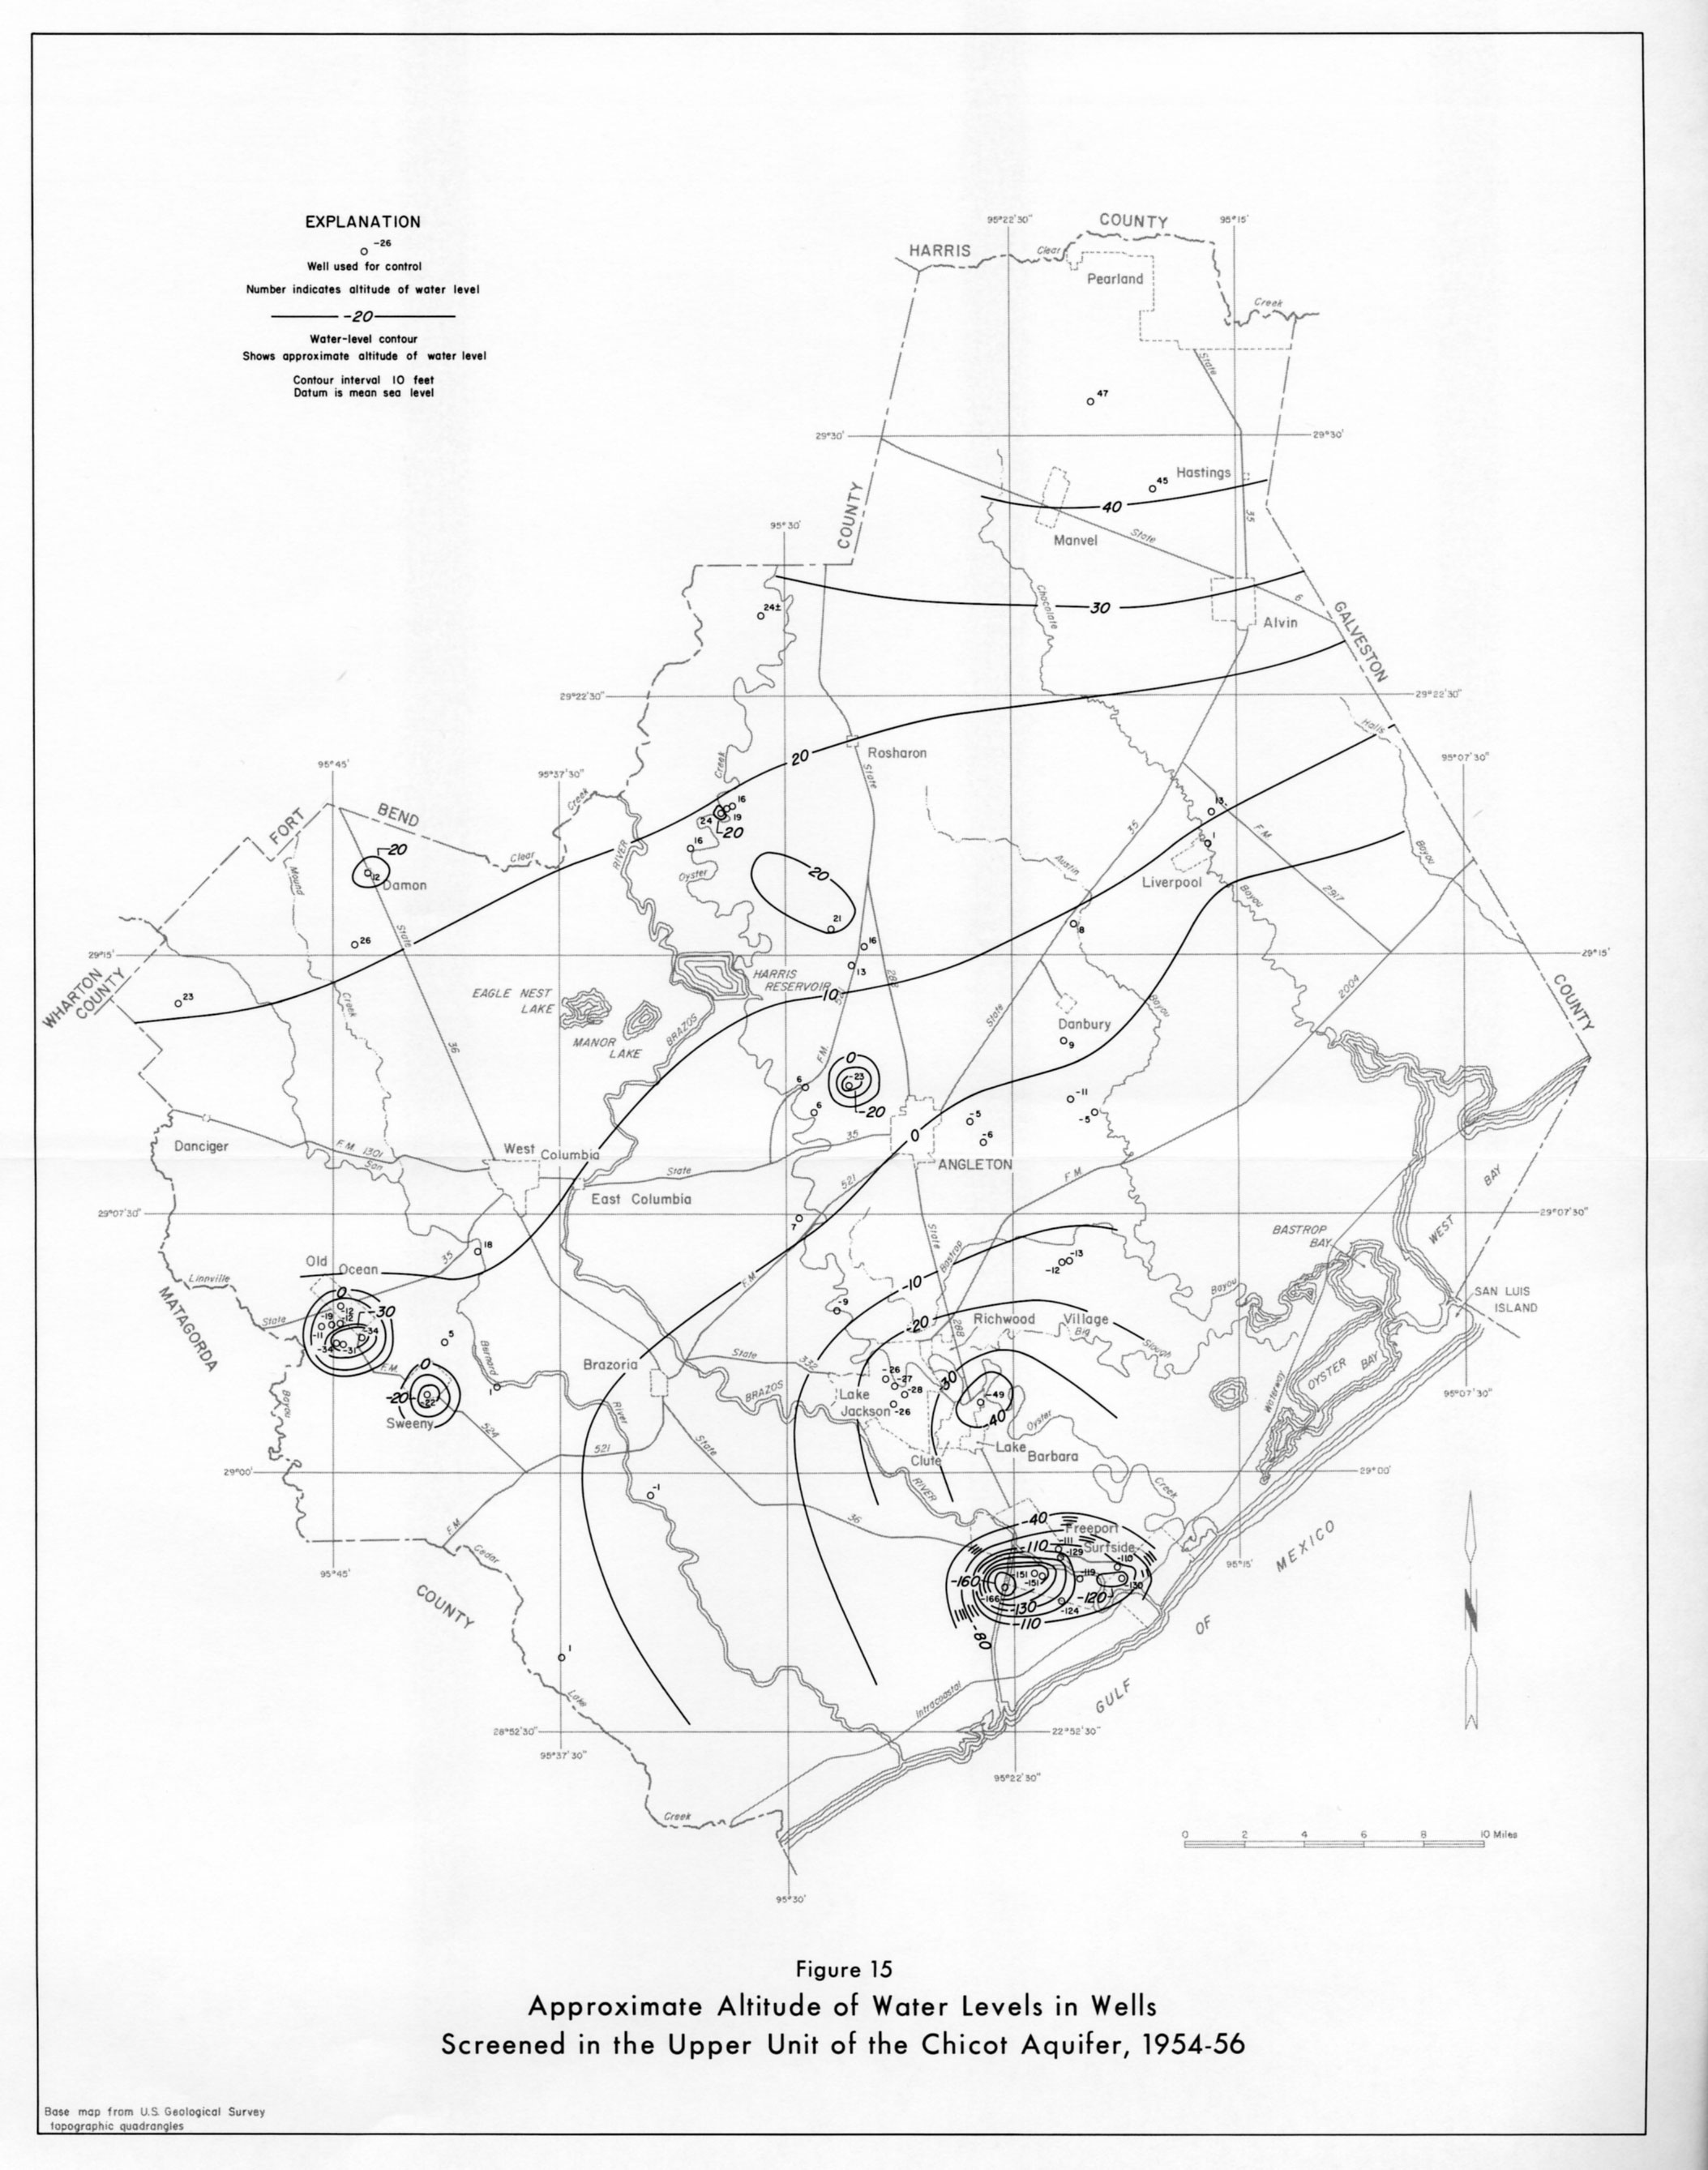
- Figure 15: Approximate Altitudes of Water Levels in Wells Screened in the Upper Unit of the Chicot Aquifer, 1954-56
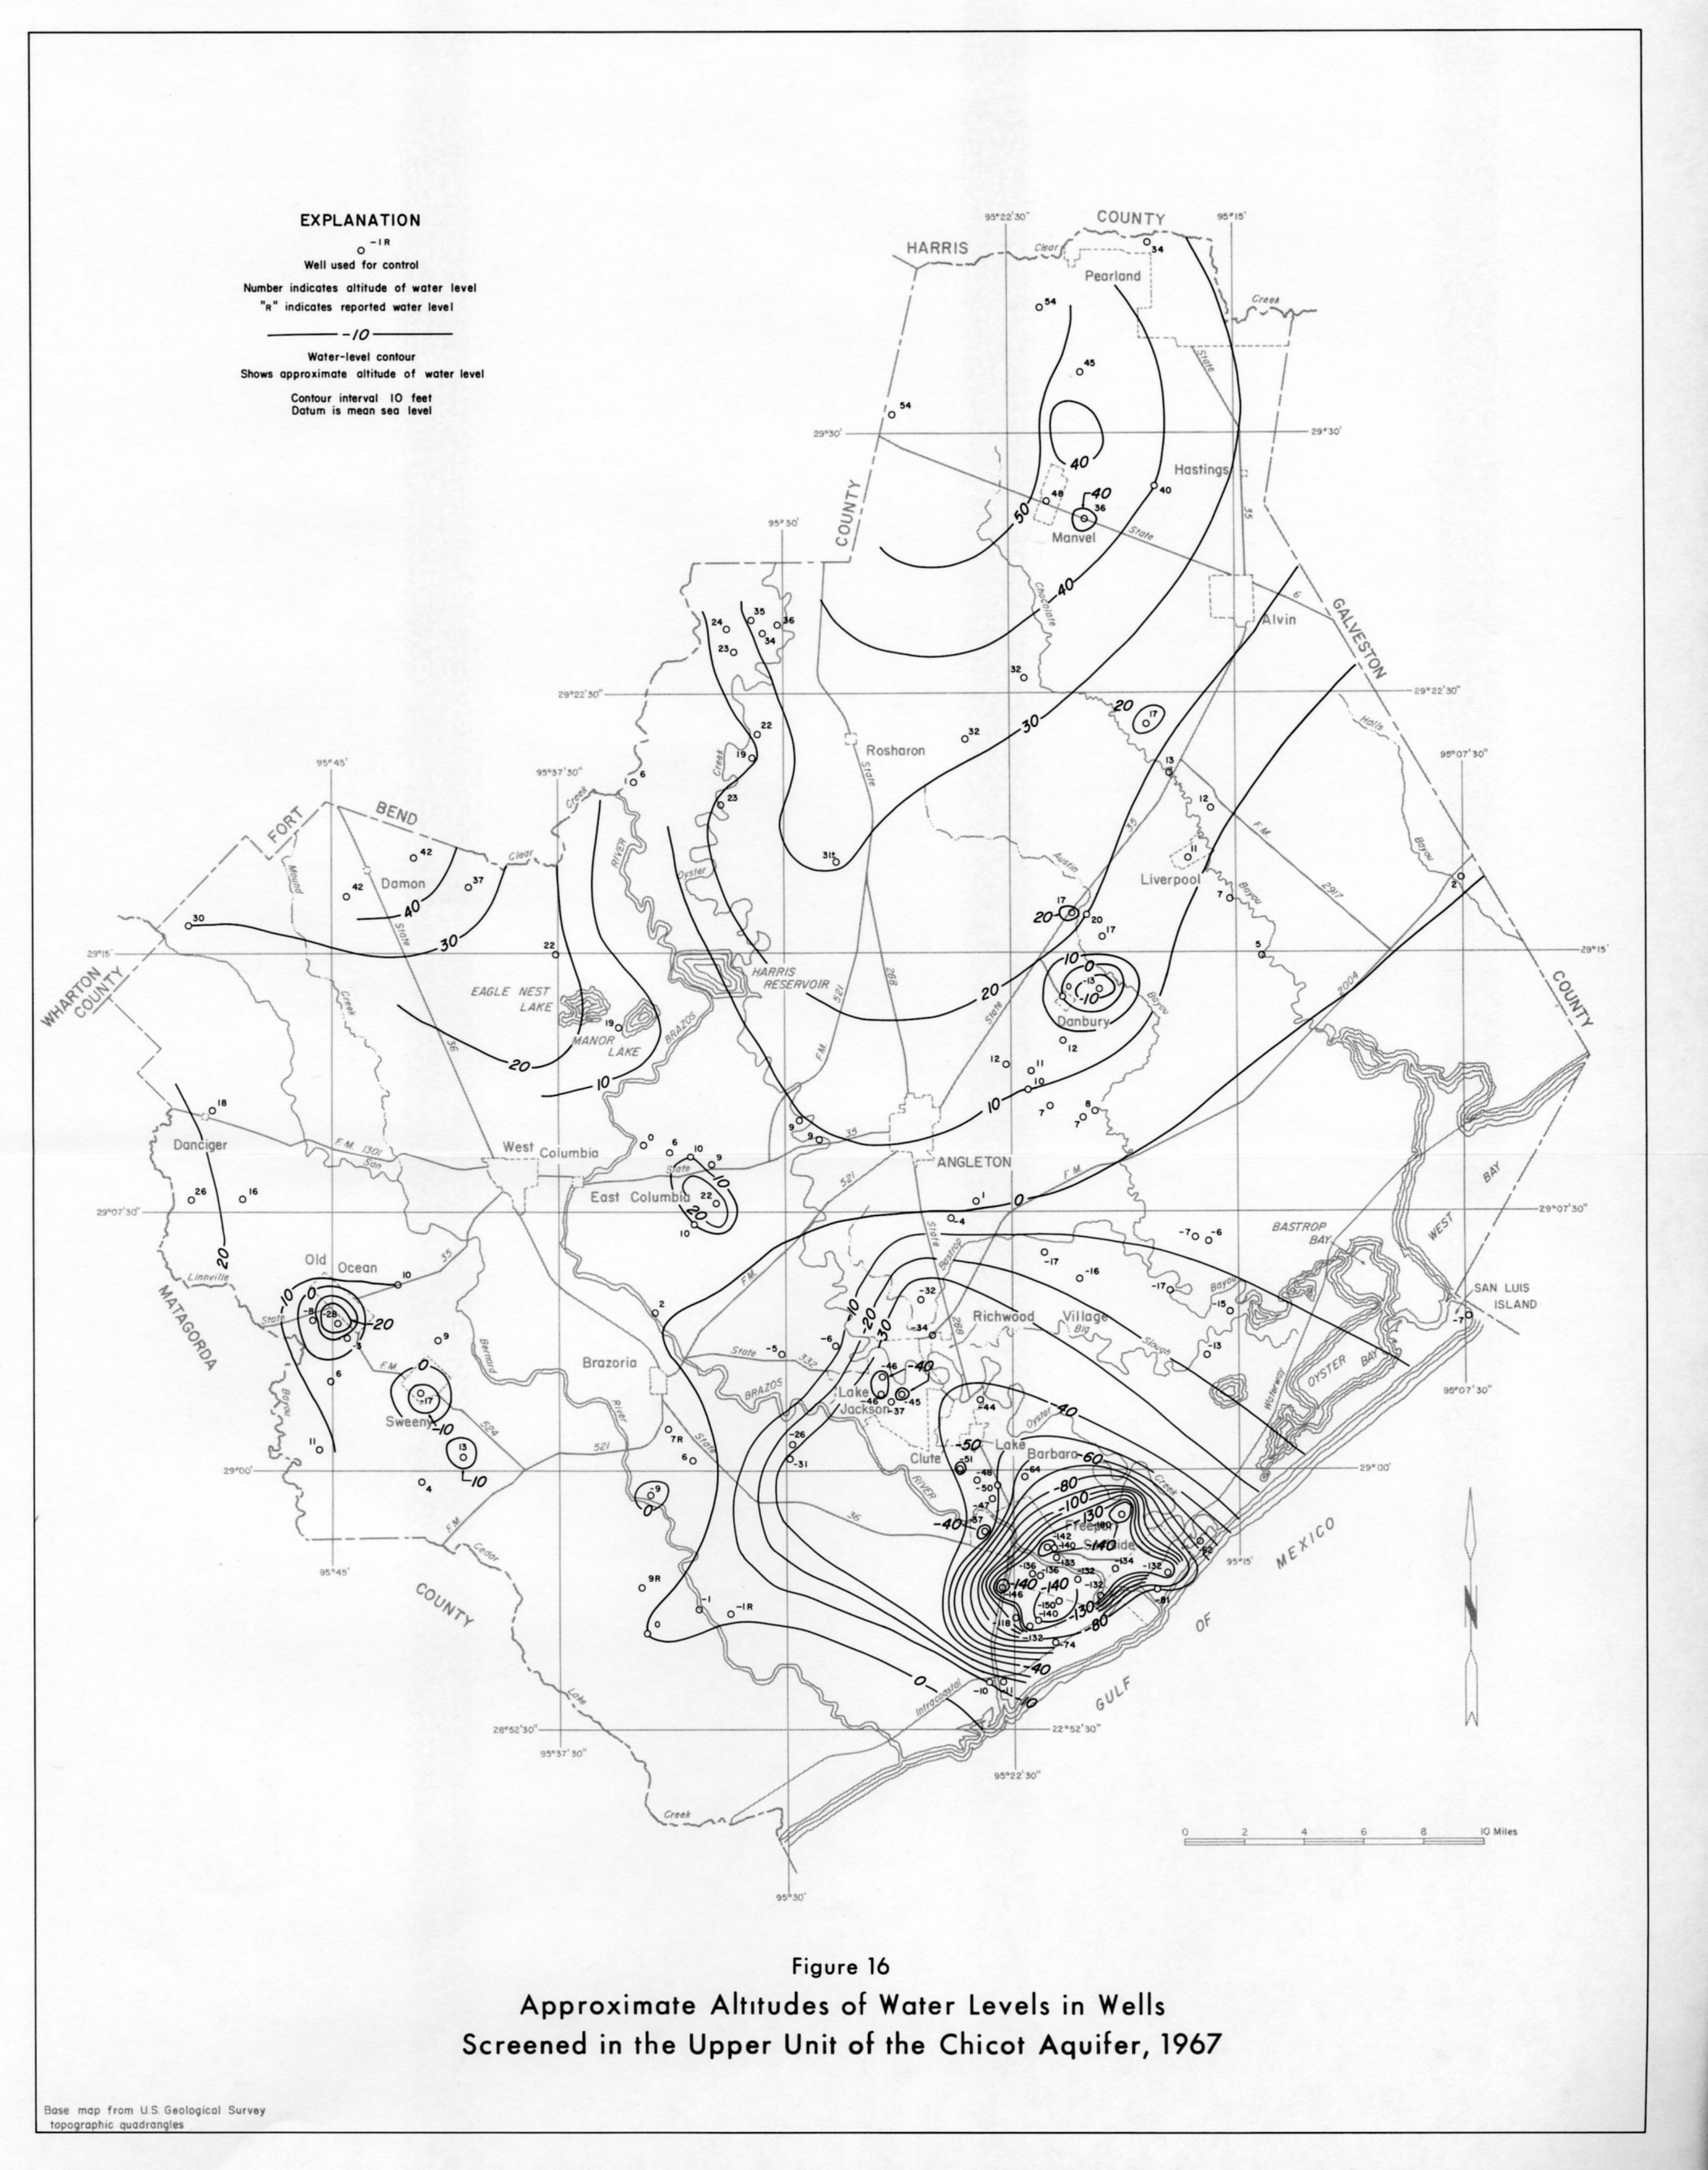
- Figure 16: Approximate Altitudes of Water Levels in Wells Screened in the Upper Unit of the Chicot Aquifer, 1967
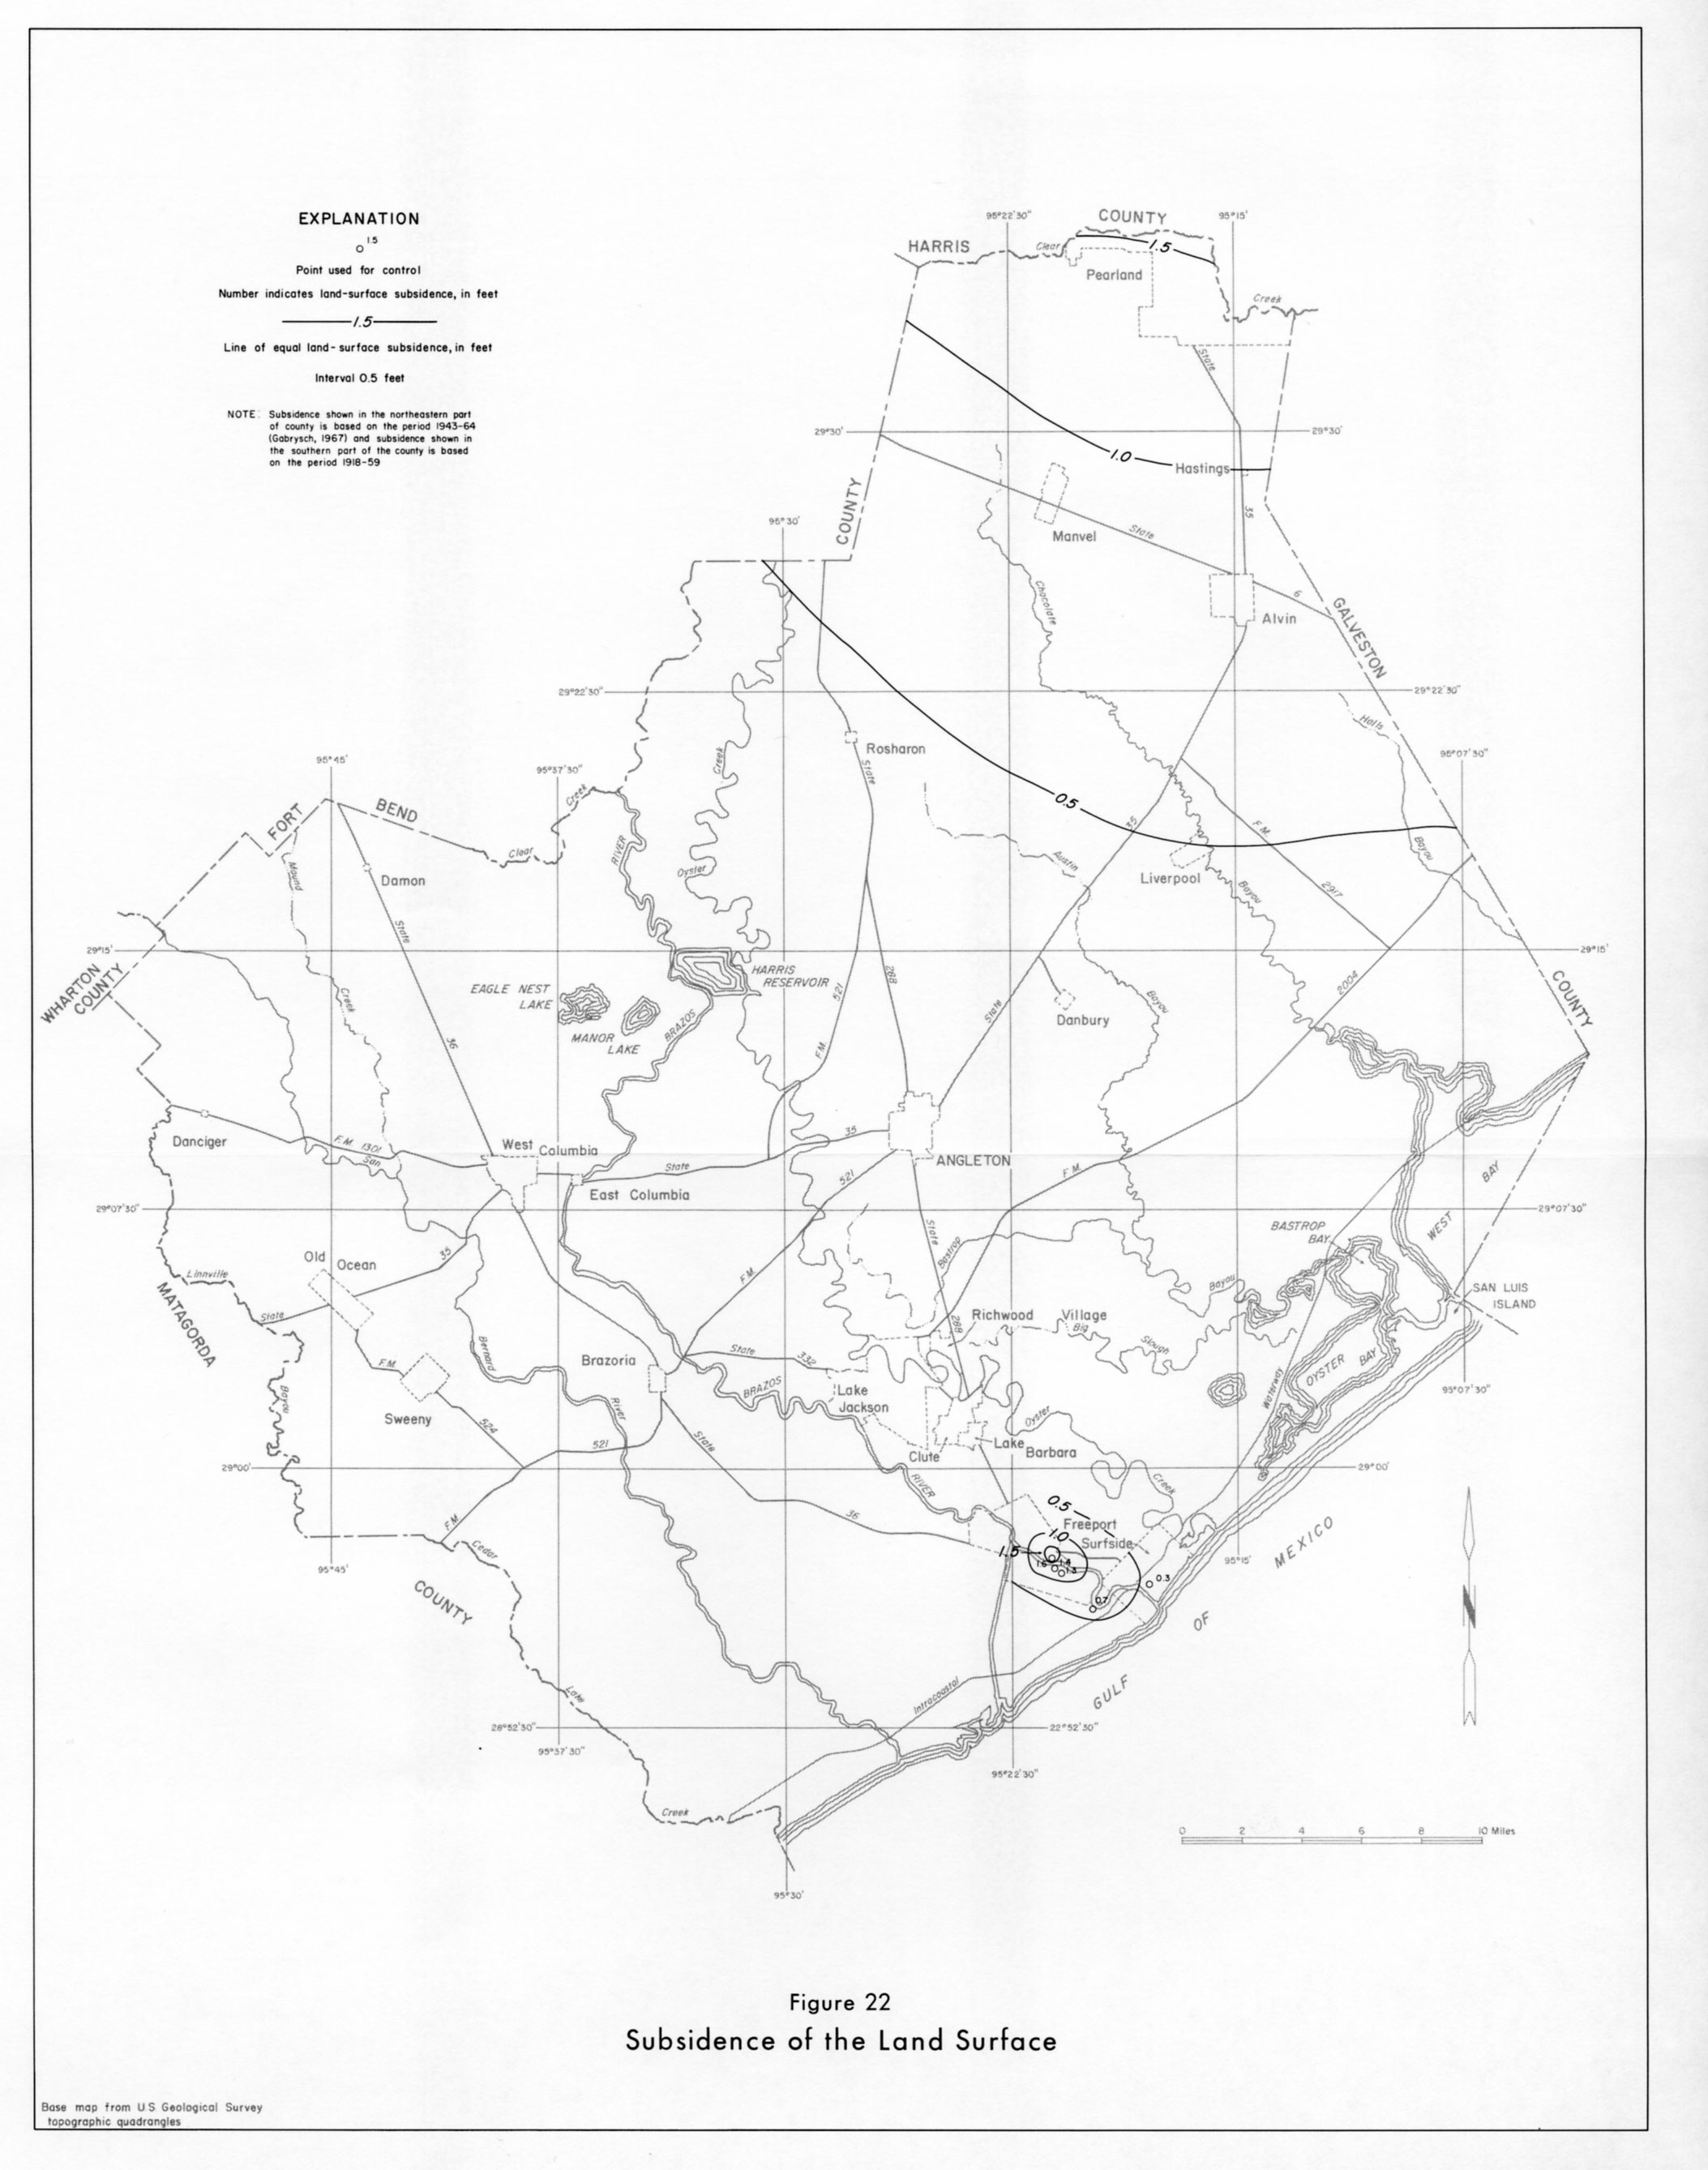
- Figure 22: Subsidence of the Land Surface
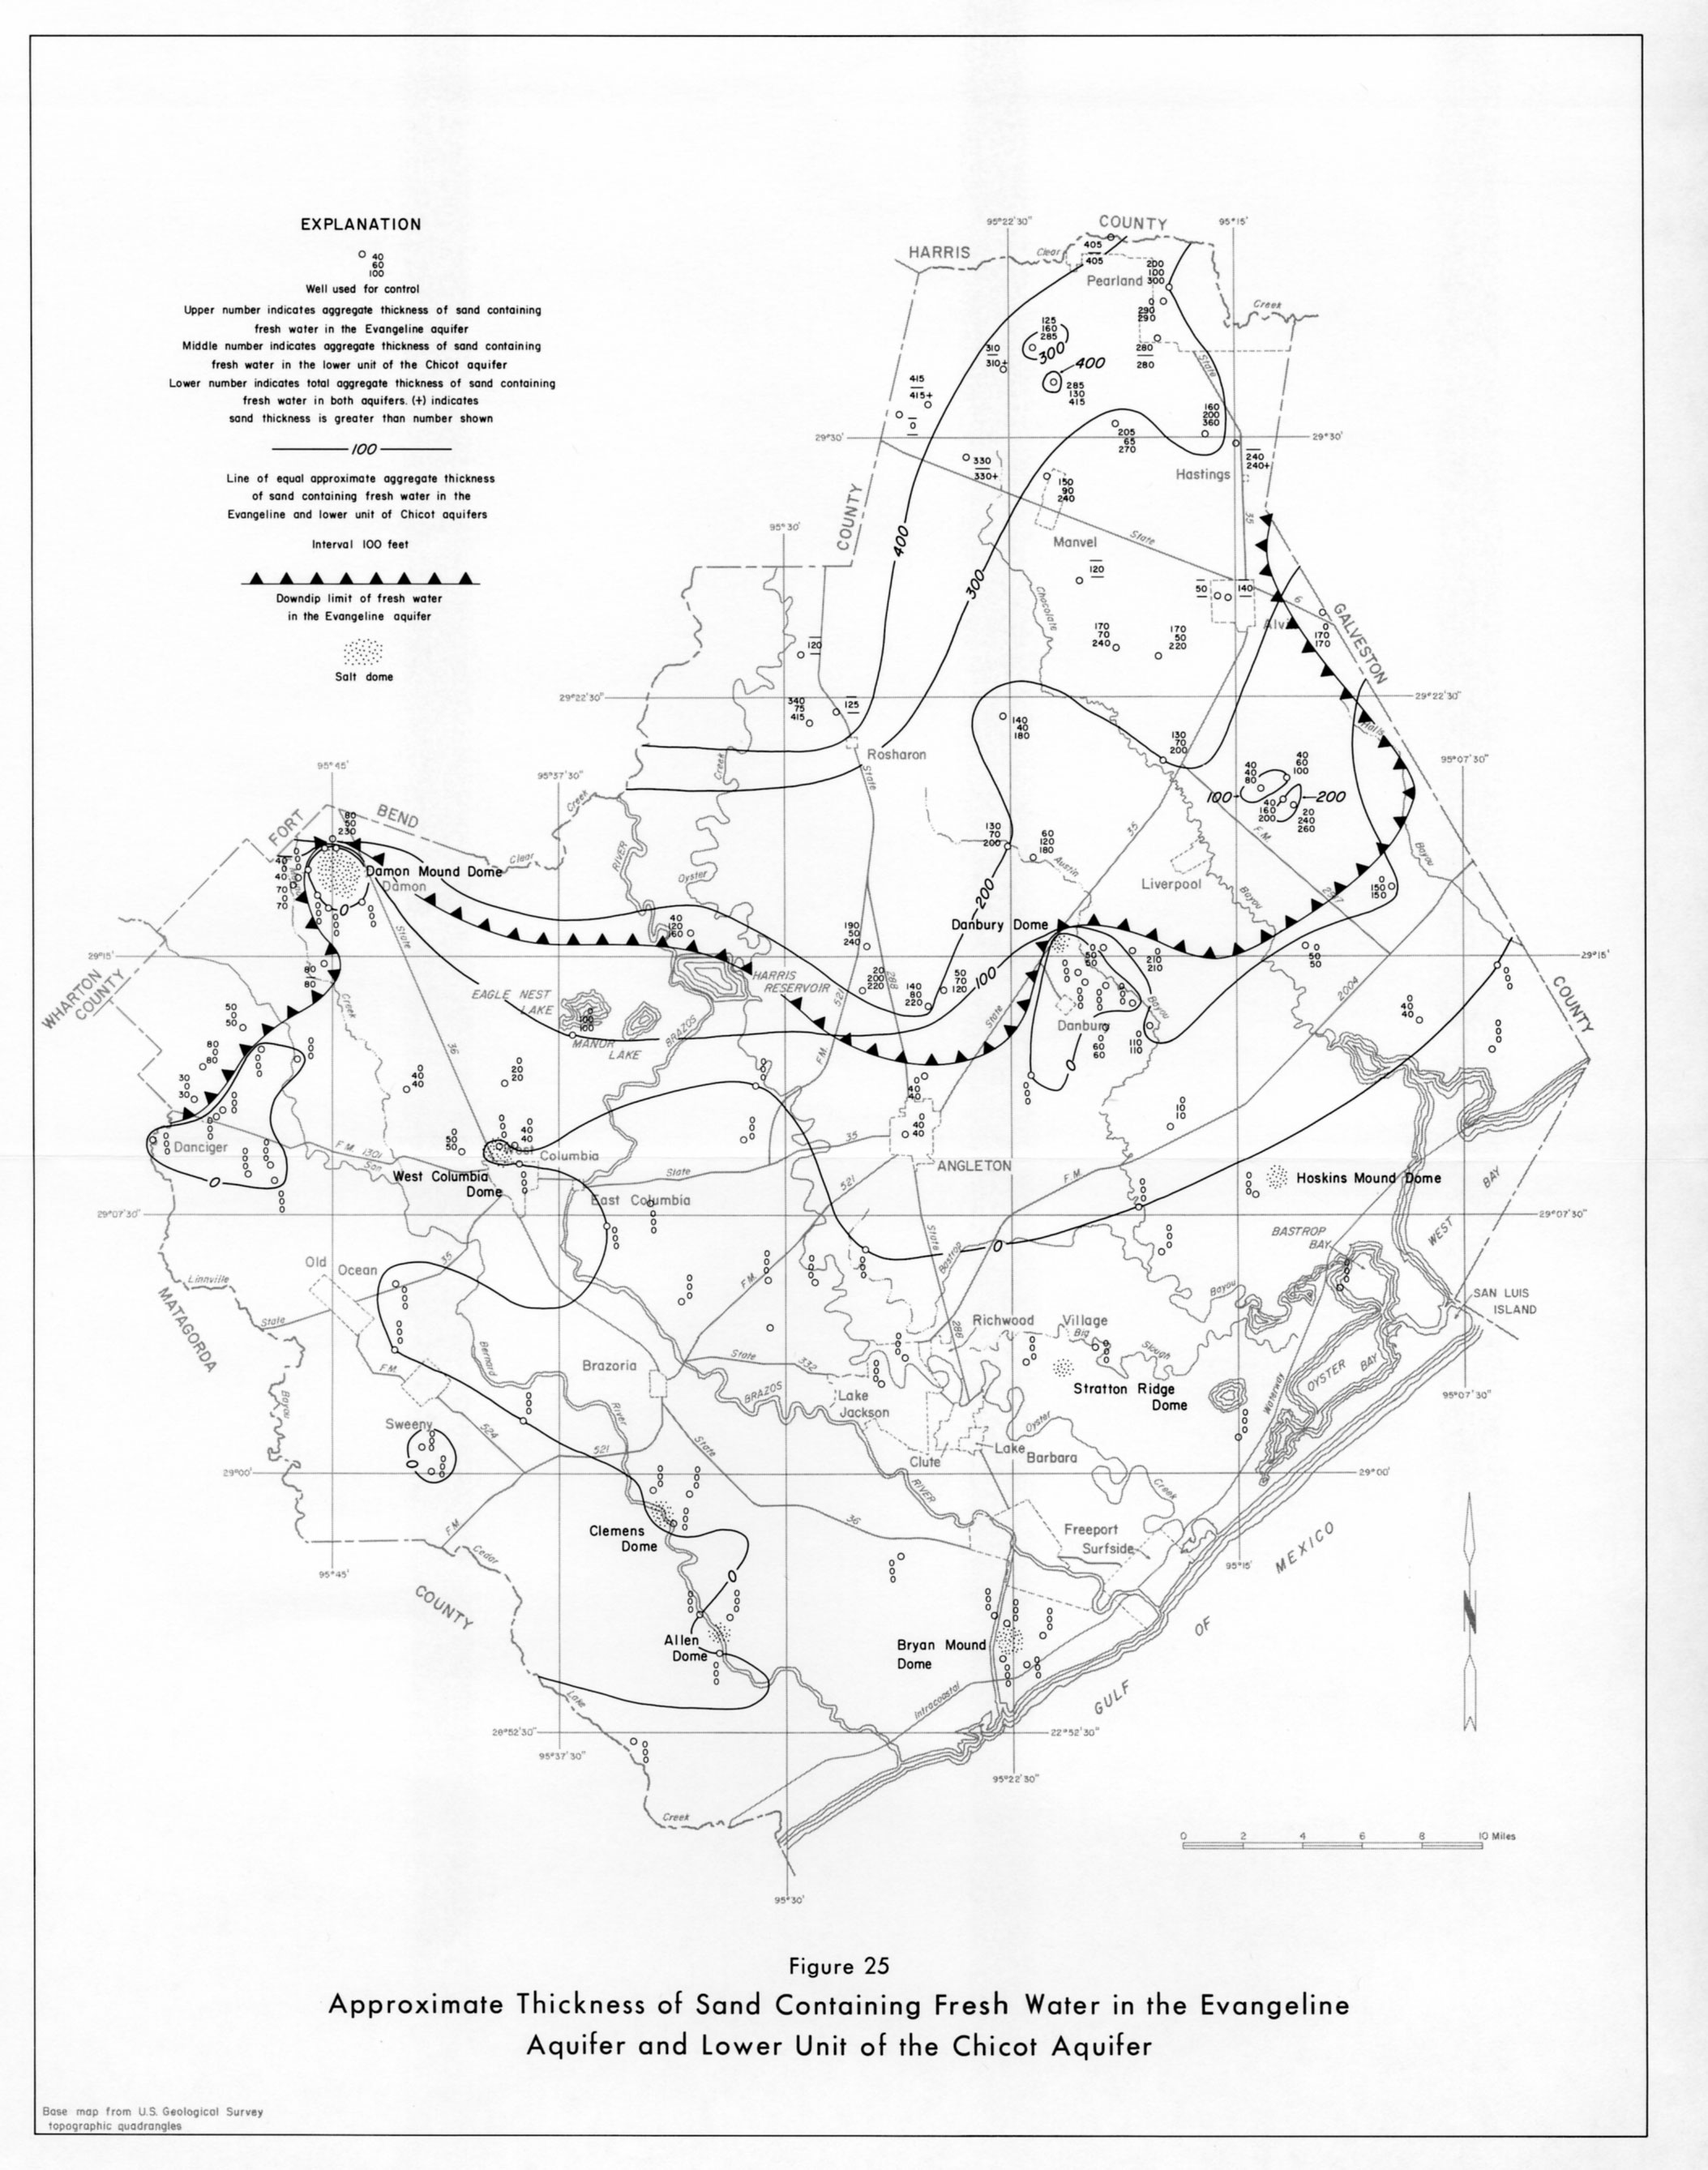
- Figure 25: Approximate Thickness of Sand Containing Fresh Water in the Evangeline Aquifer and Lower Unit of the Chicot Aquifer
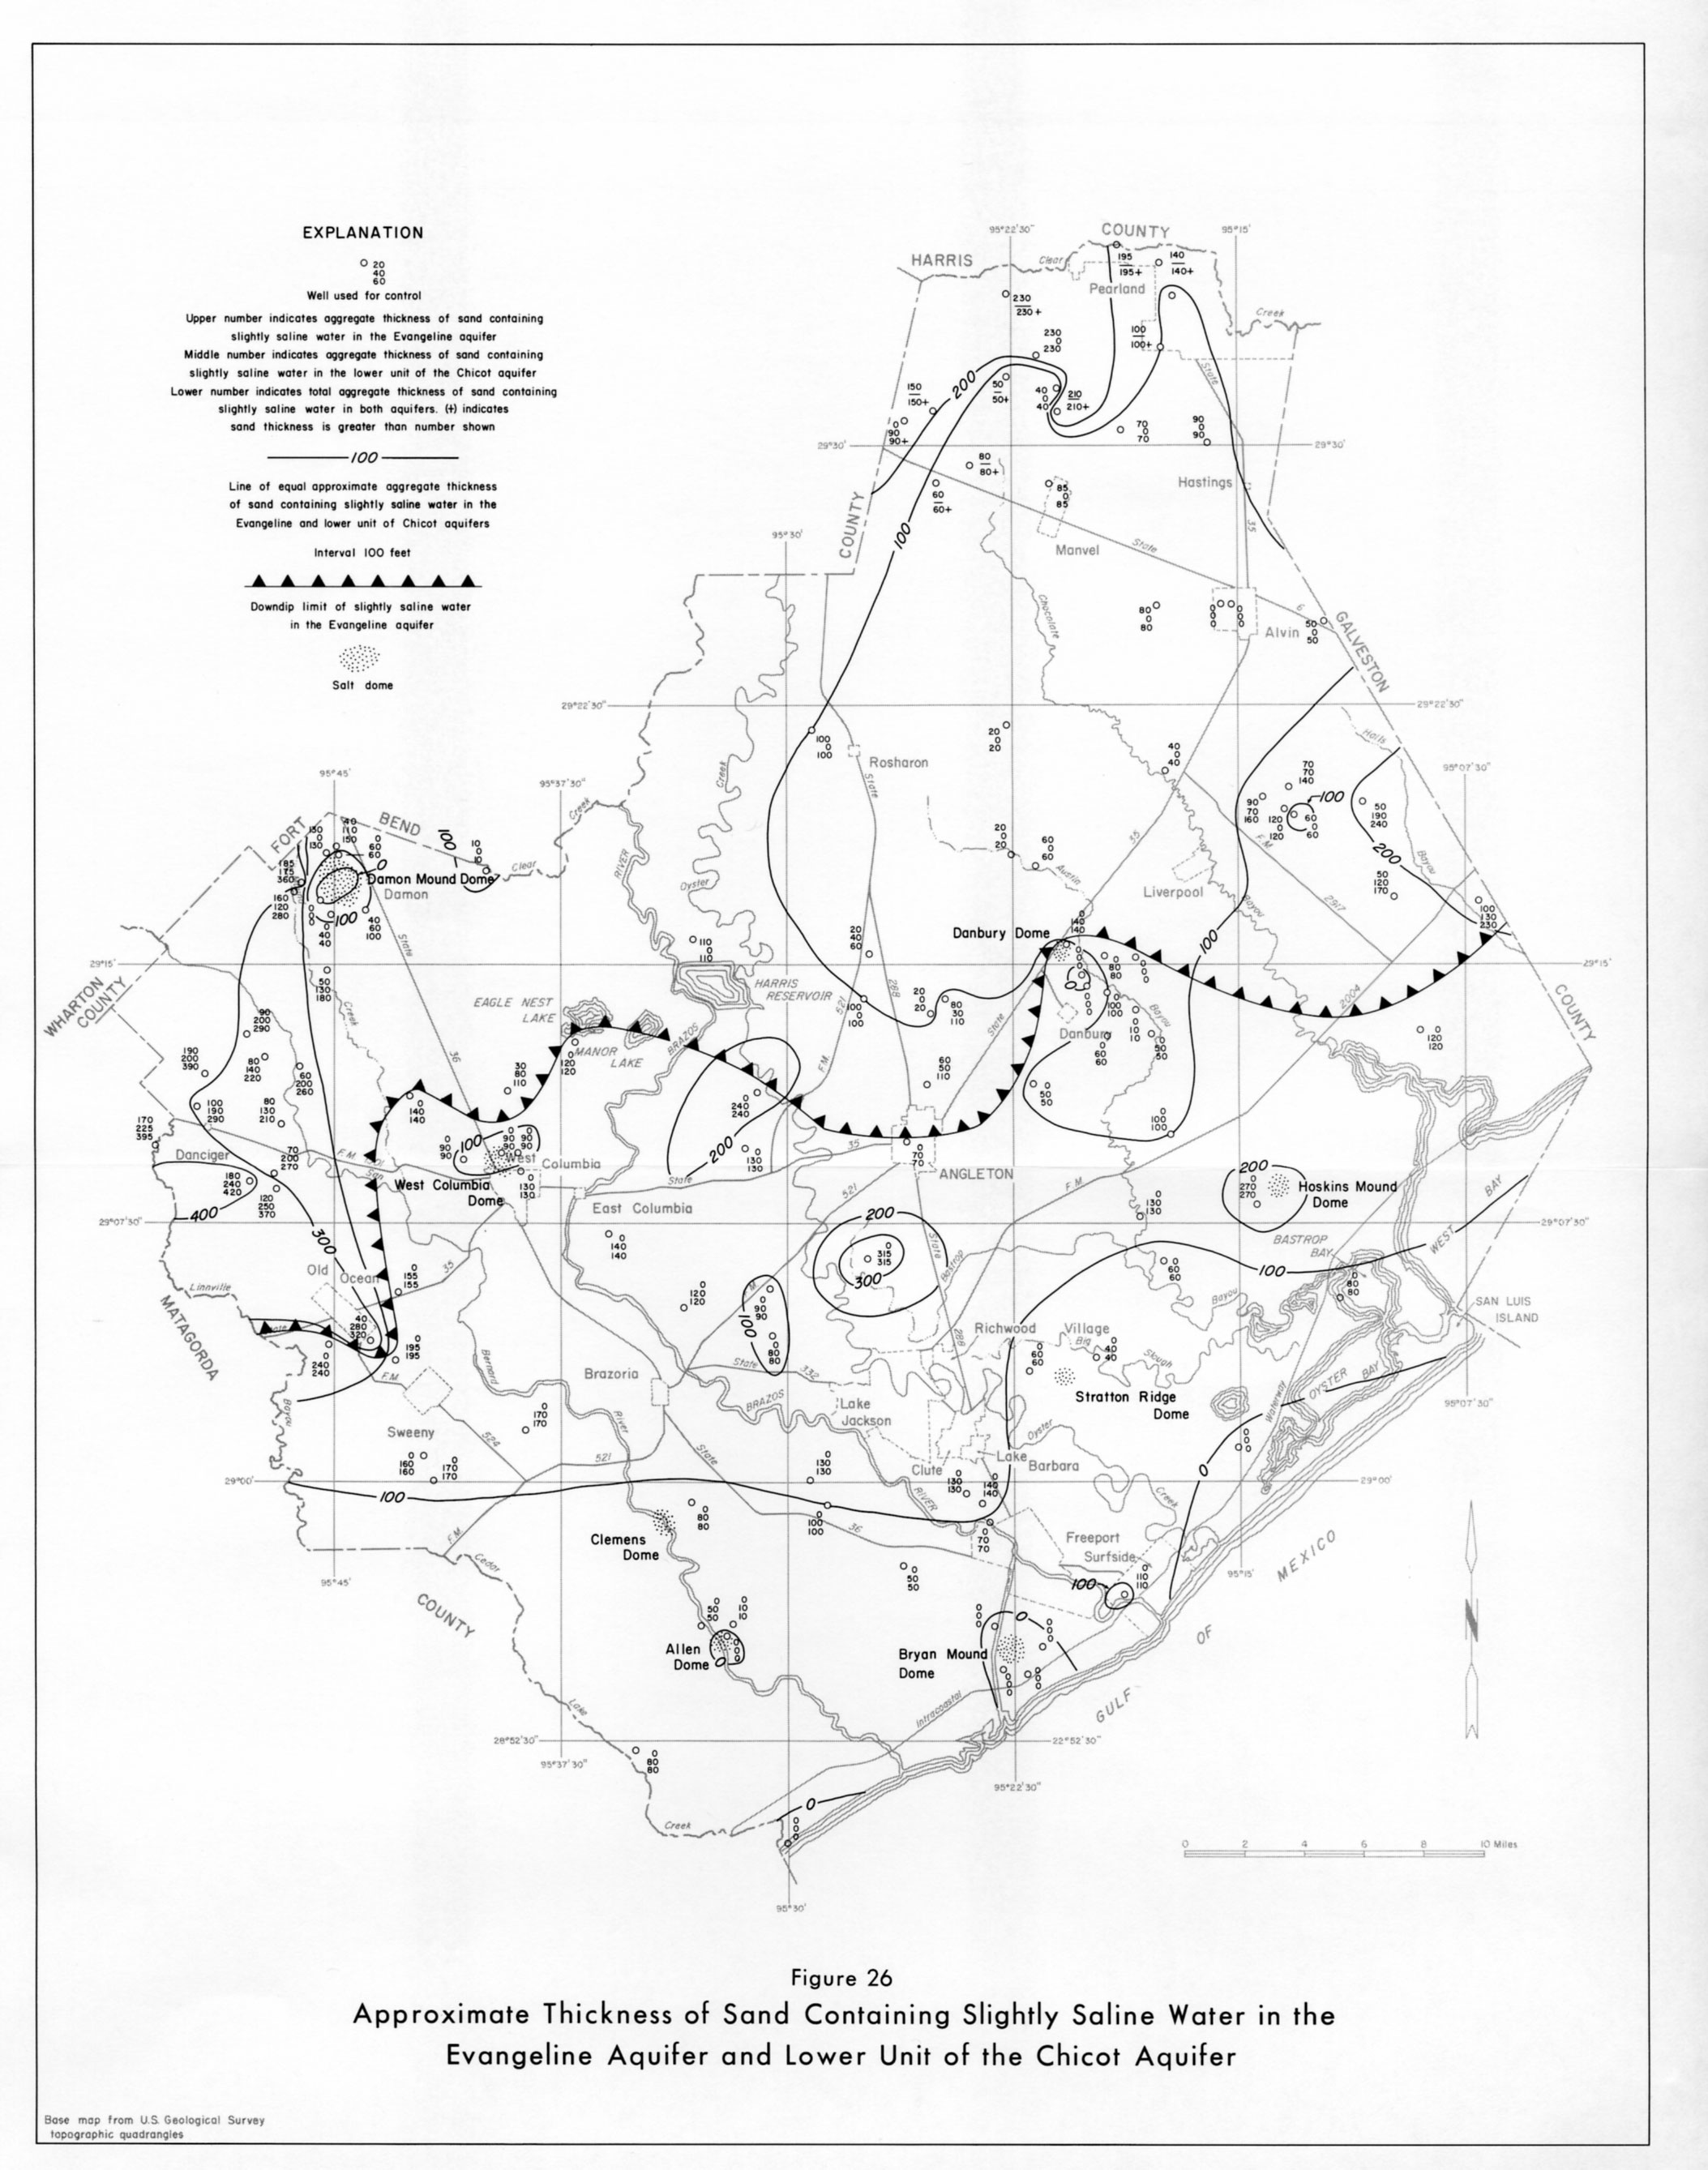
- Figure 26: Approximate Thickness of Sand Containing Slightly Saline Water in the Evangeline Aquifer and Lower Unit of the Chicot Aquifer
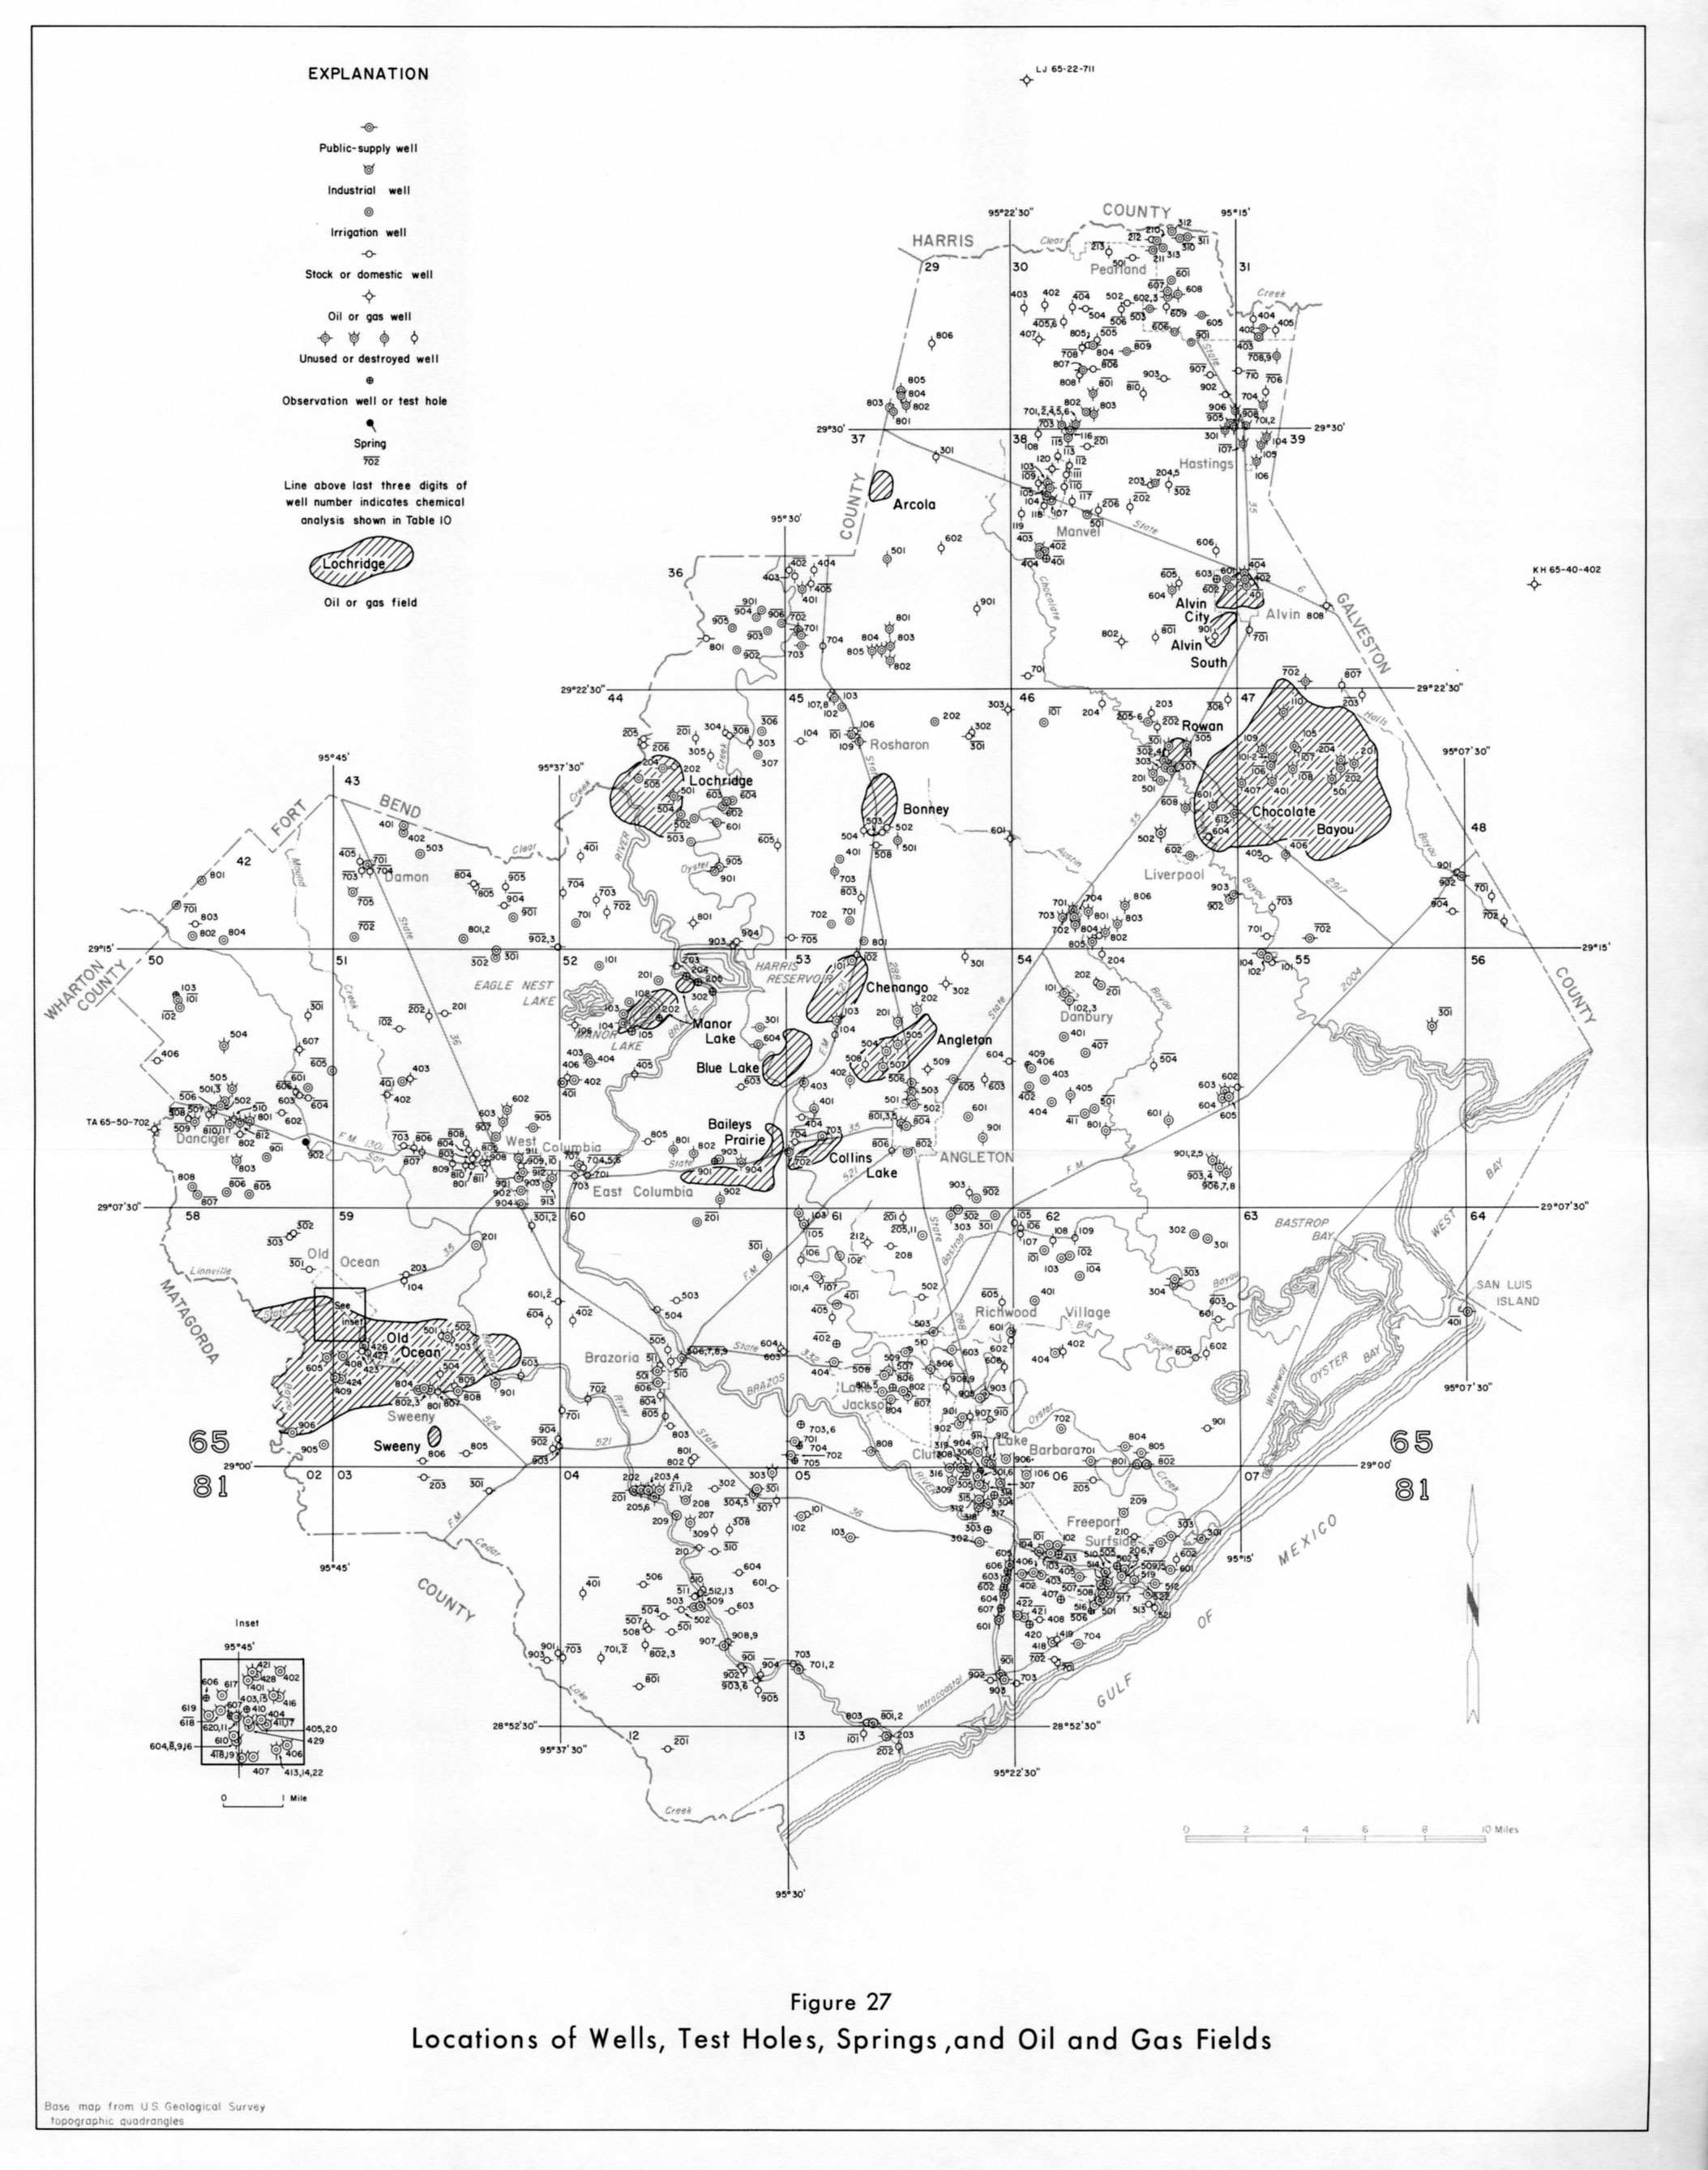
- Figure 27: Locations of Wells, test Holes, Springs, and Oil and Gas Fields
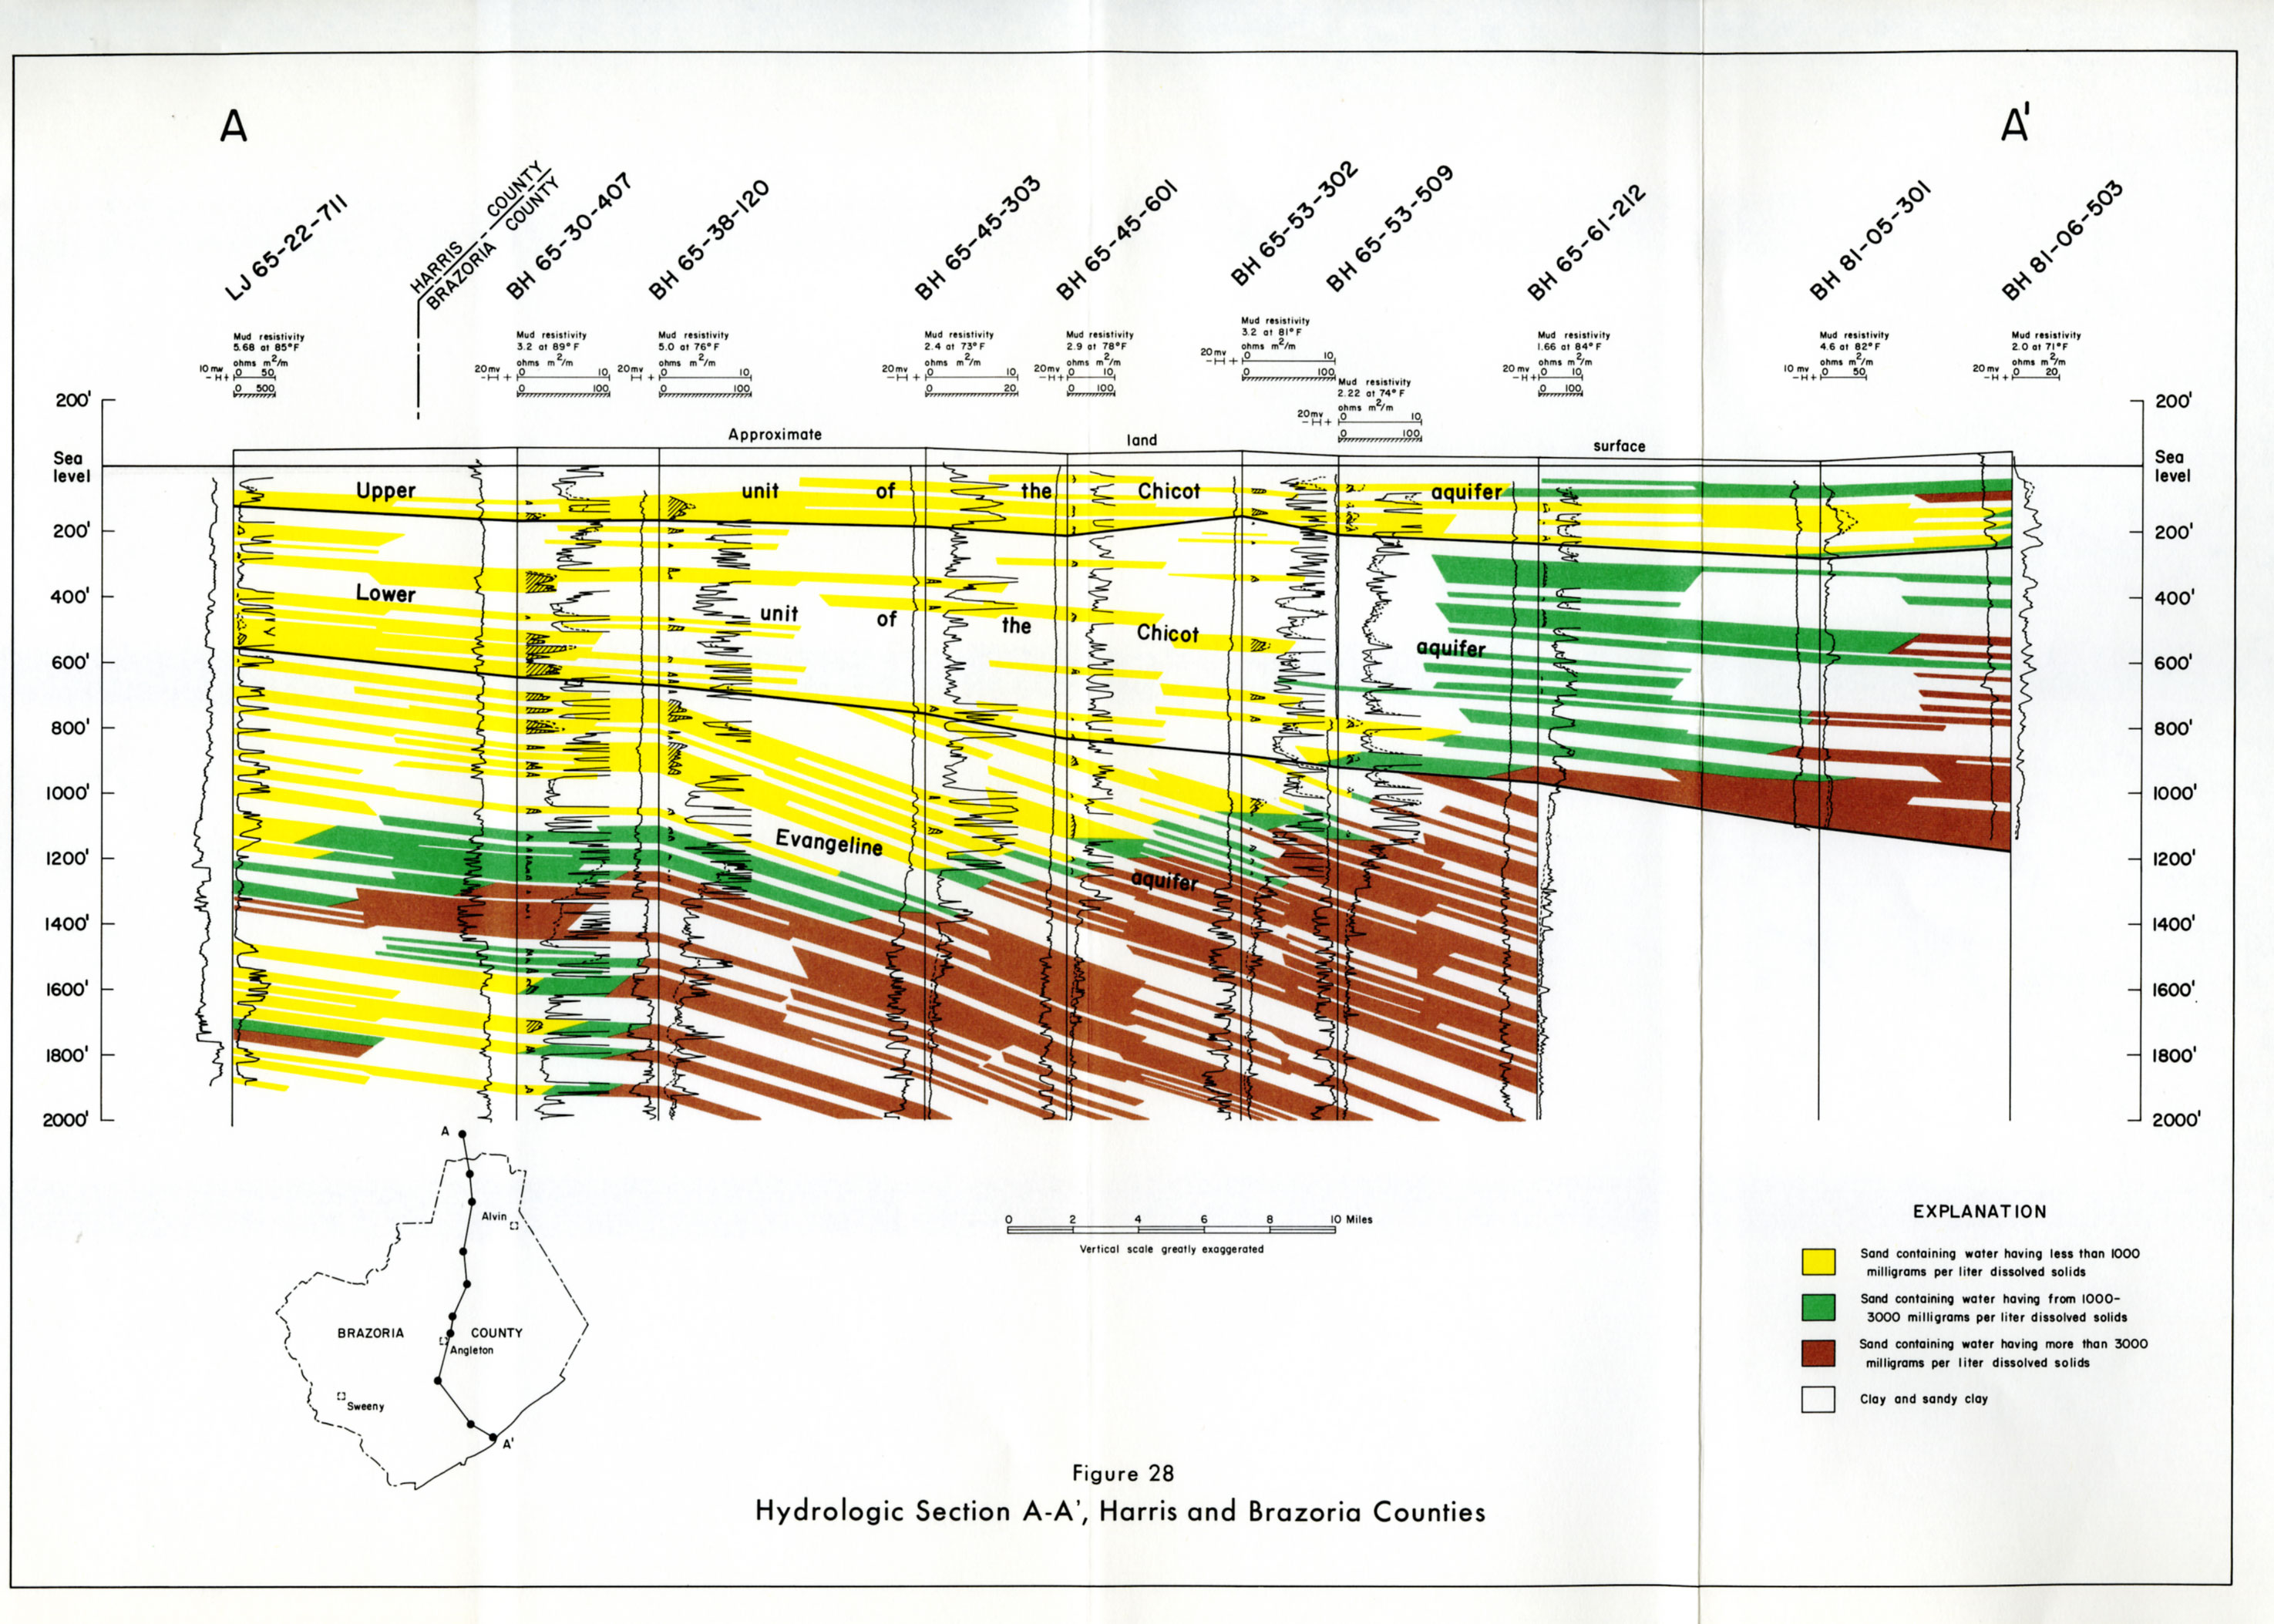
- Figure 28: Hydrologic Section A-A', Harris and Brazoria Counties
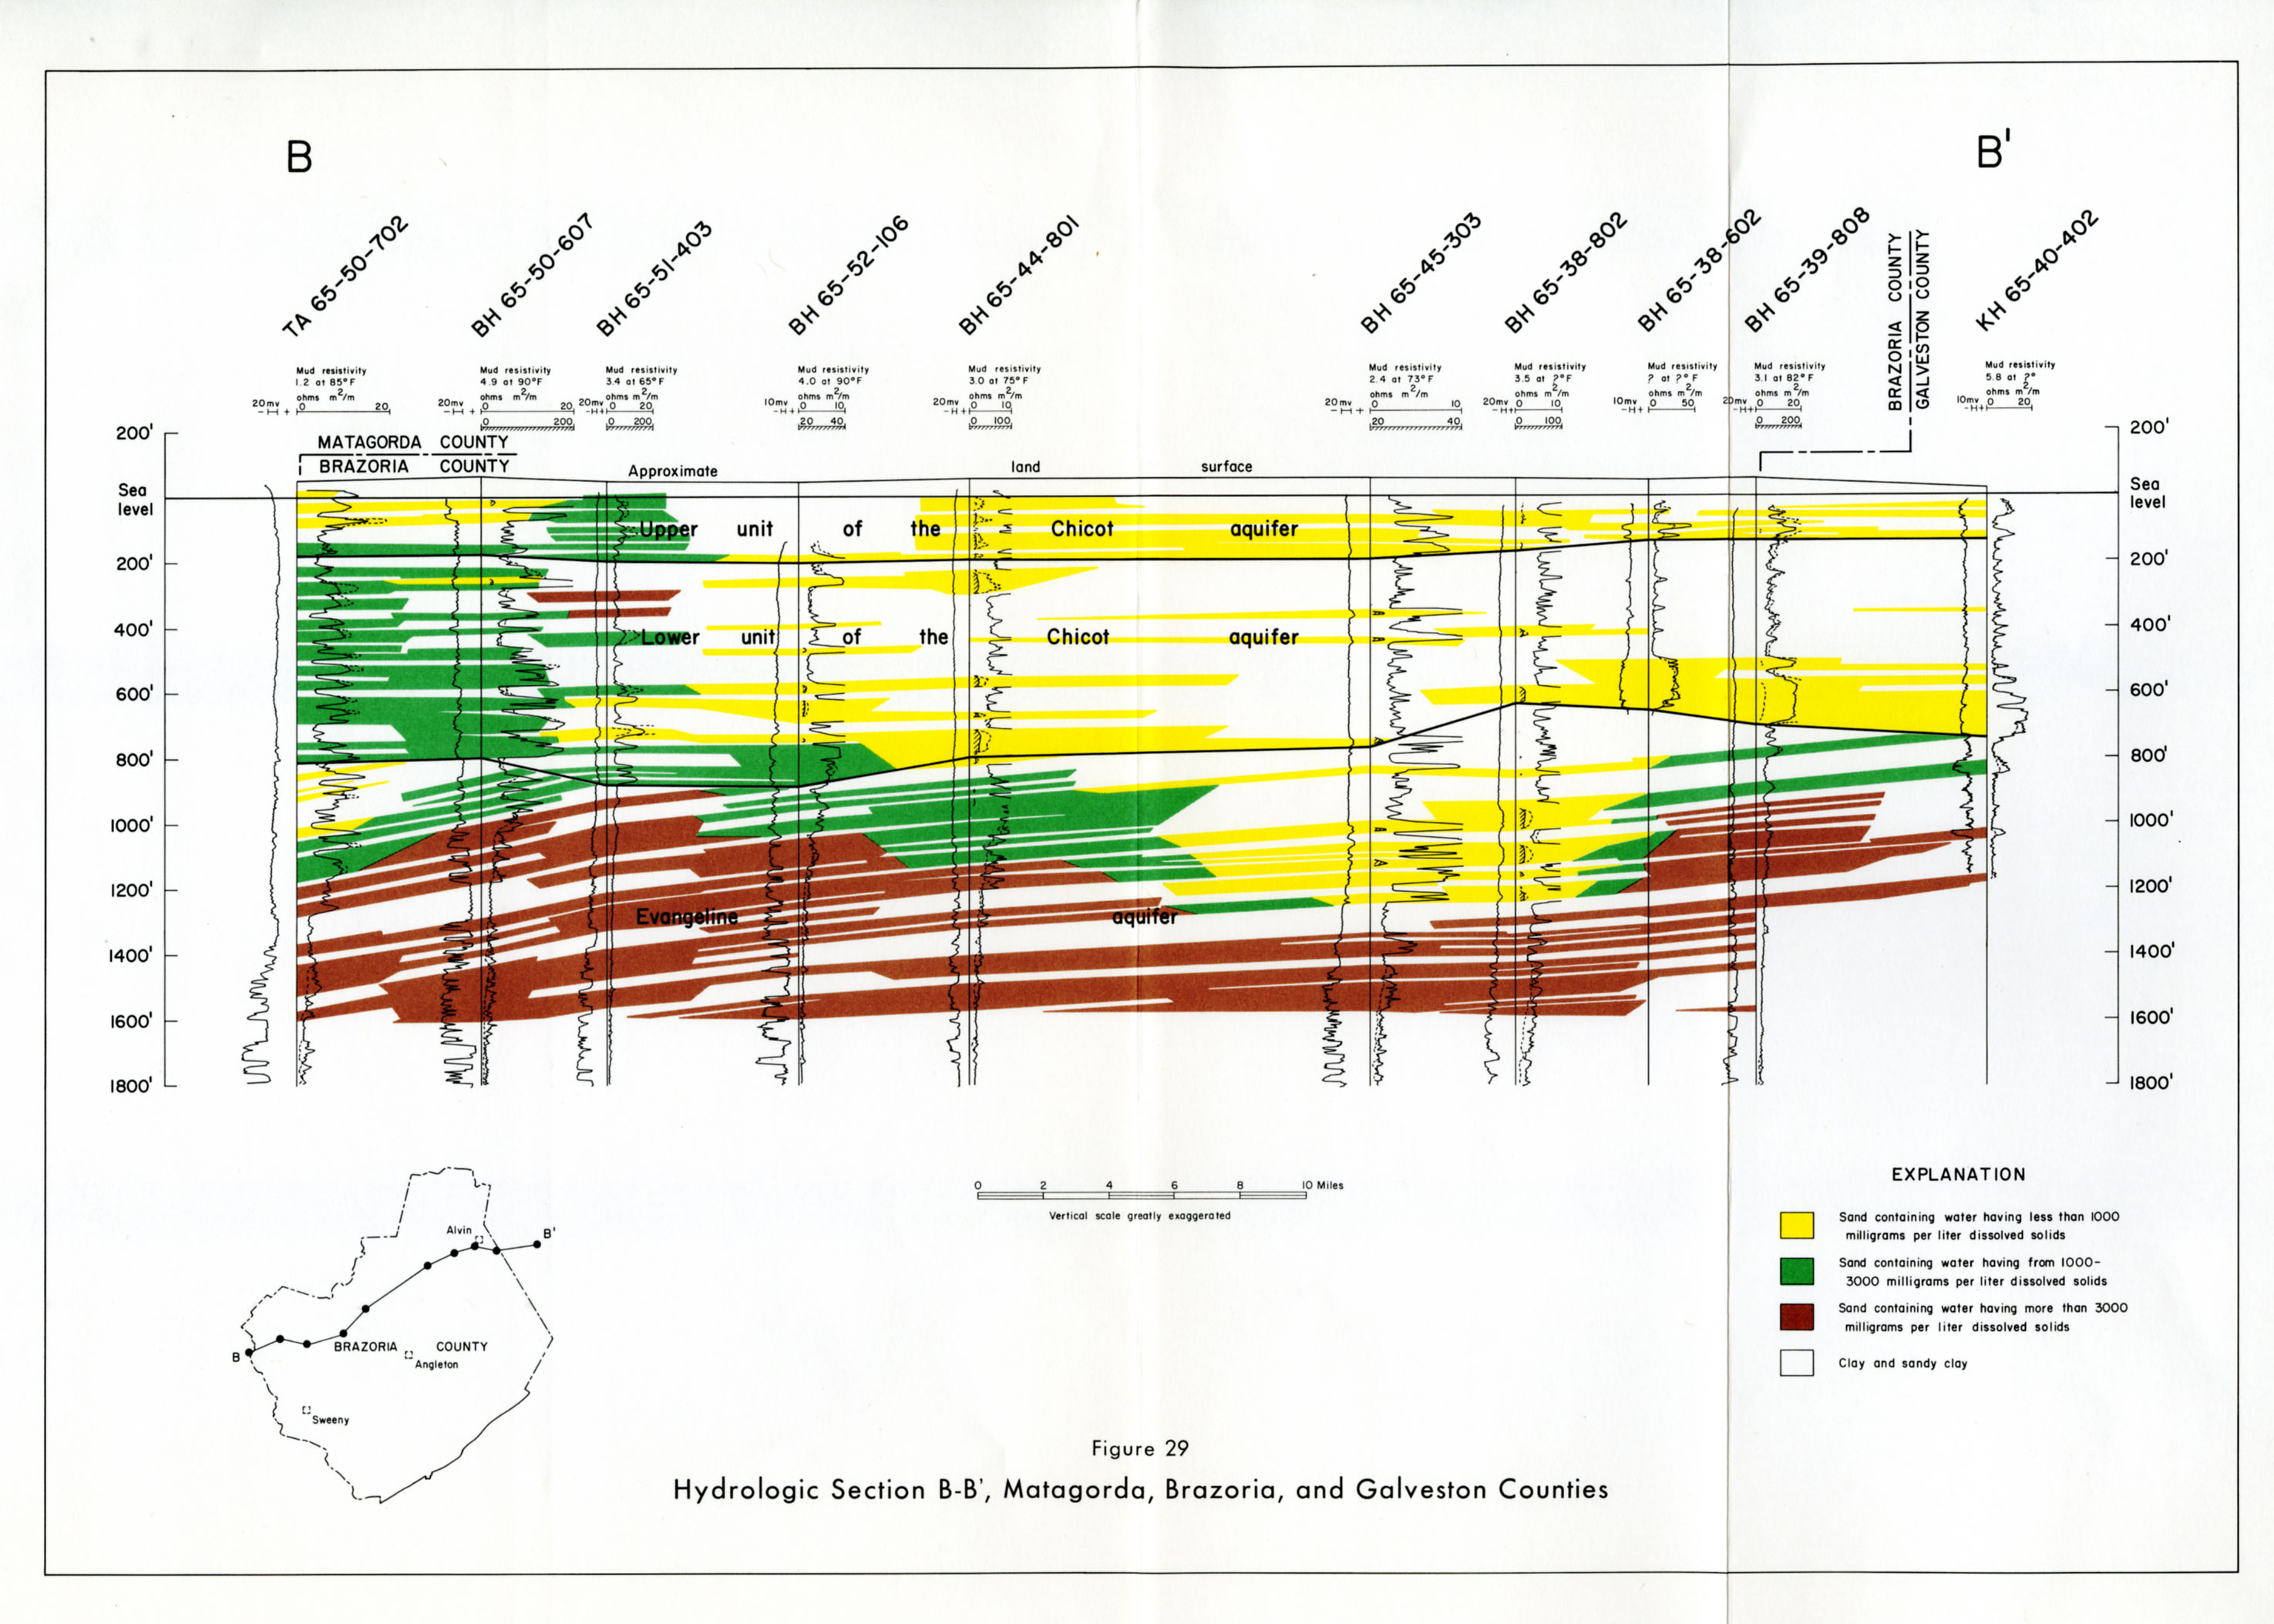
- Figure 29: Hydrologic Section B-B', Matagorda, Brazoria, and Galveston Counties