Report 215 By: Robert D. Price | April 1978
Figures (all figures are jpeg format. Note that maps are scanned separately from the report pdf's above)
- Report 215 (Part A) - Occurrence, Quality, and Availability of Ground Water in Jones County, Texas
- Report 215 (Part B) - Occurrence, Quality, and Availability of Ground Water in Jones County, Texas (tabular data)
- Figure 5: Geologic Map of Jones County
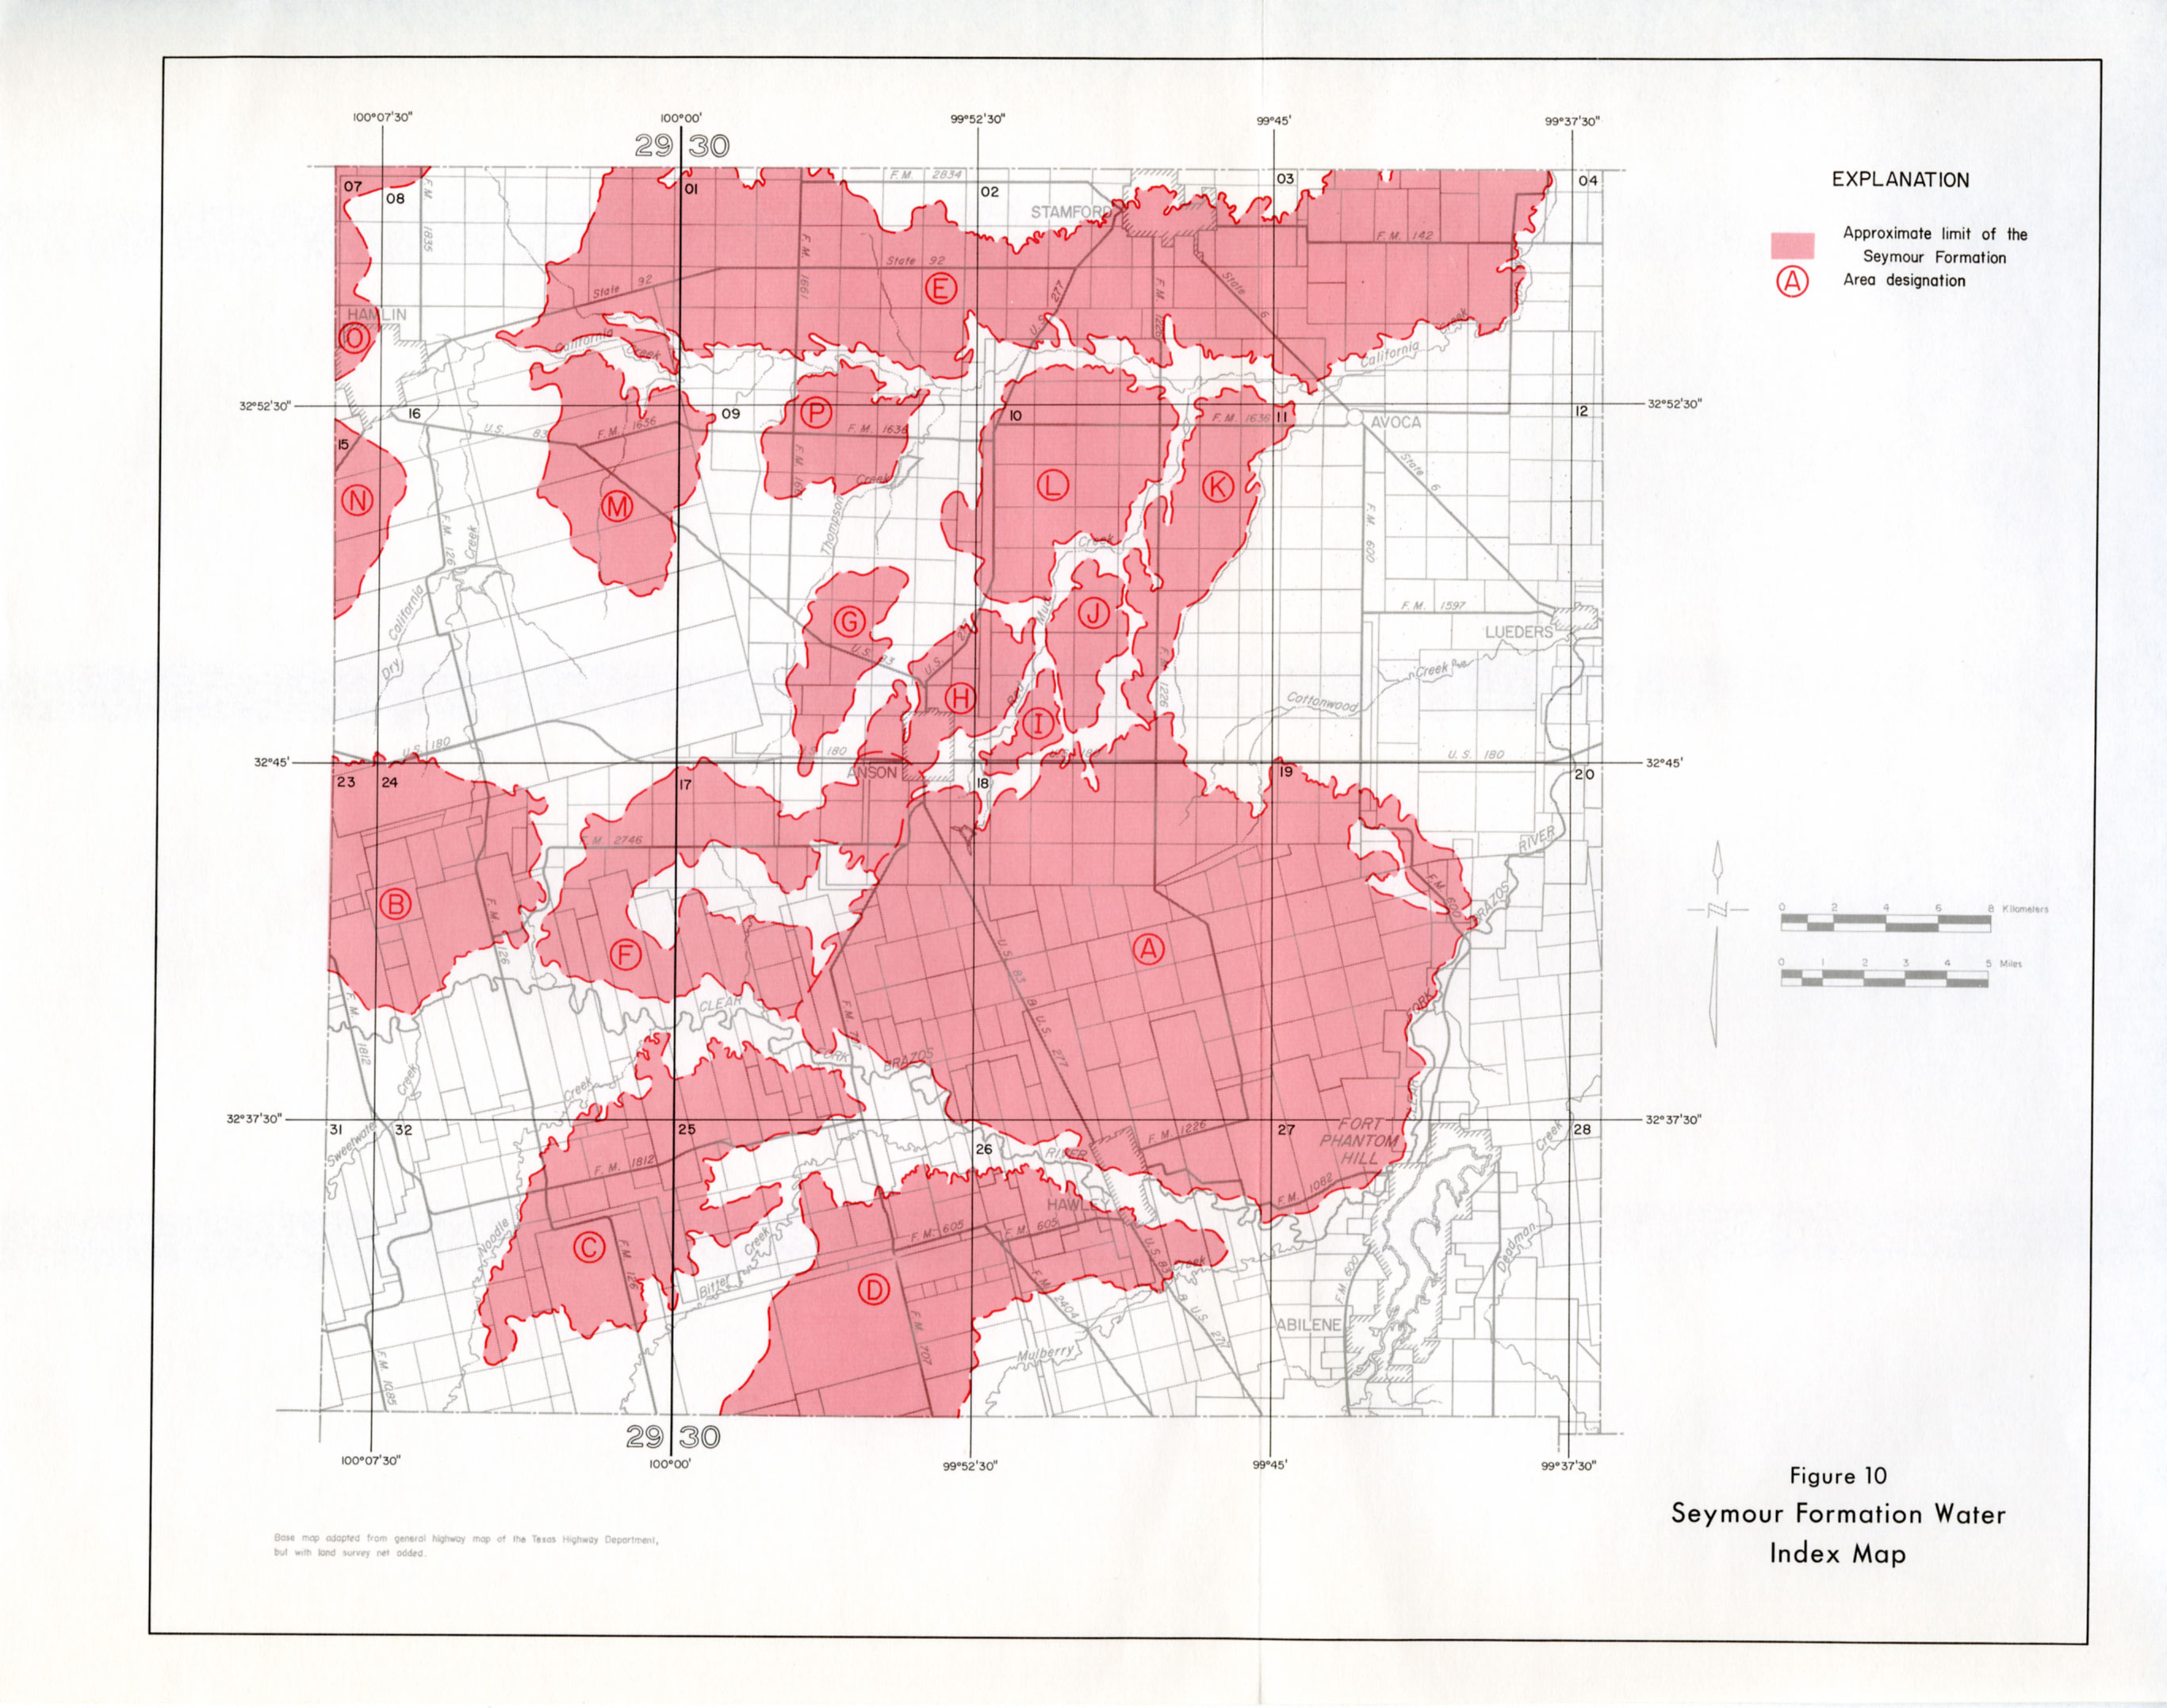
- Figure 10: Seymour Formation Water Index Map
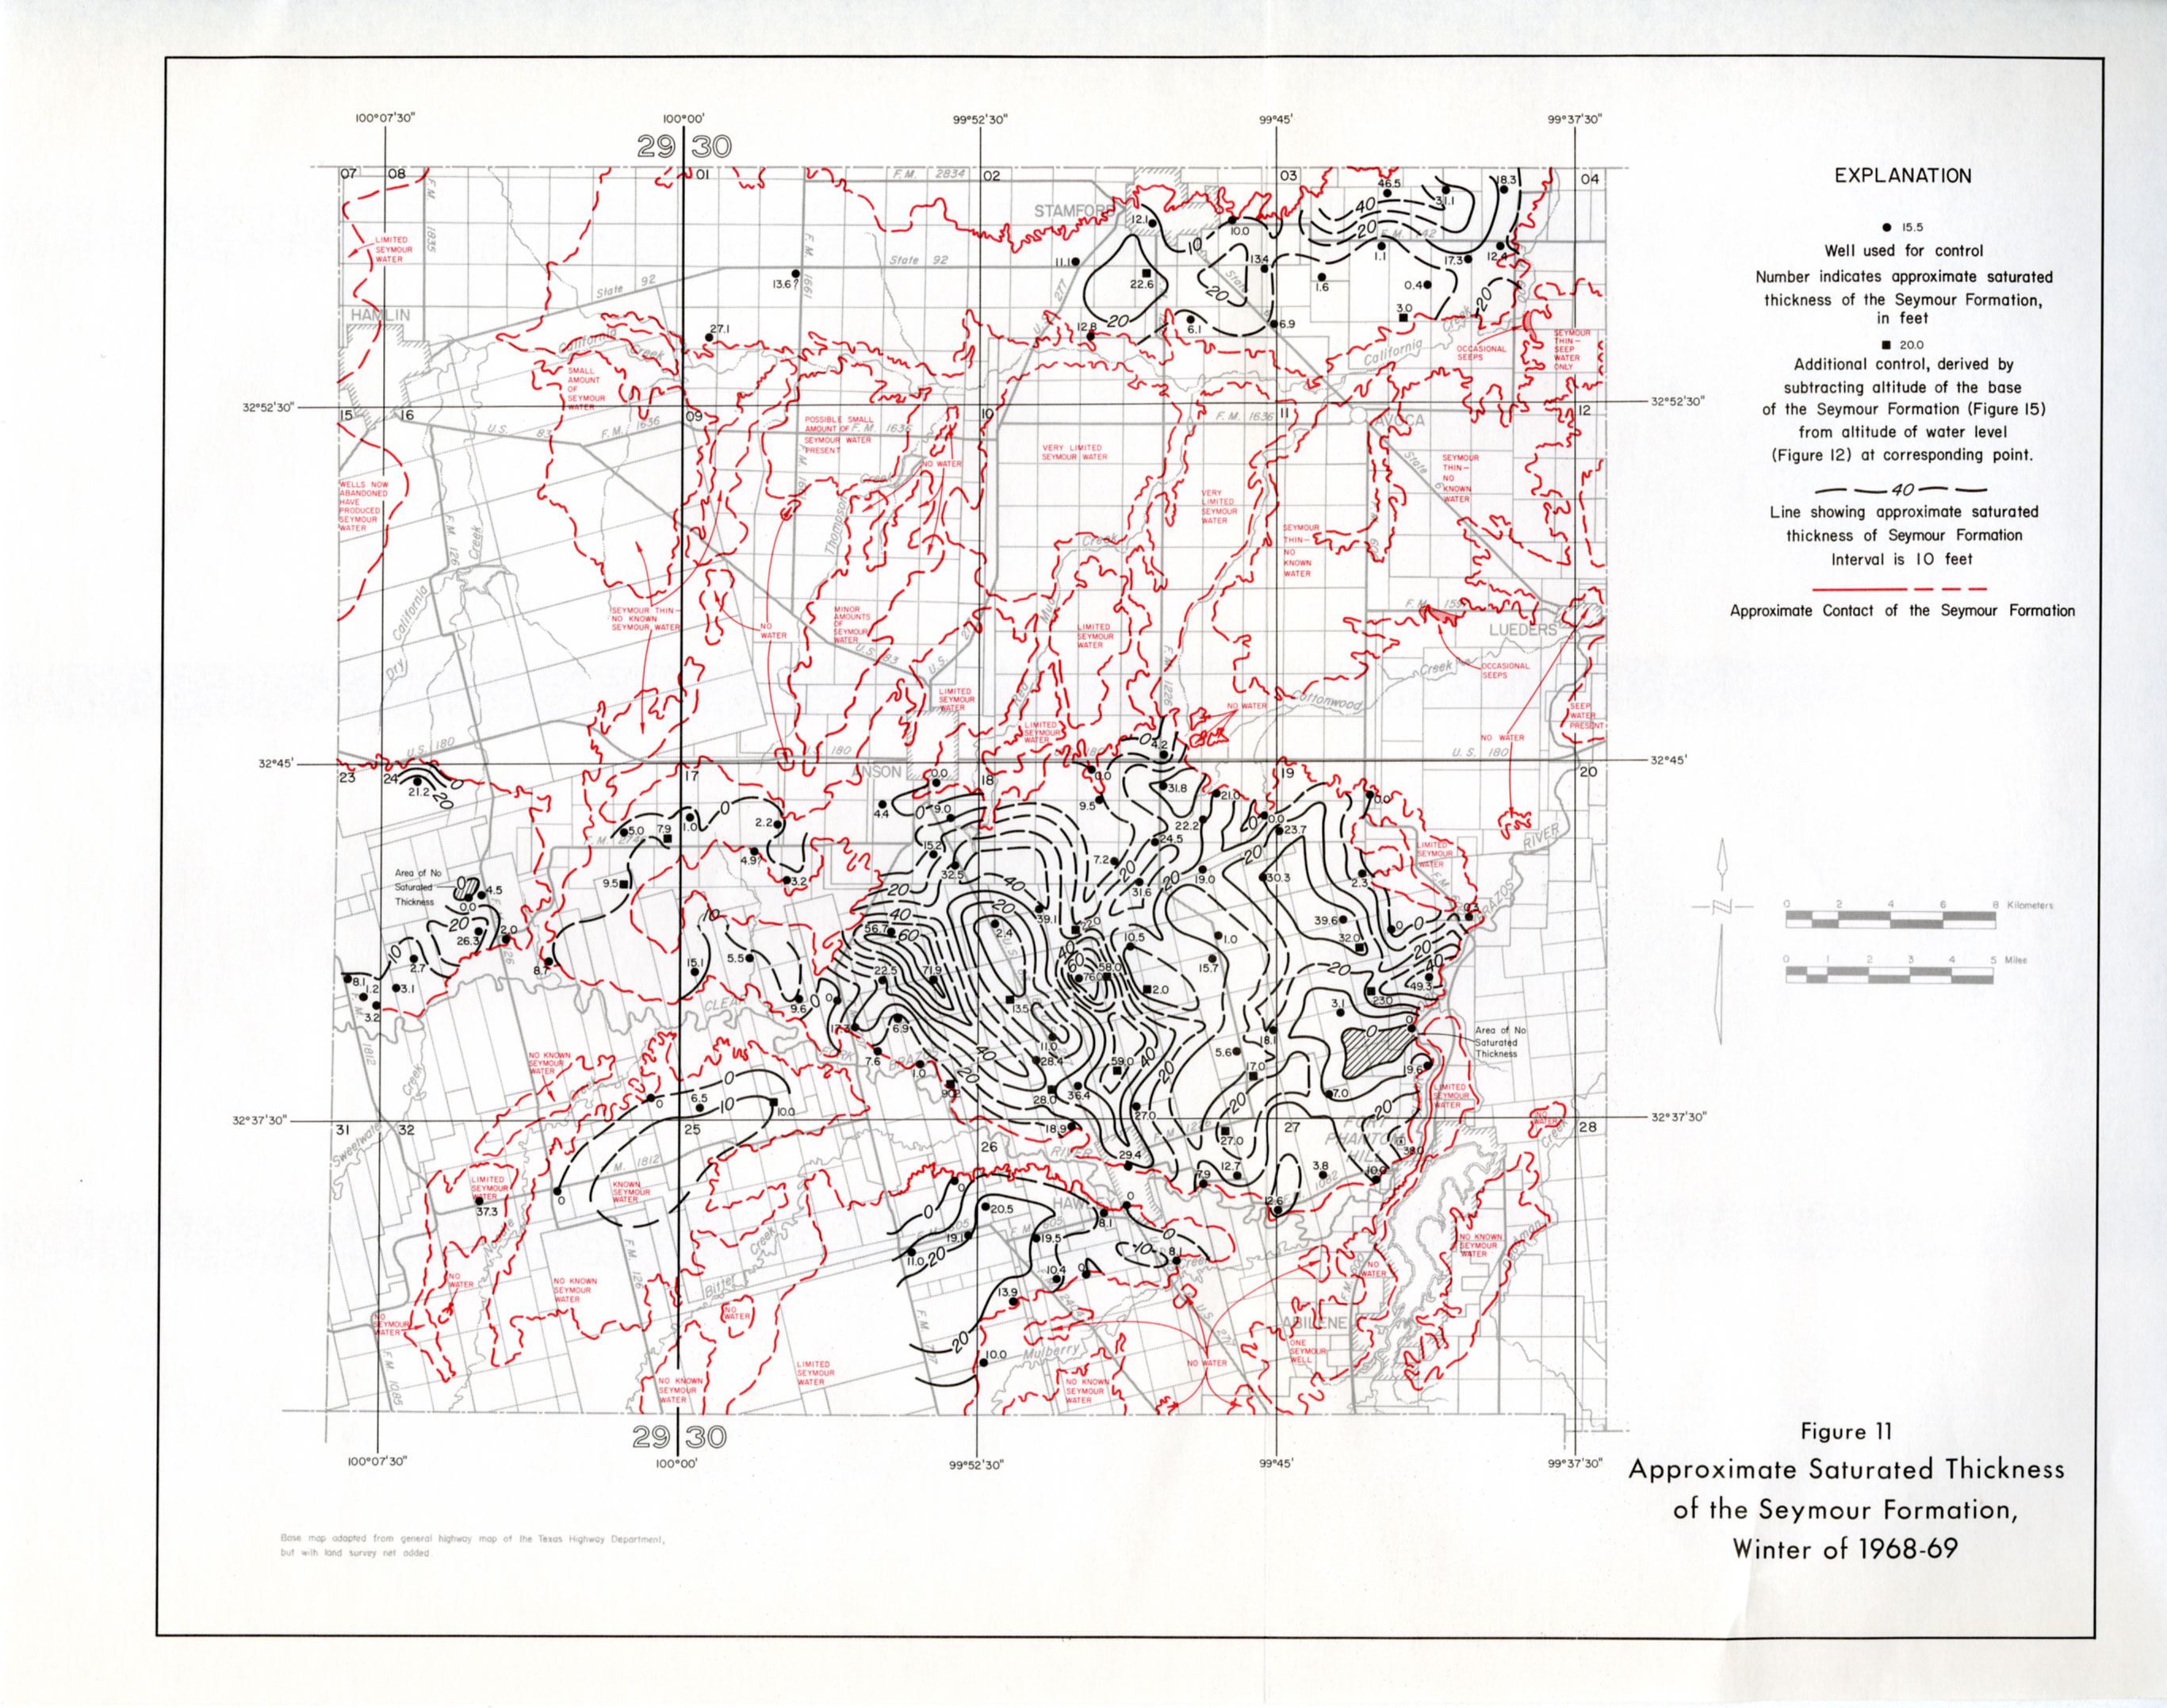
- Figure 11: Approximate Saturated Thickness of the Seymour Formation, Winter of 1968-69
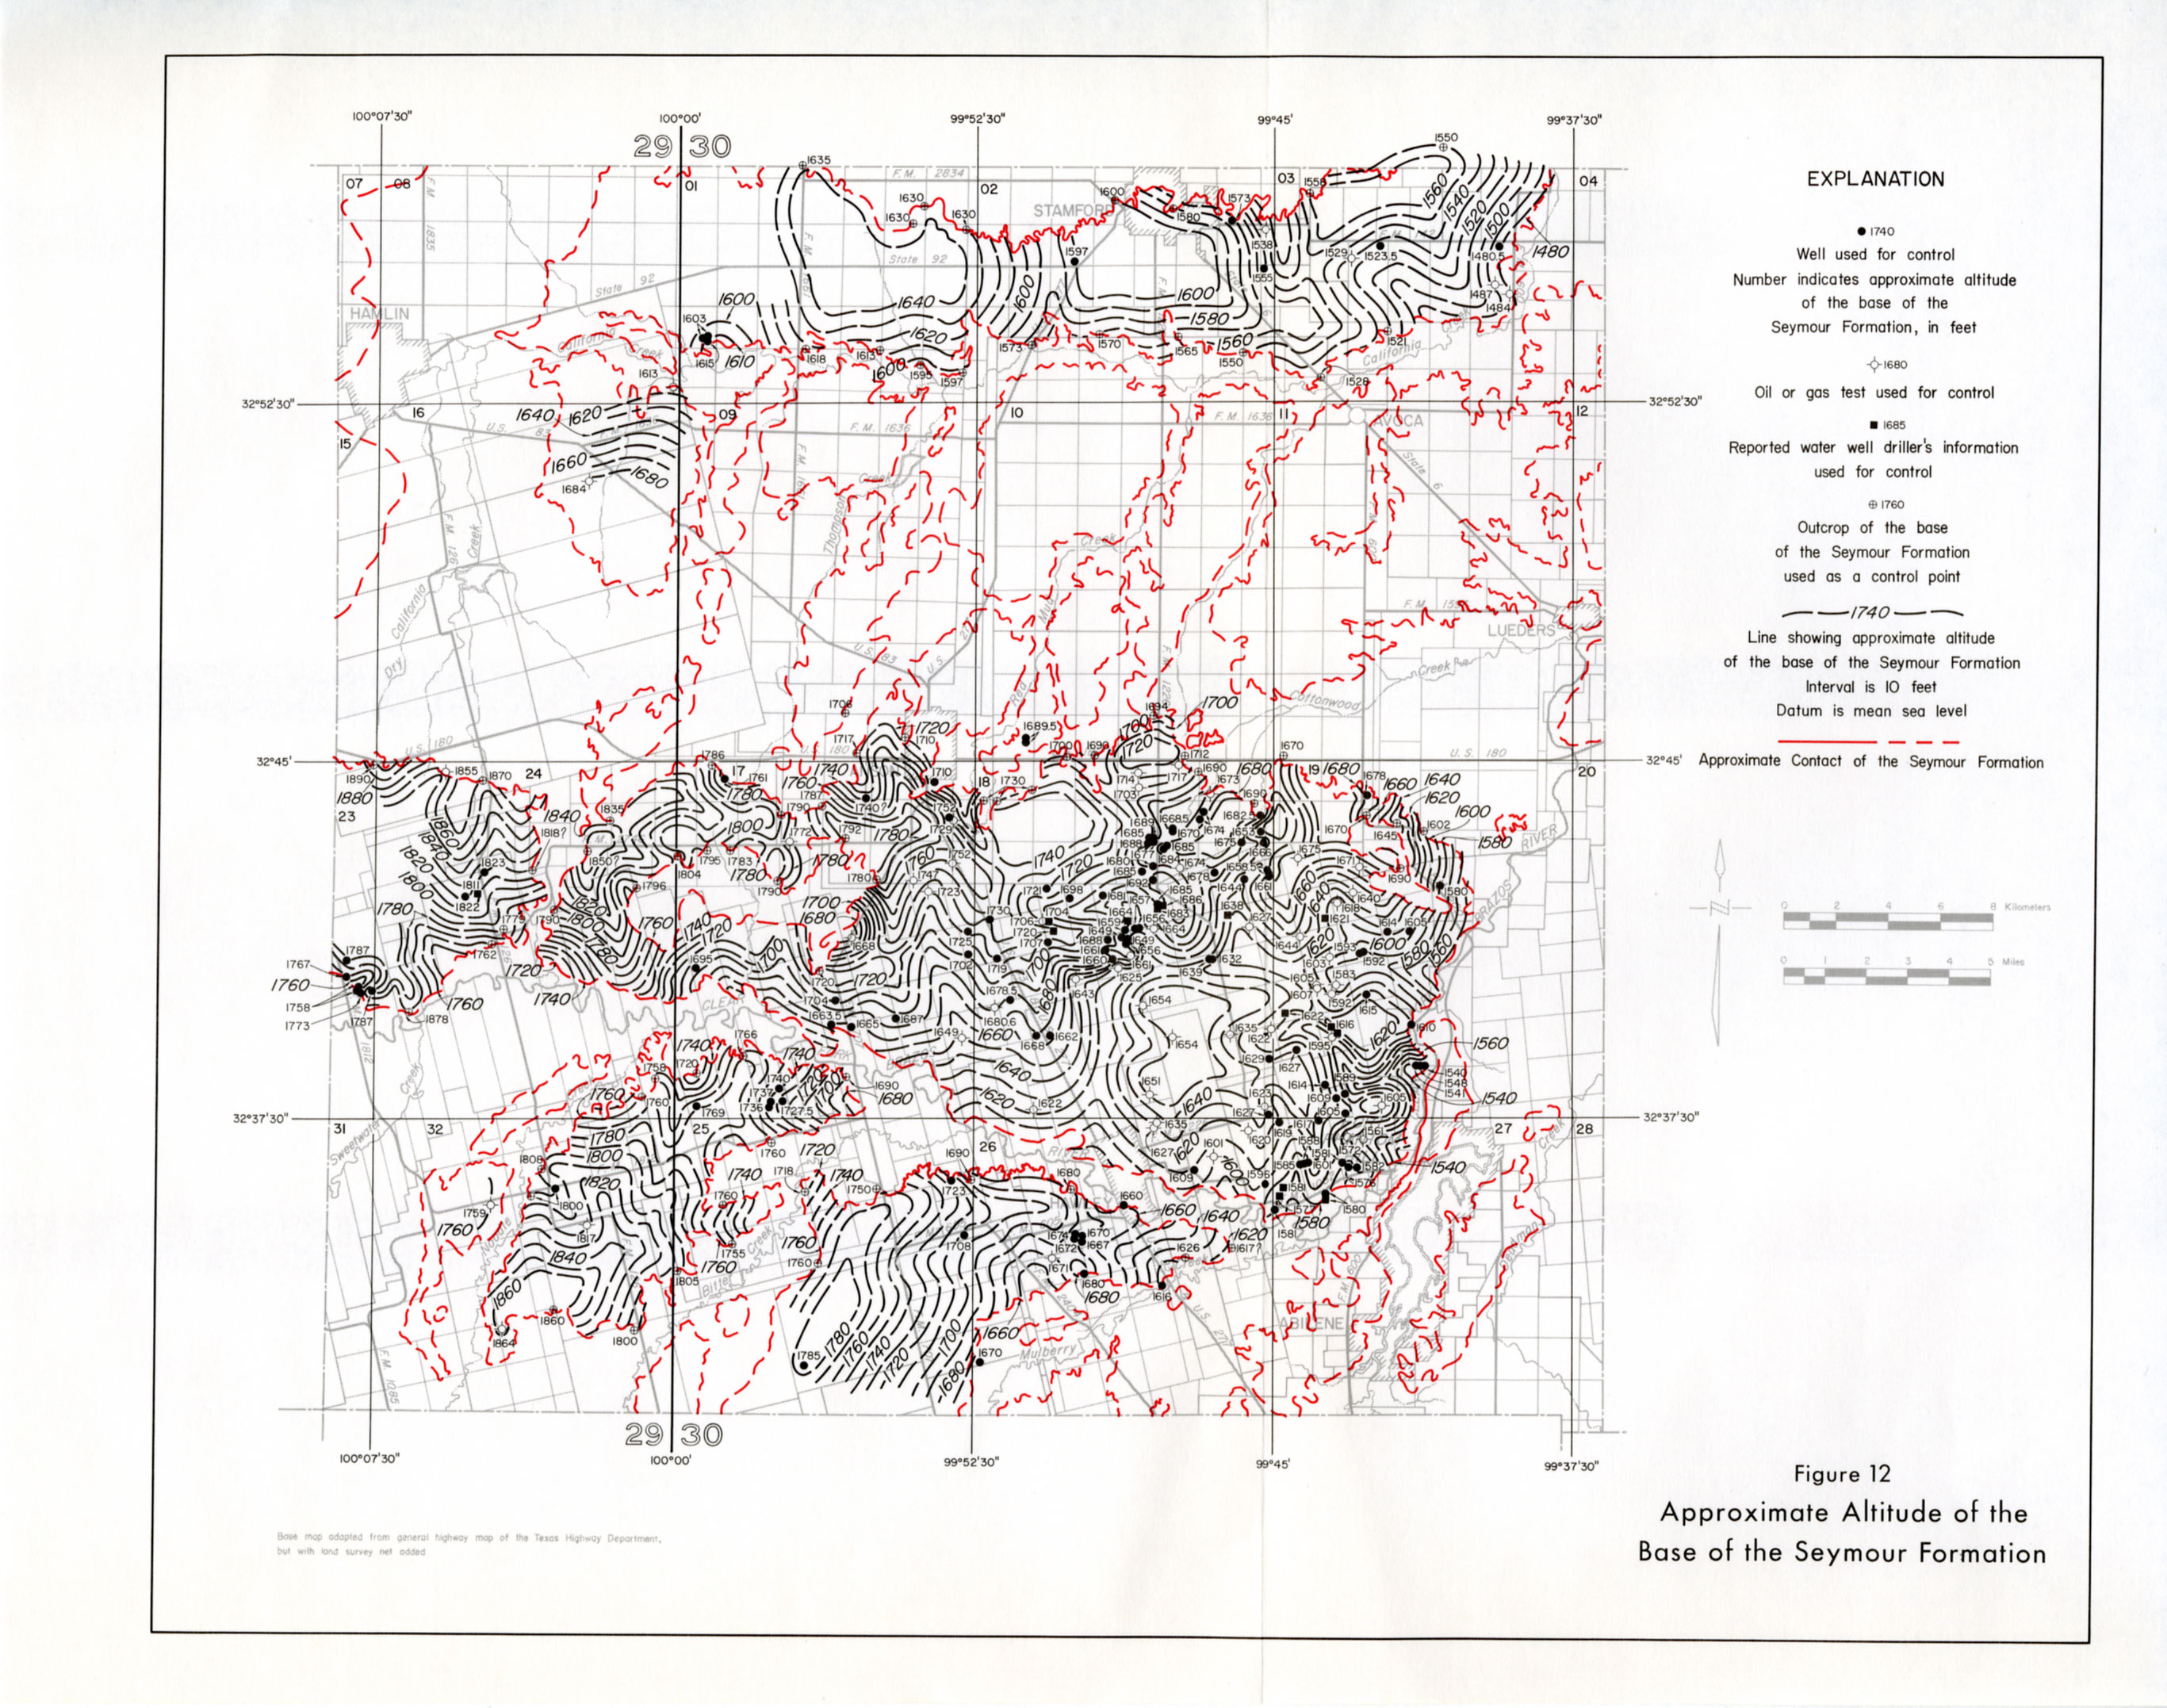
- Figure 12: Approximate Altitude of the Base of the Seymour Formation
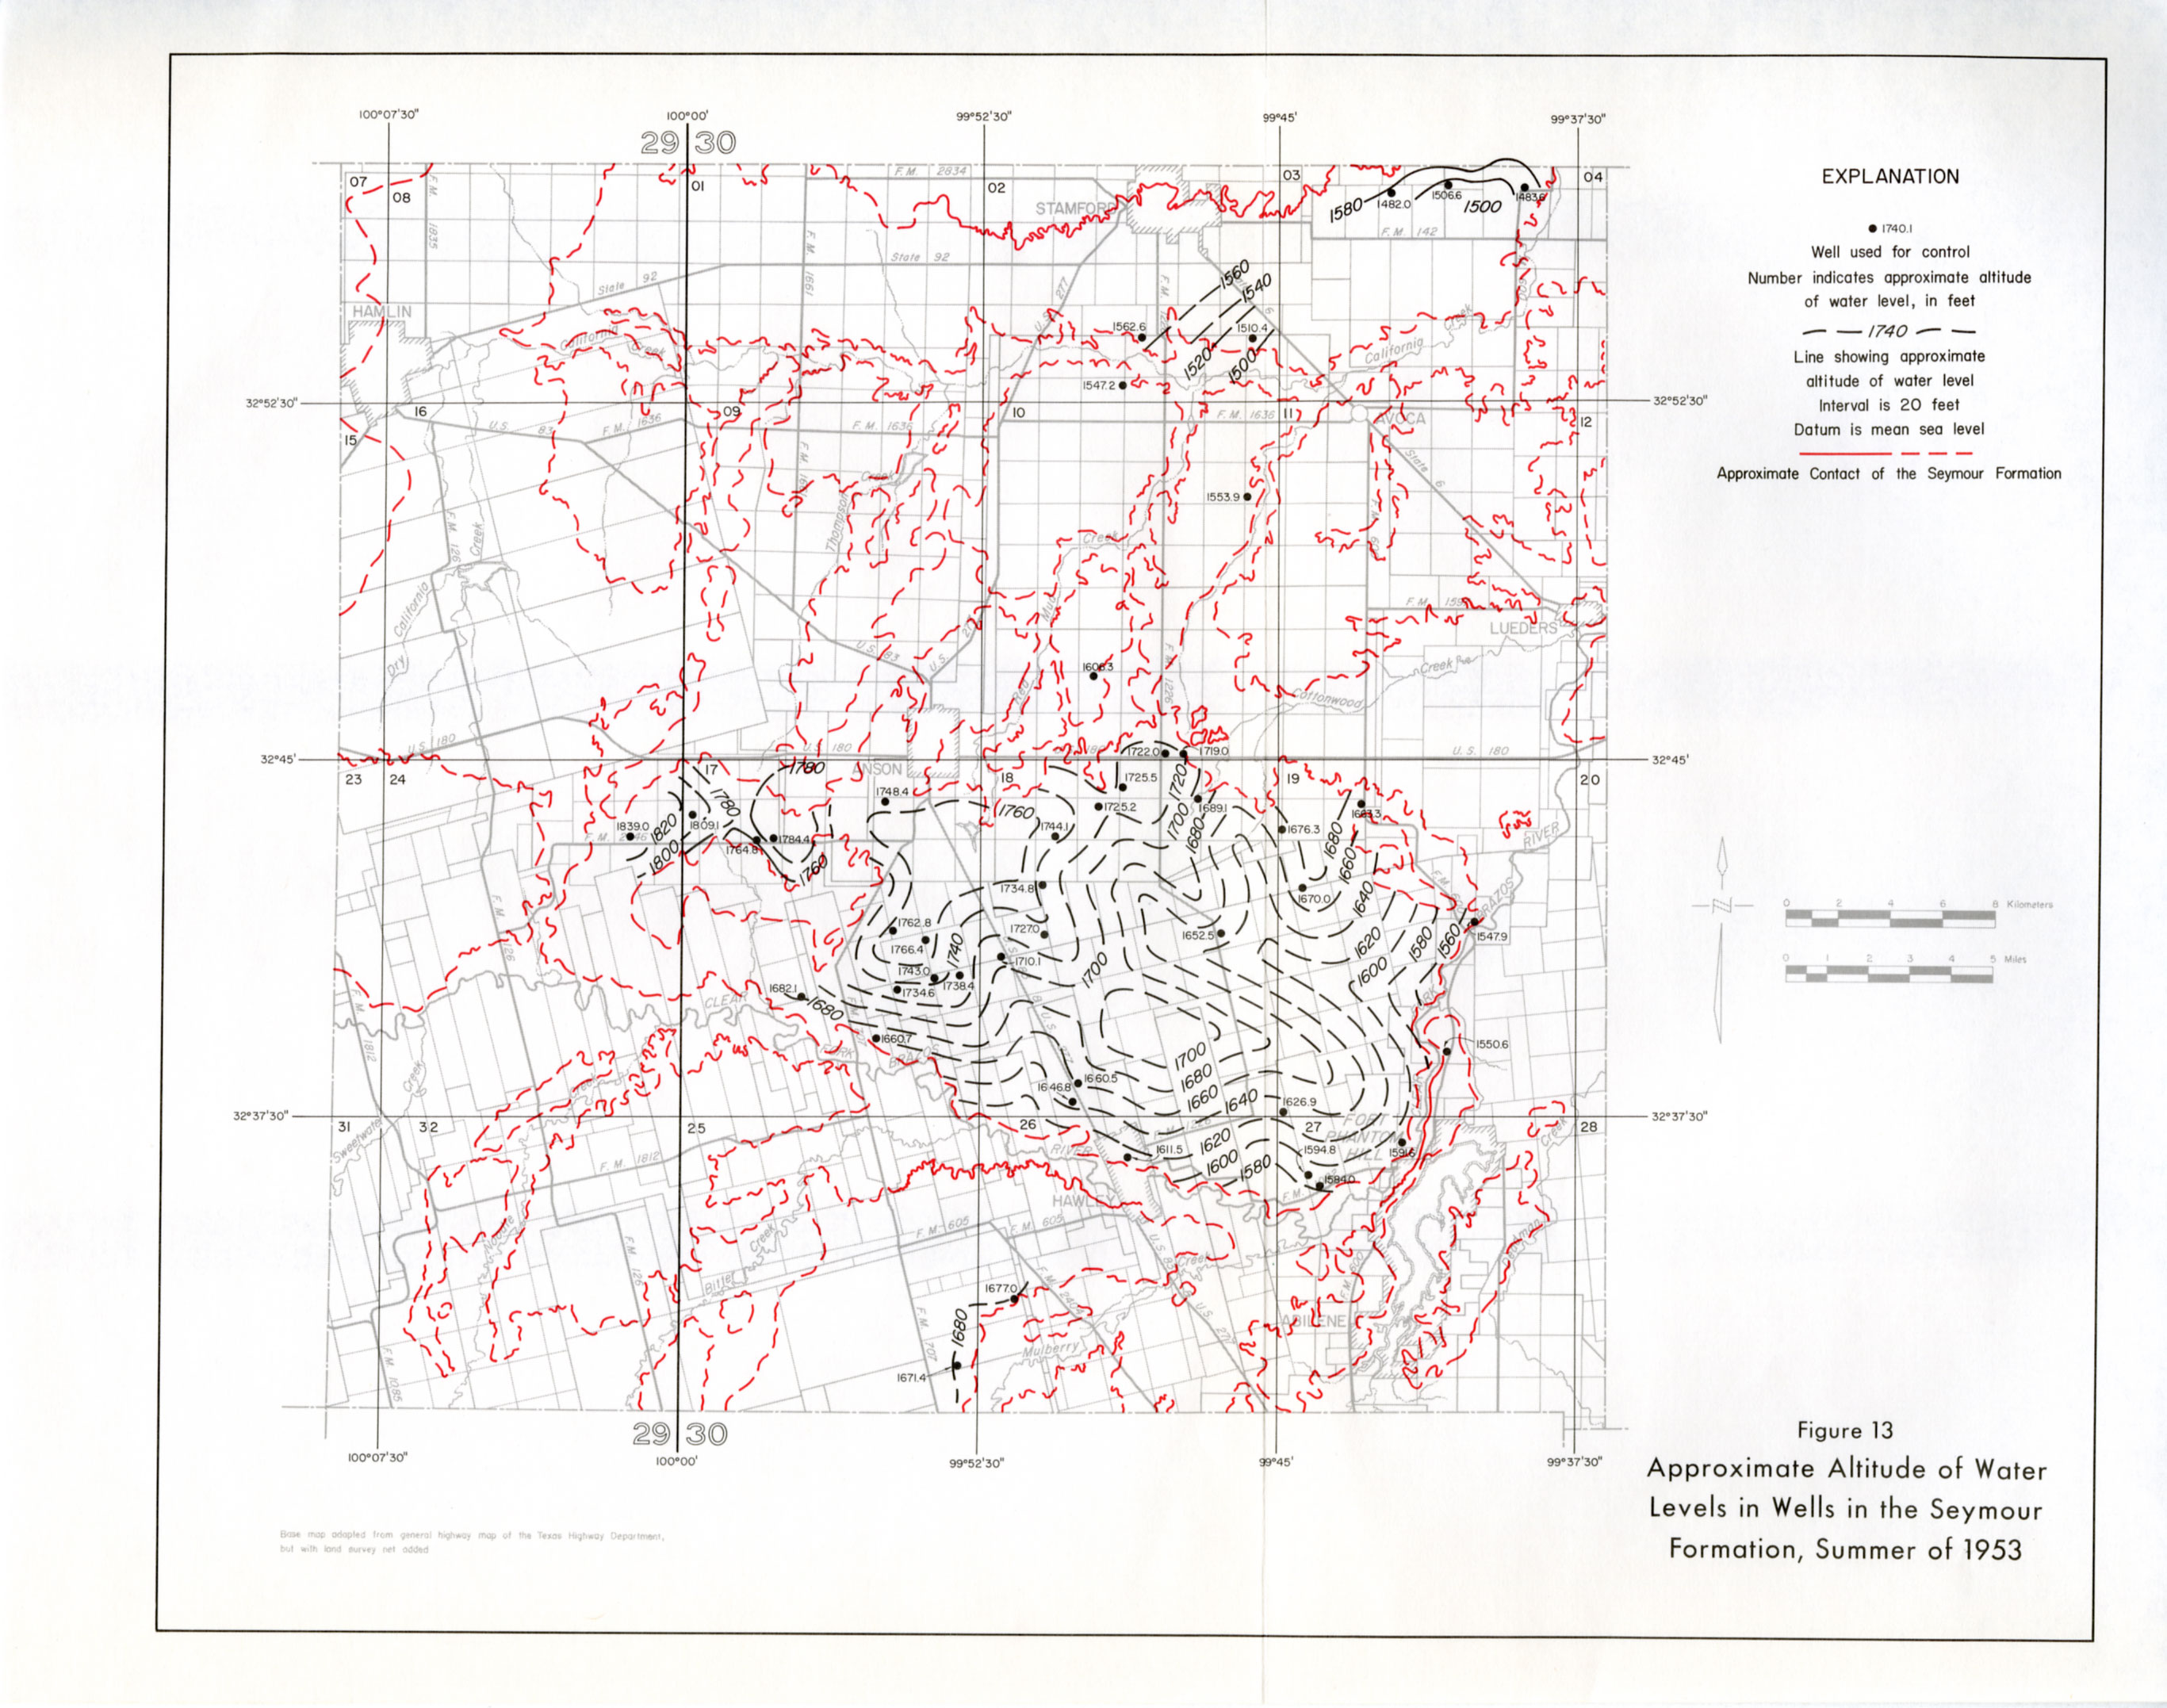
- Figure 13: Approximate Altitude of Water Levels in Wells in the Seymour Formation, Summer of 1953
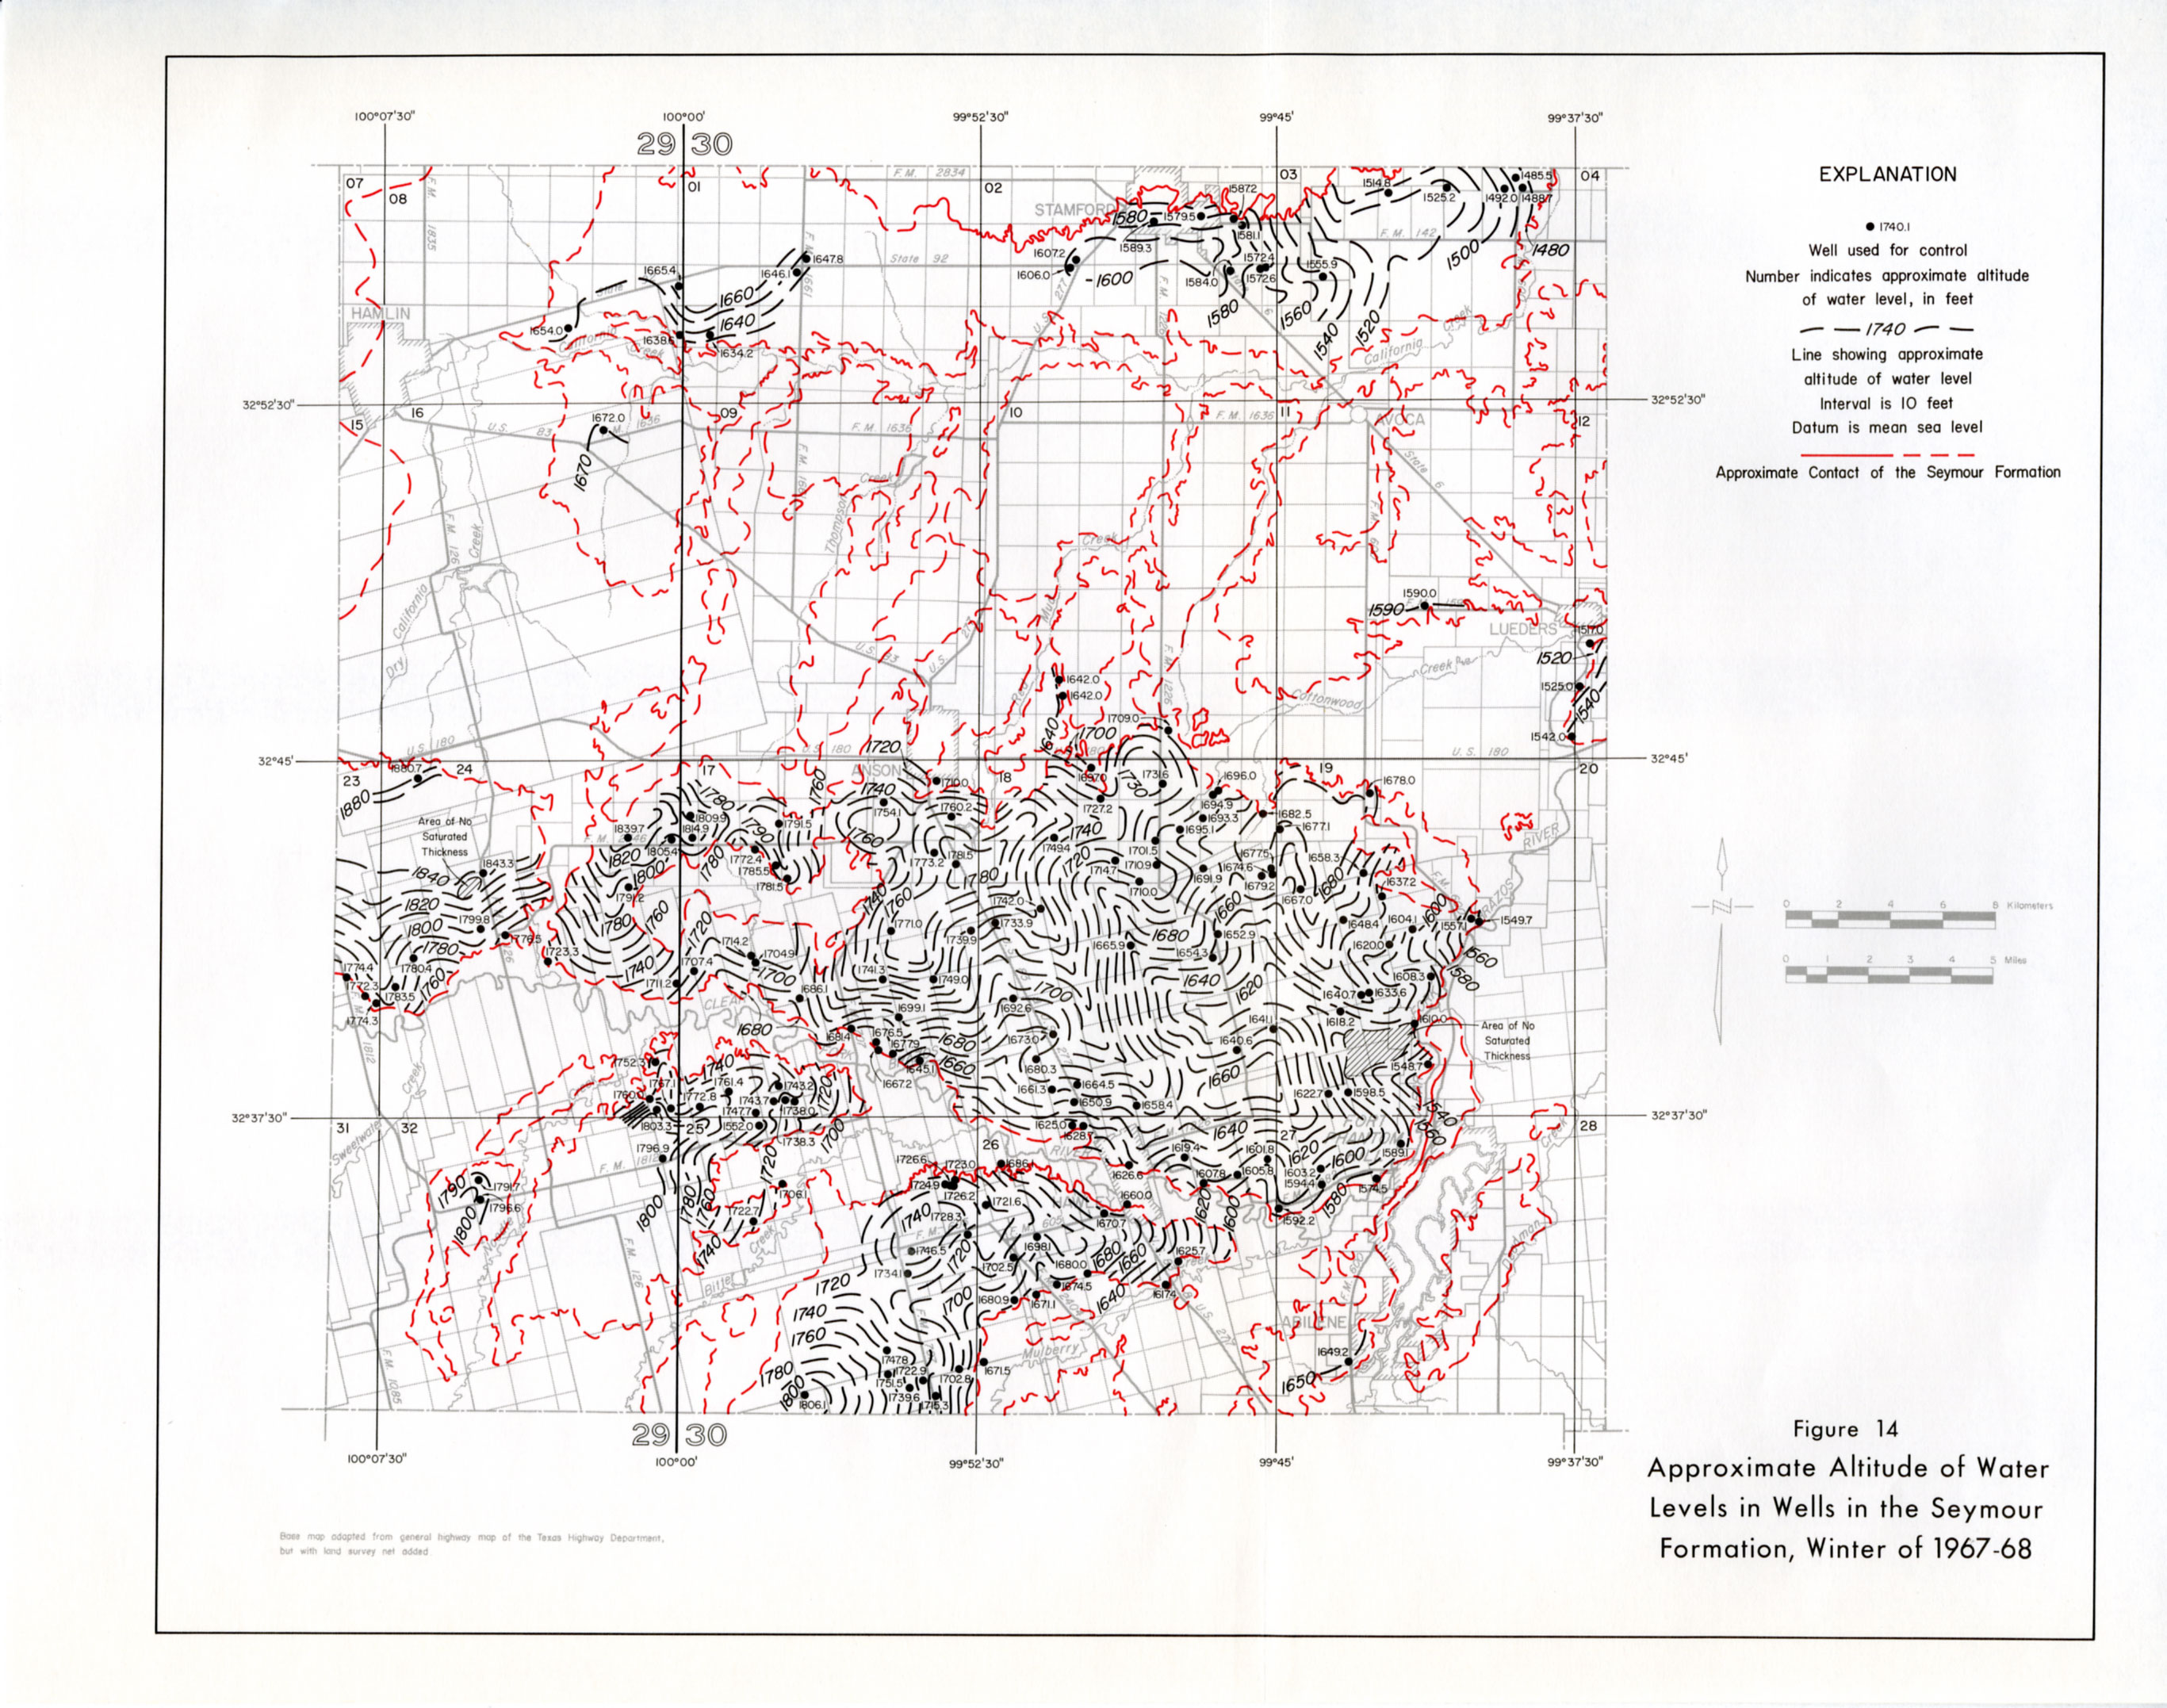
- Figure 14: Approximate Altitude of Water Levels in Wells in the Seymour Formation, Winter of 1967-68
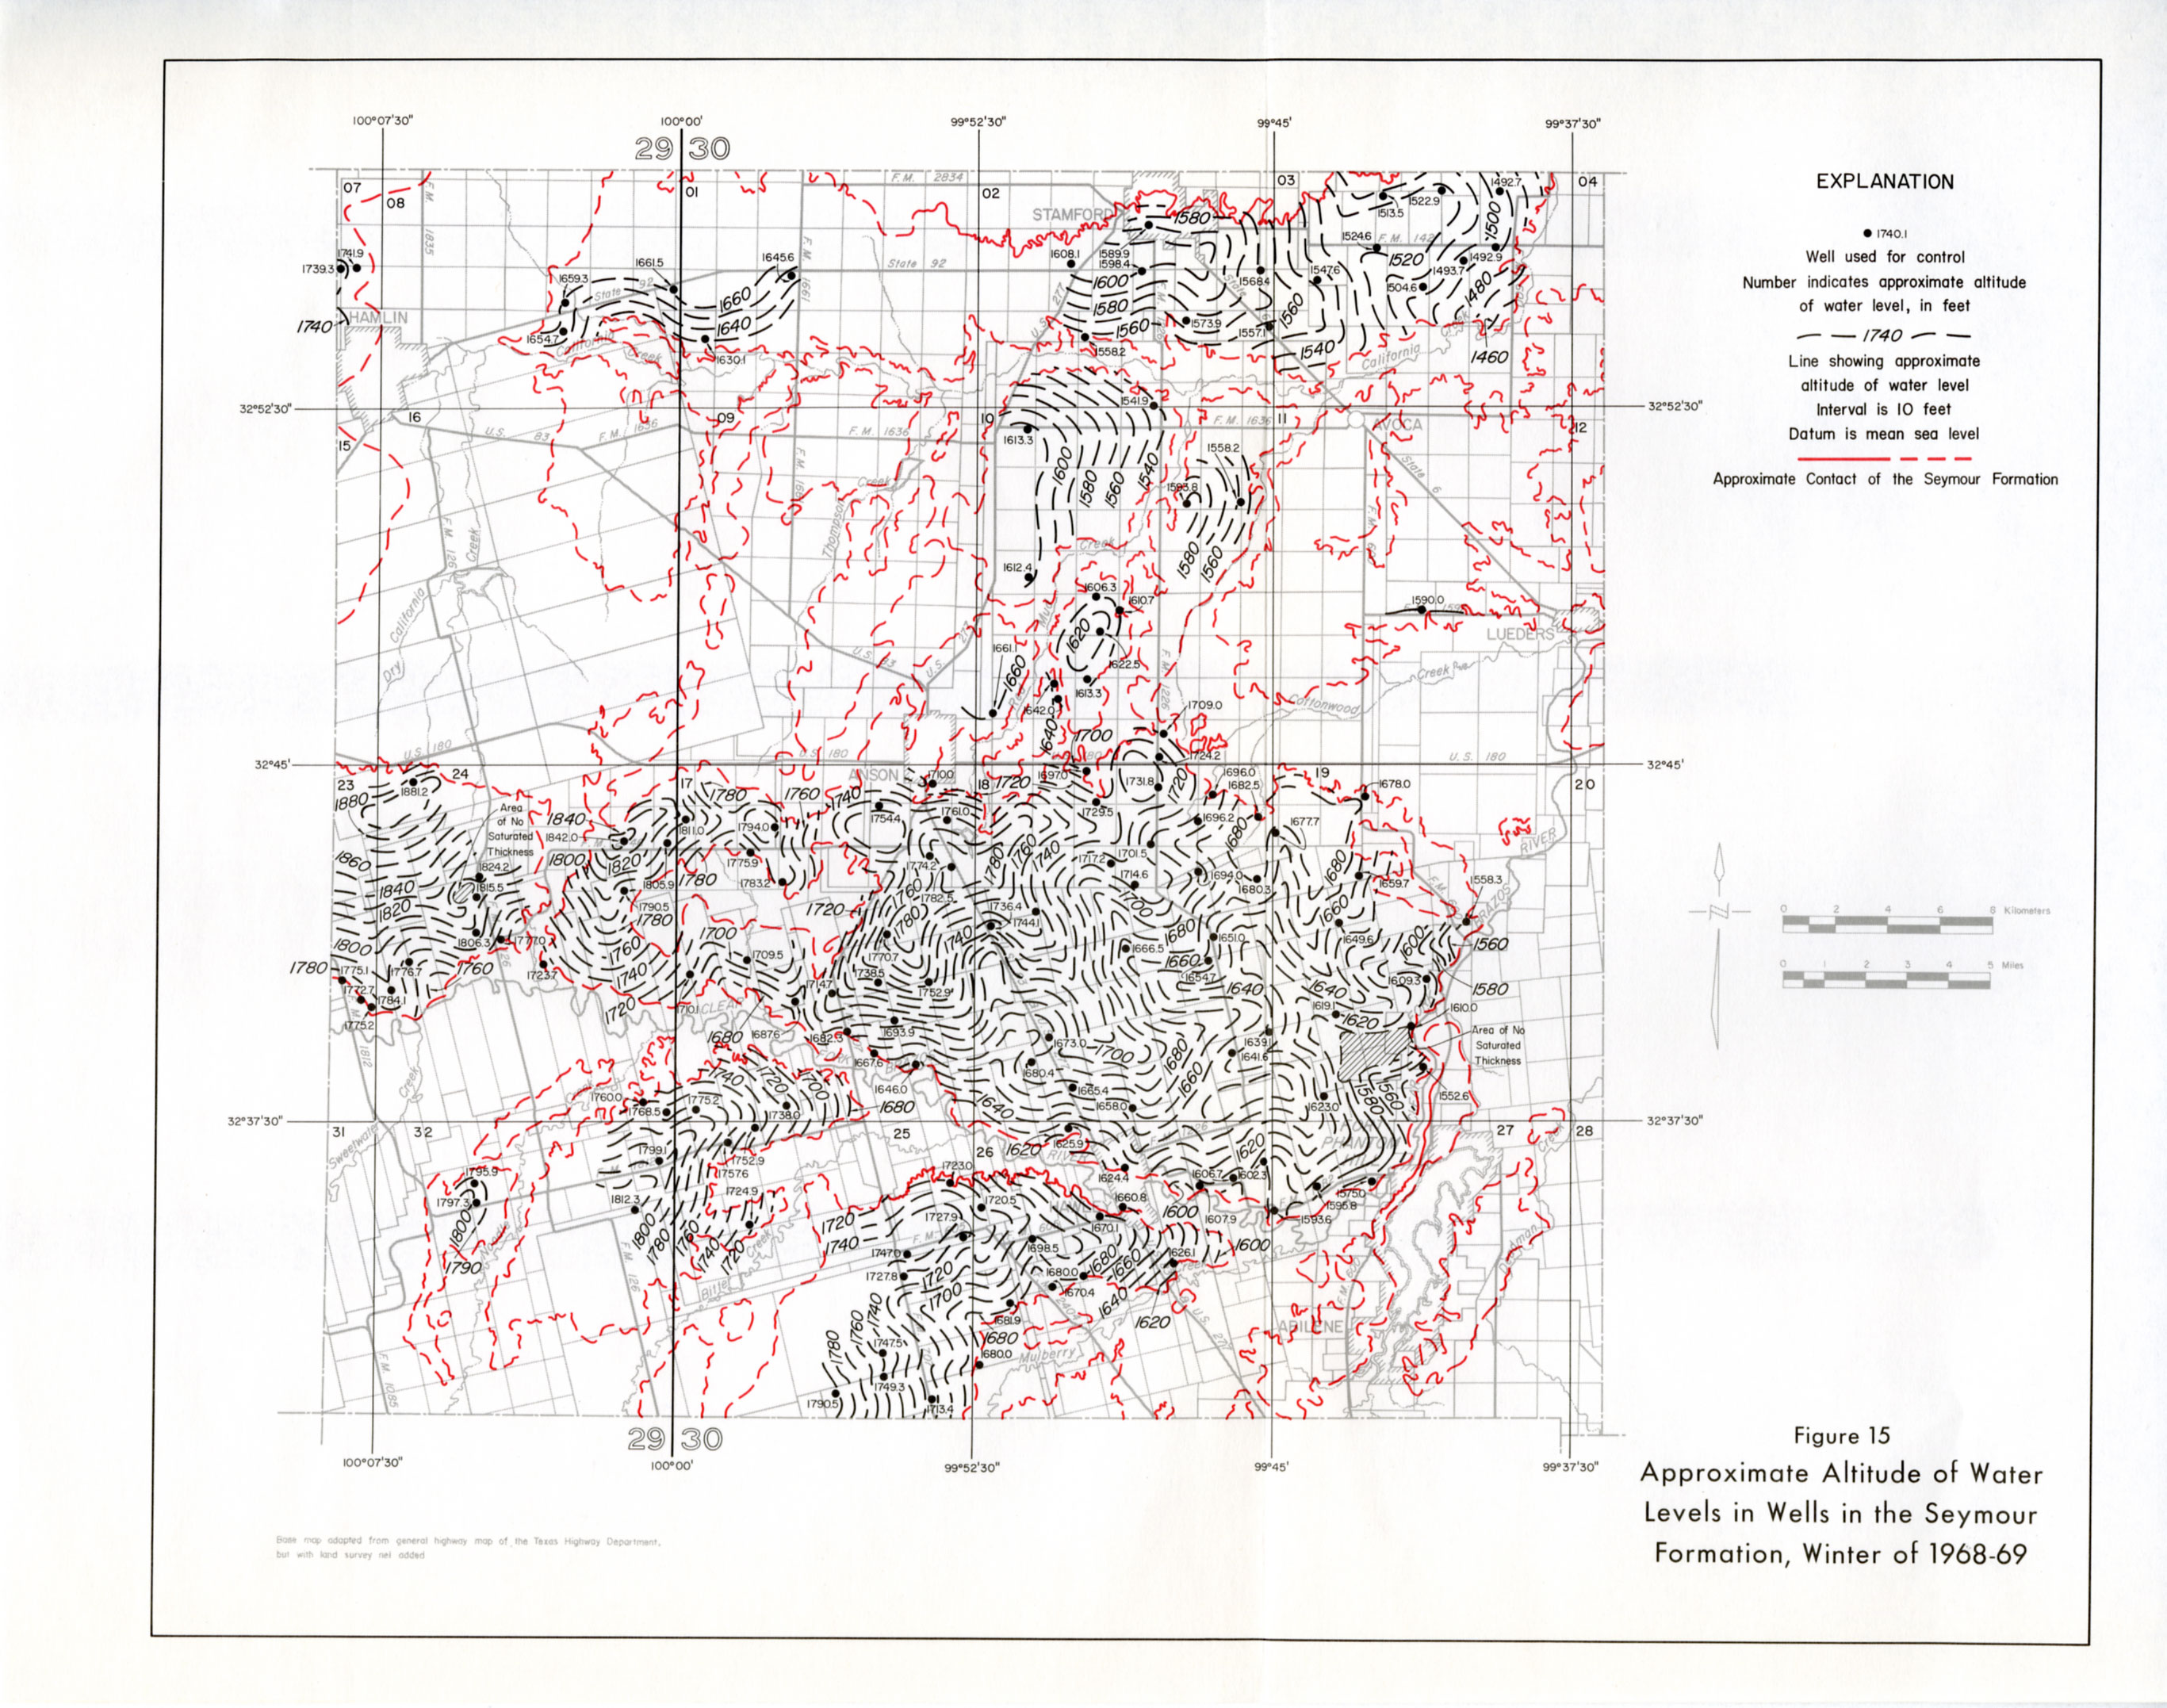
- Figure 15: Approximate Altitude of Water Levels in Wells the Seymour Formation, Winter of 1968-69
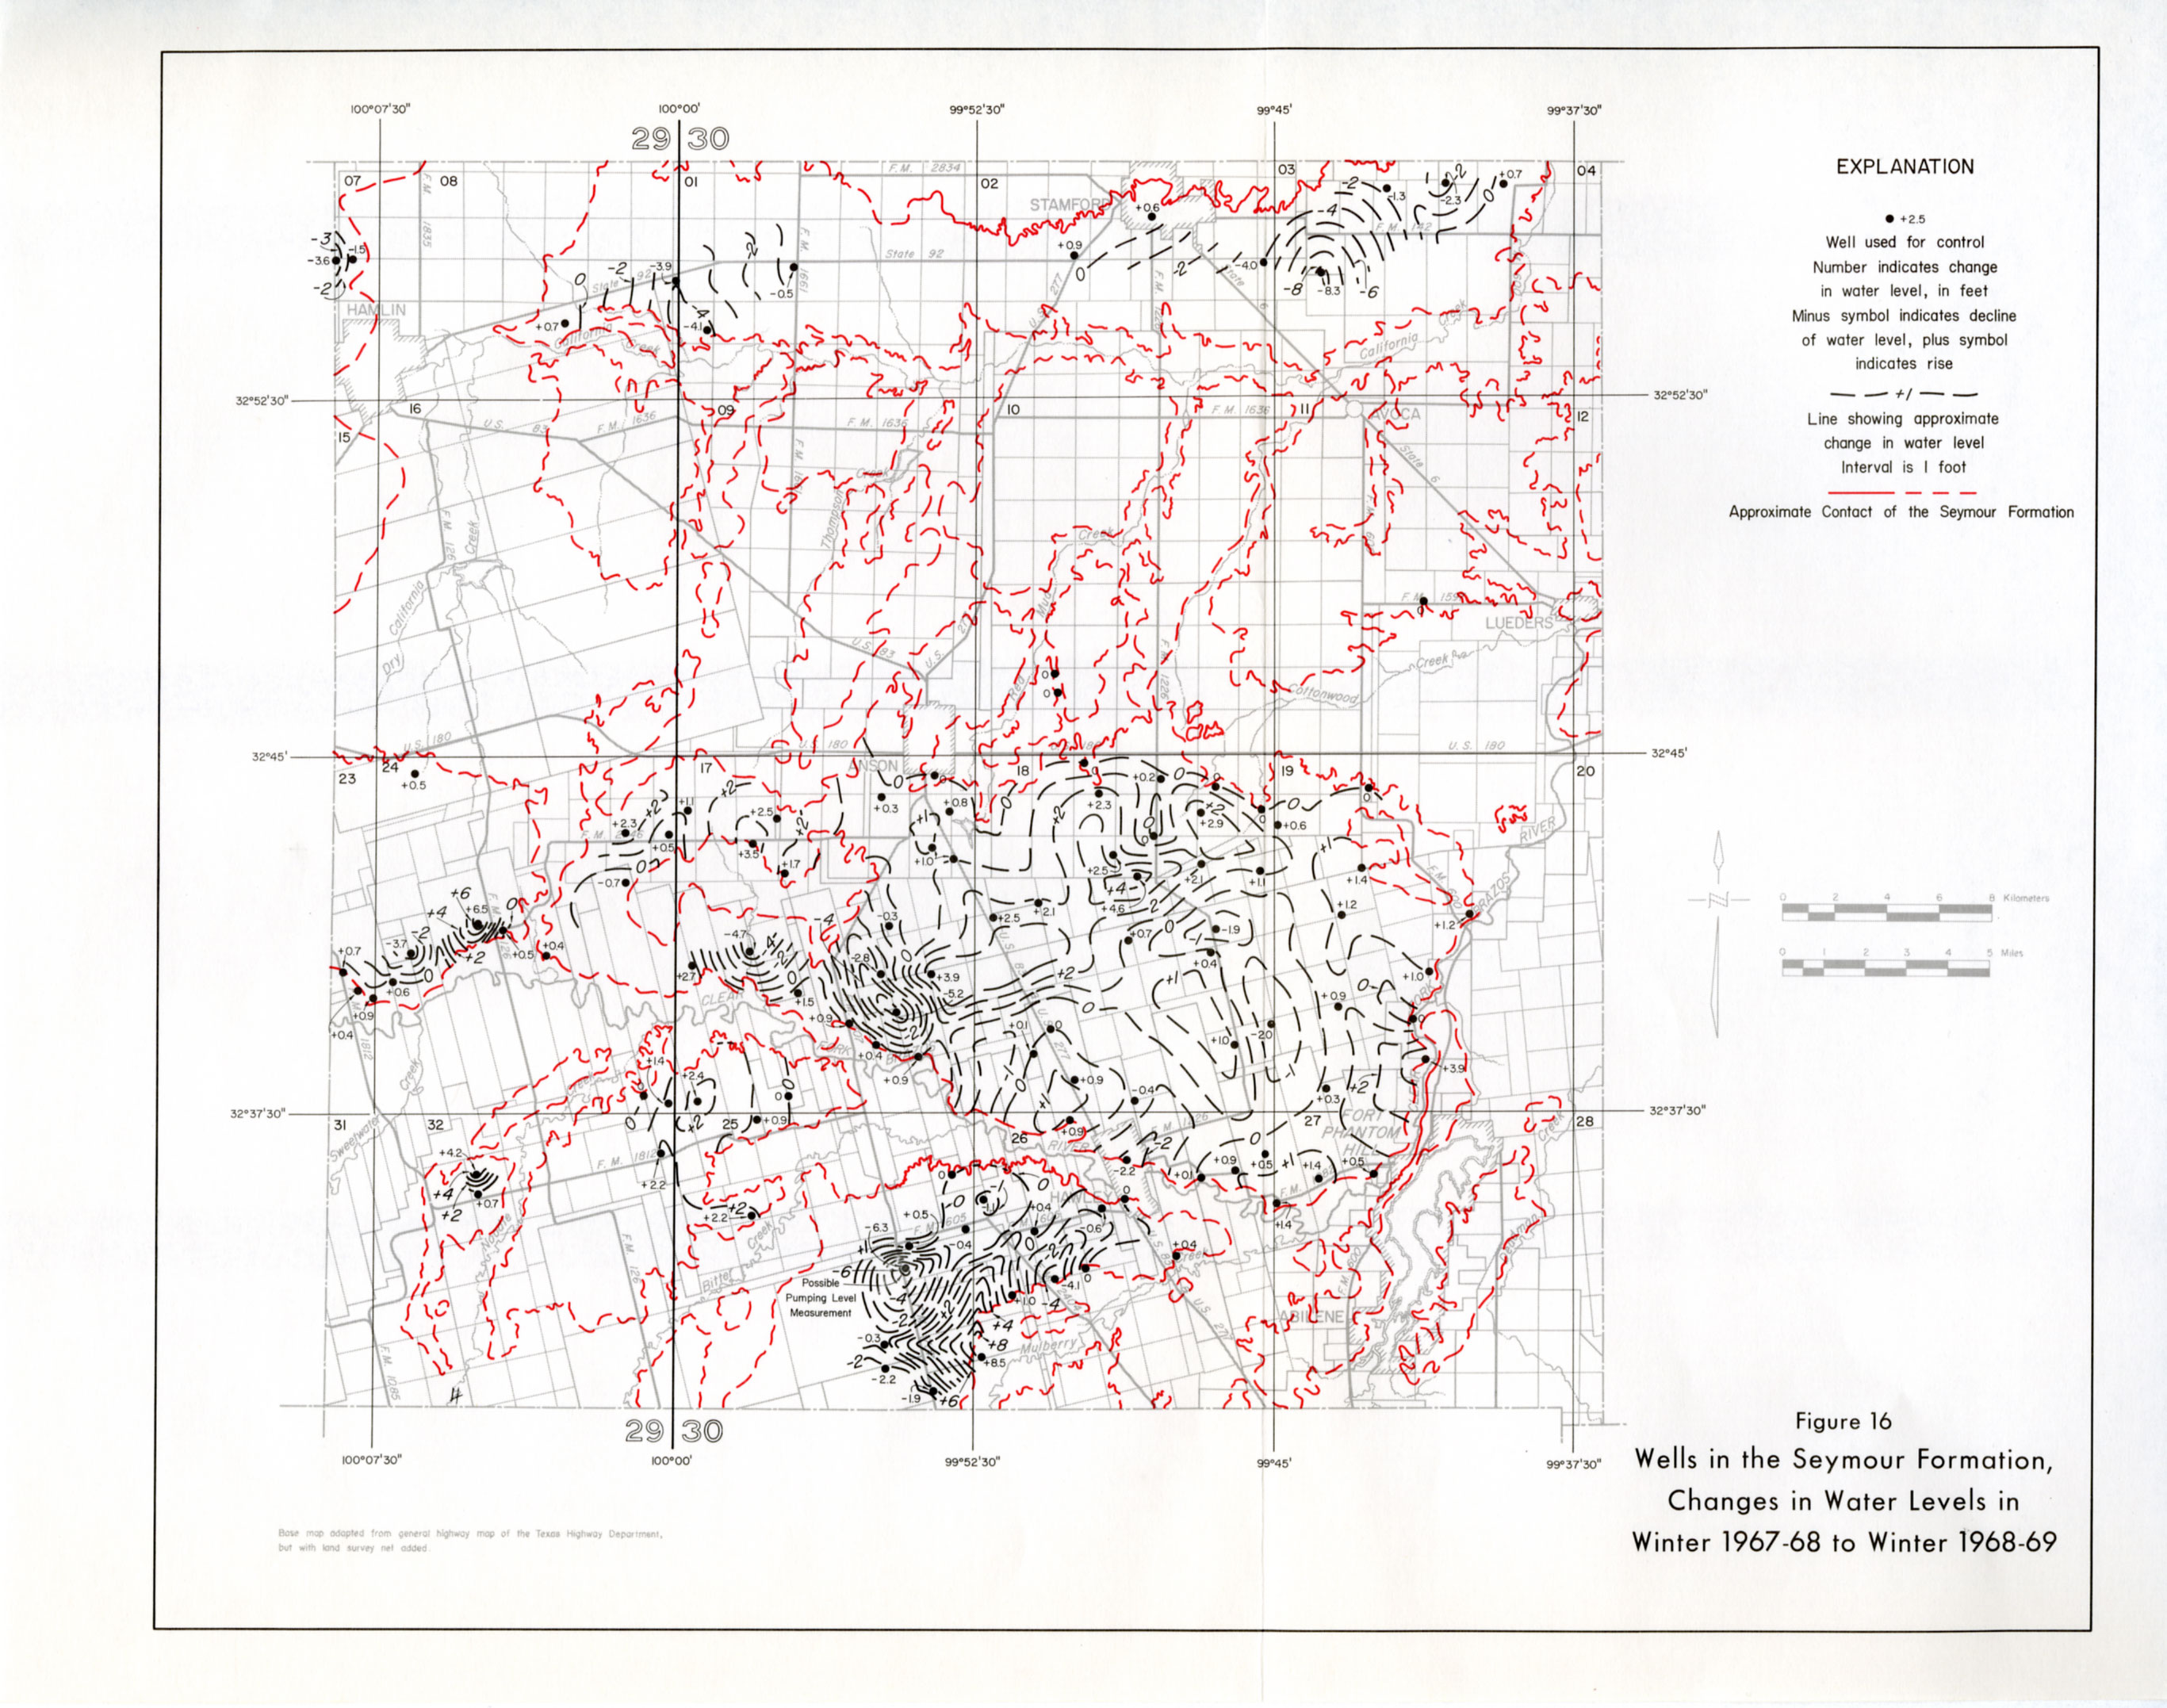
- Figure 16: Wells in the Seymour Formation, Changes in Water Levels in Winter 1967-68 to Winter 1968-69
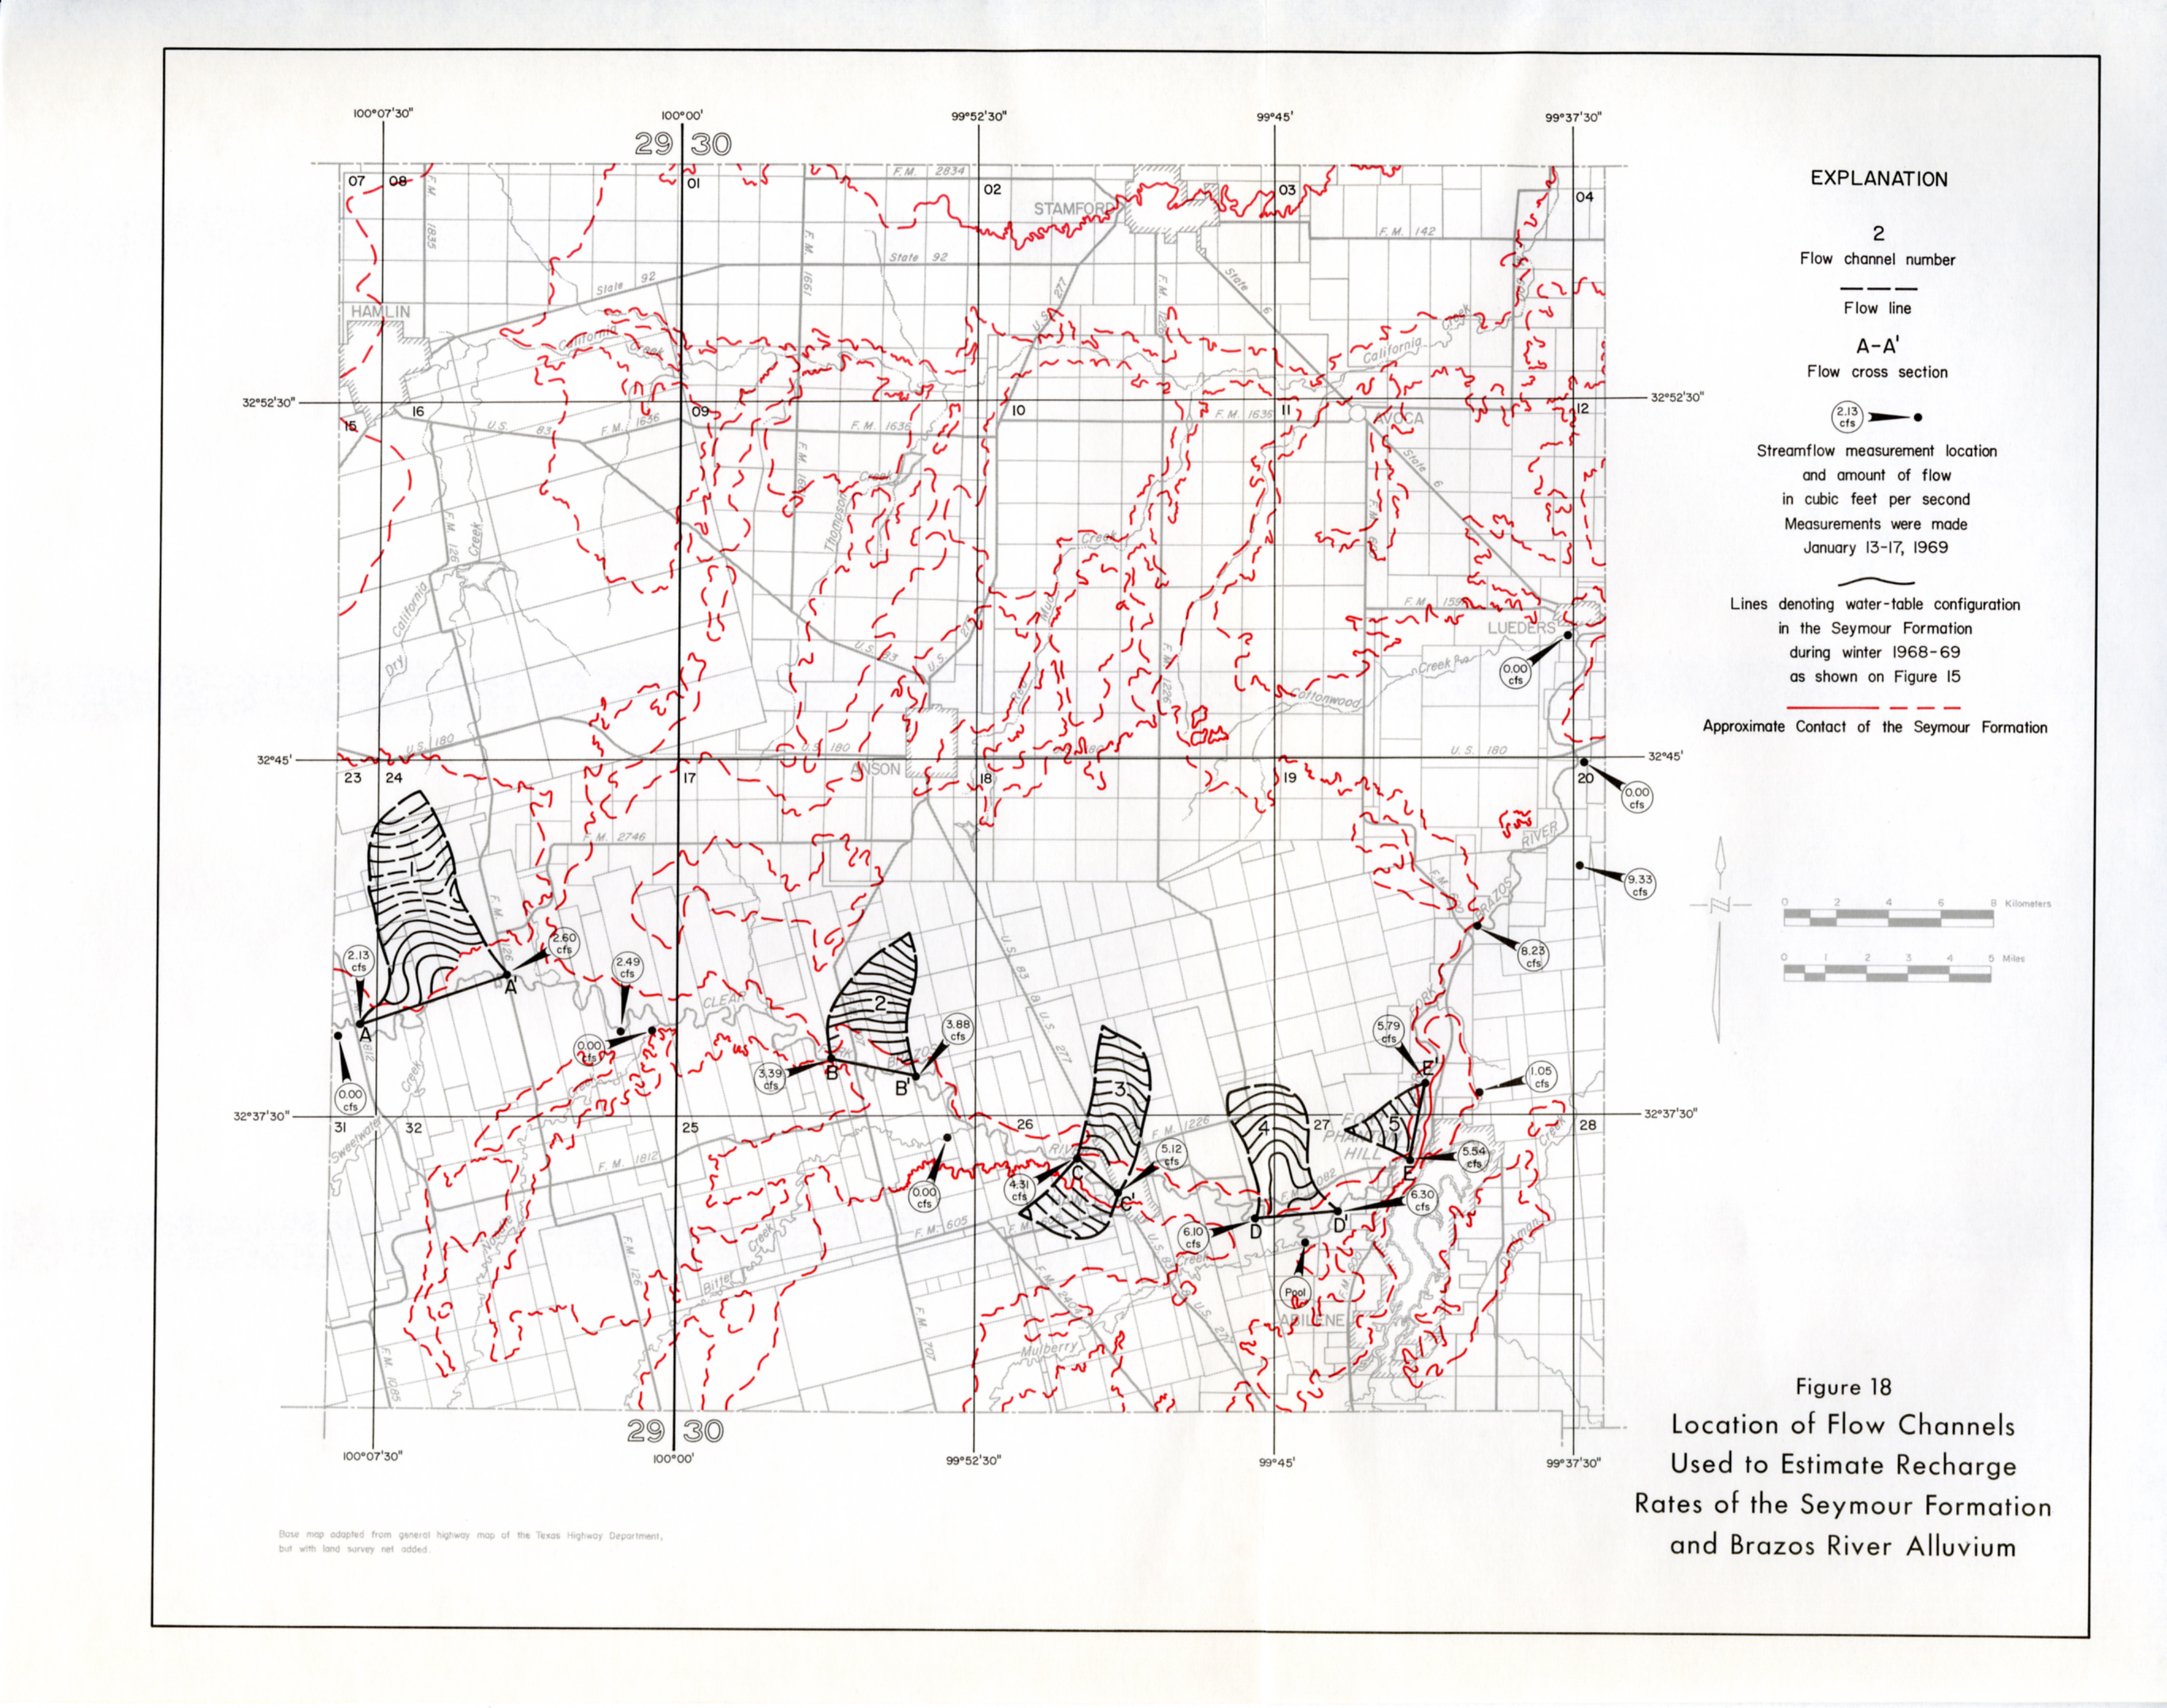
- Figure 18: Location of Flow Channels Used to Estimate Recharge Rates of the Seymour Formation and Brazos River Alluvium
- Figure 19: Concentrations of Selected Chemical Constituents in Water From Selected wells in the Seymour Formation and Recent Alluvium
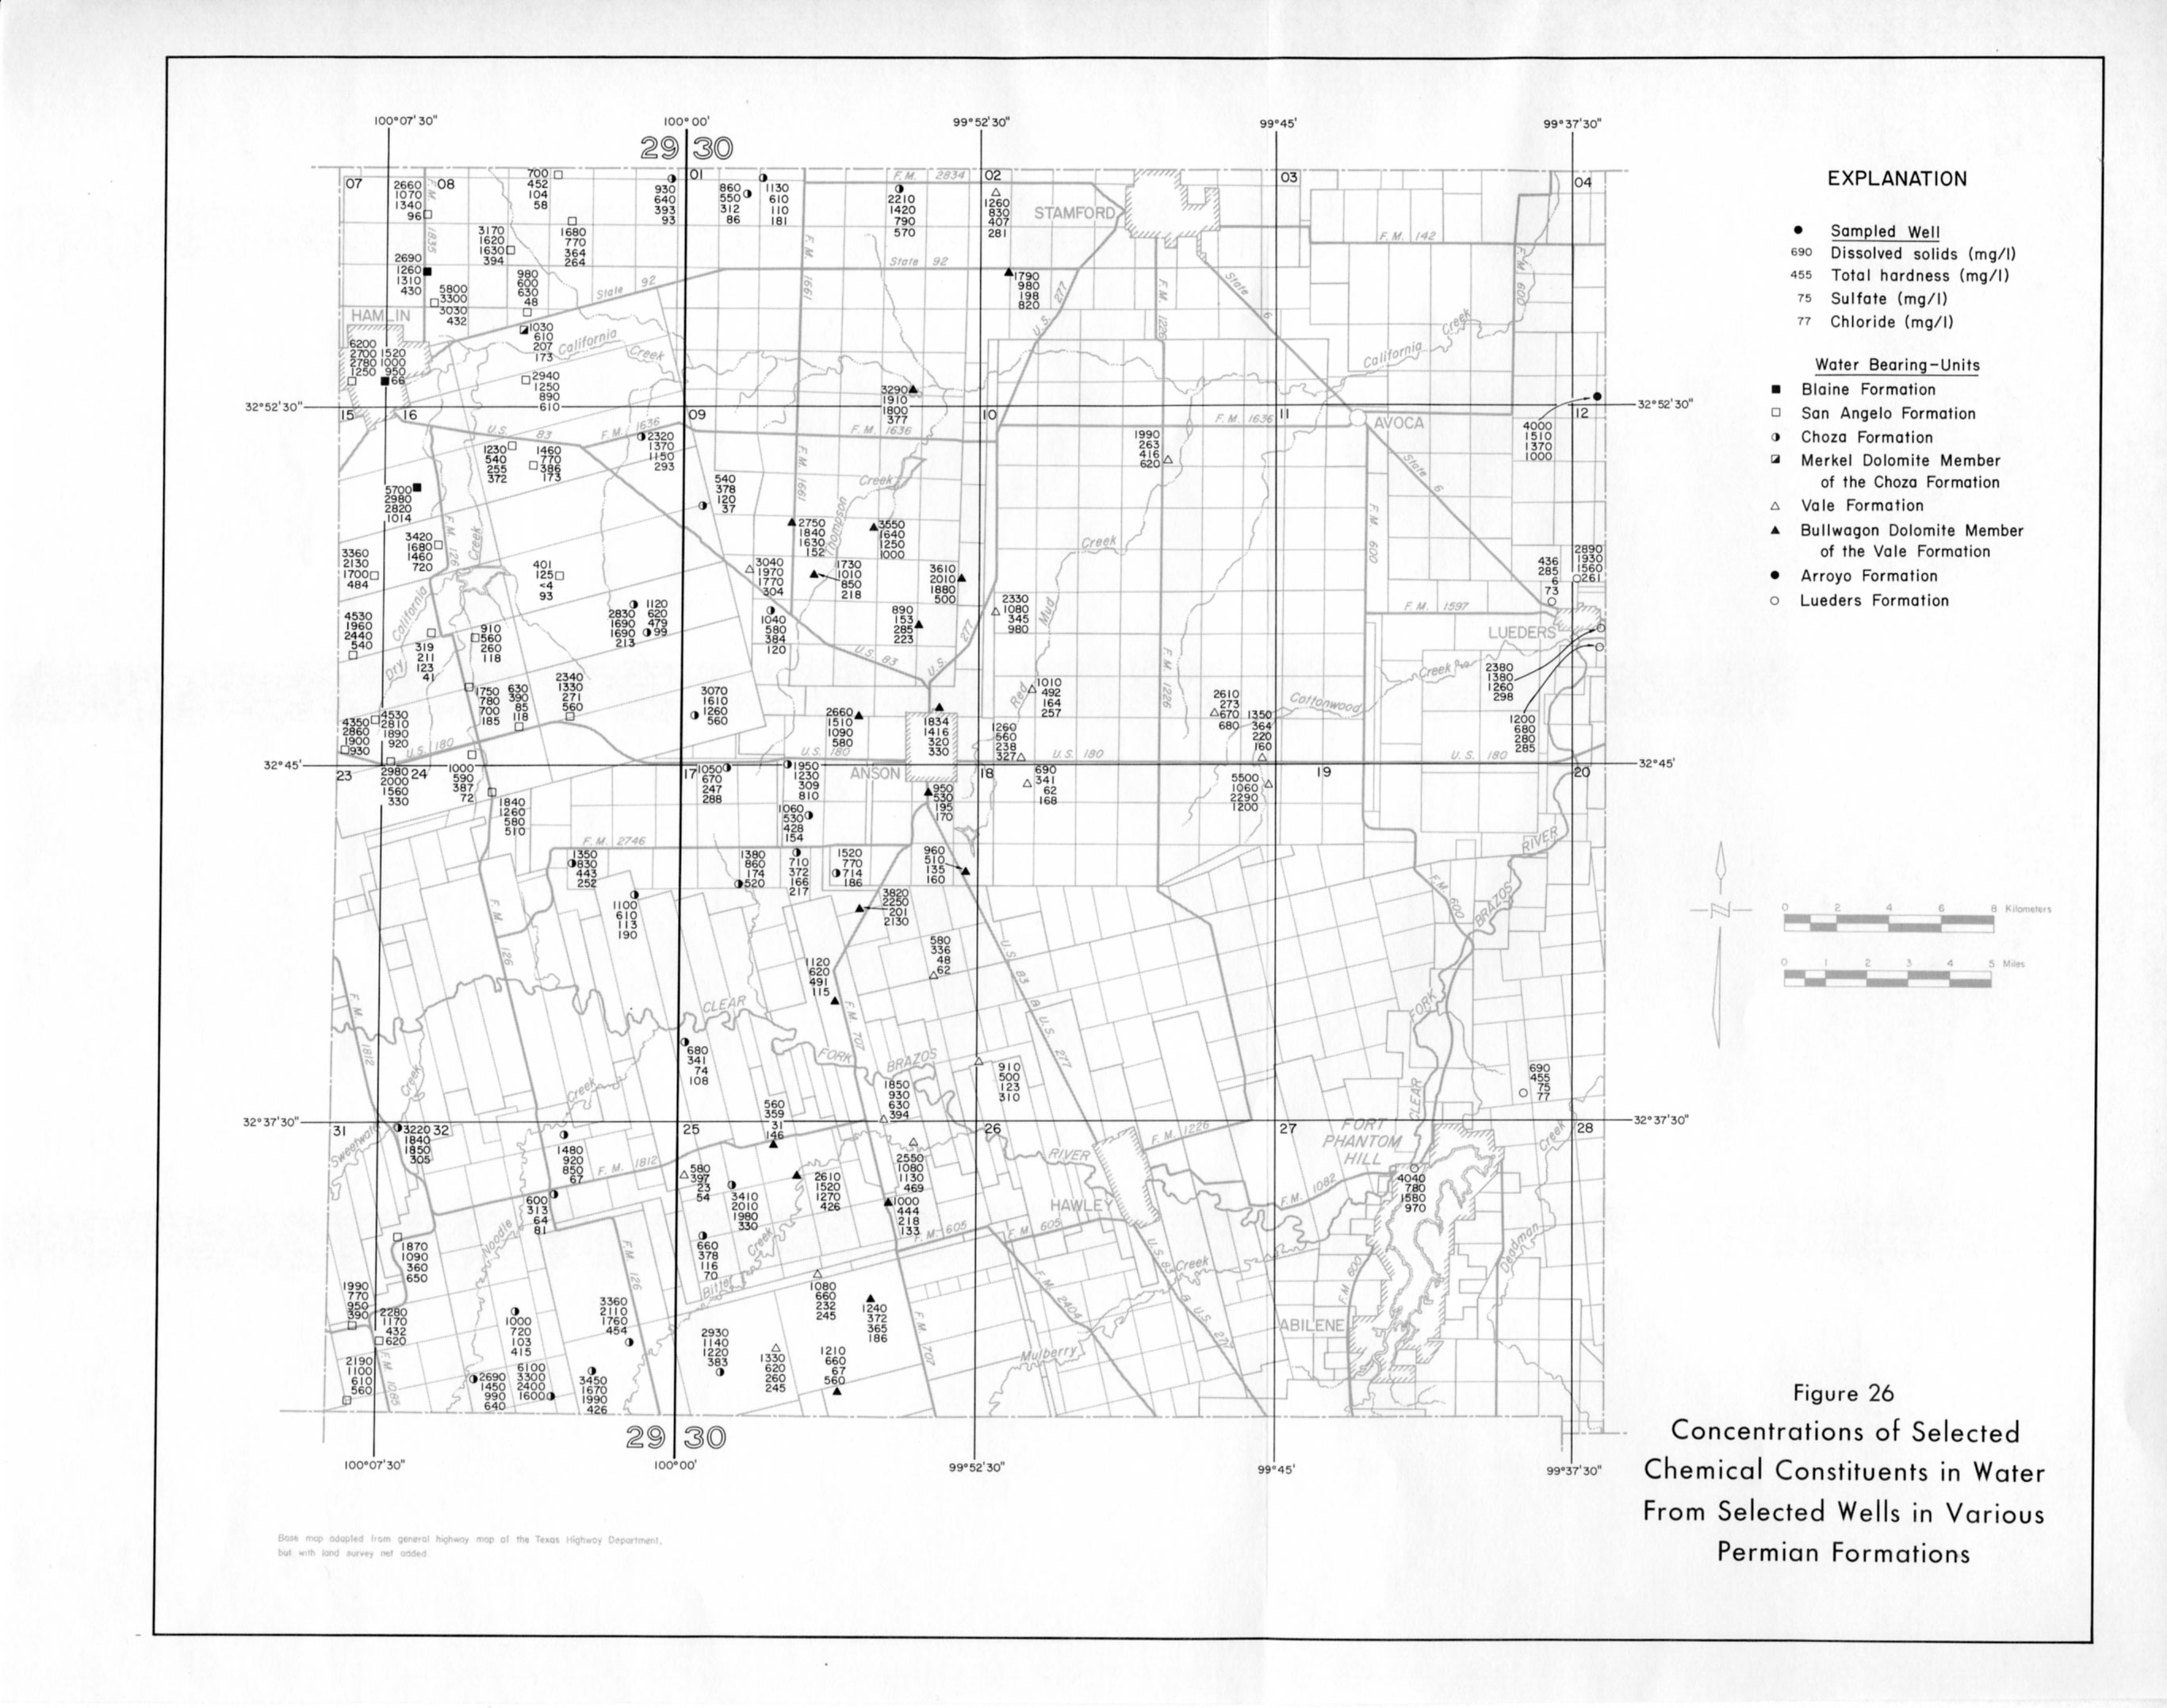
- Figure 26: Concentrations of Selected Chemical Constituents in Water From Selected wells in Various Permian Formations
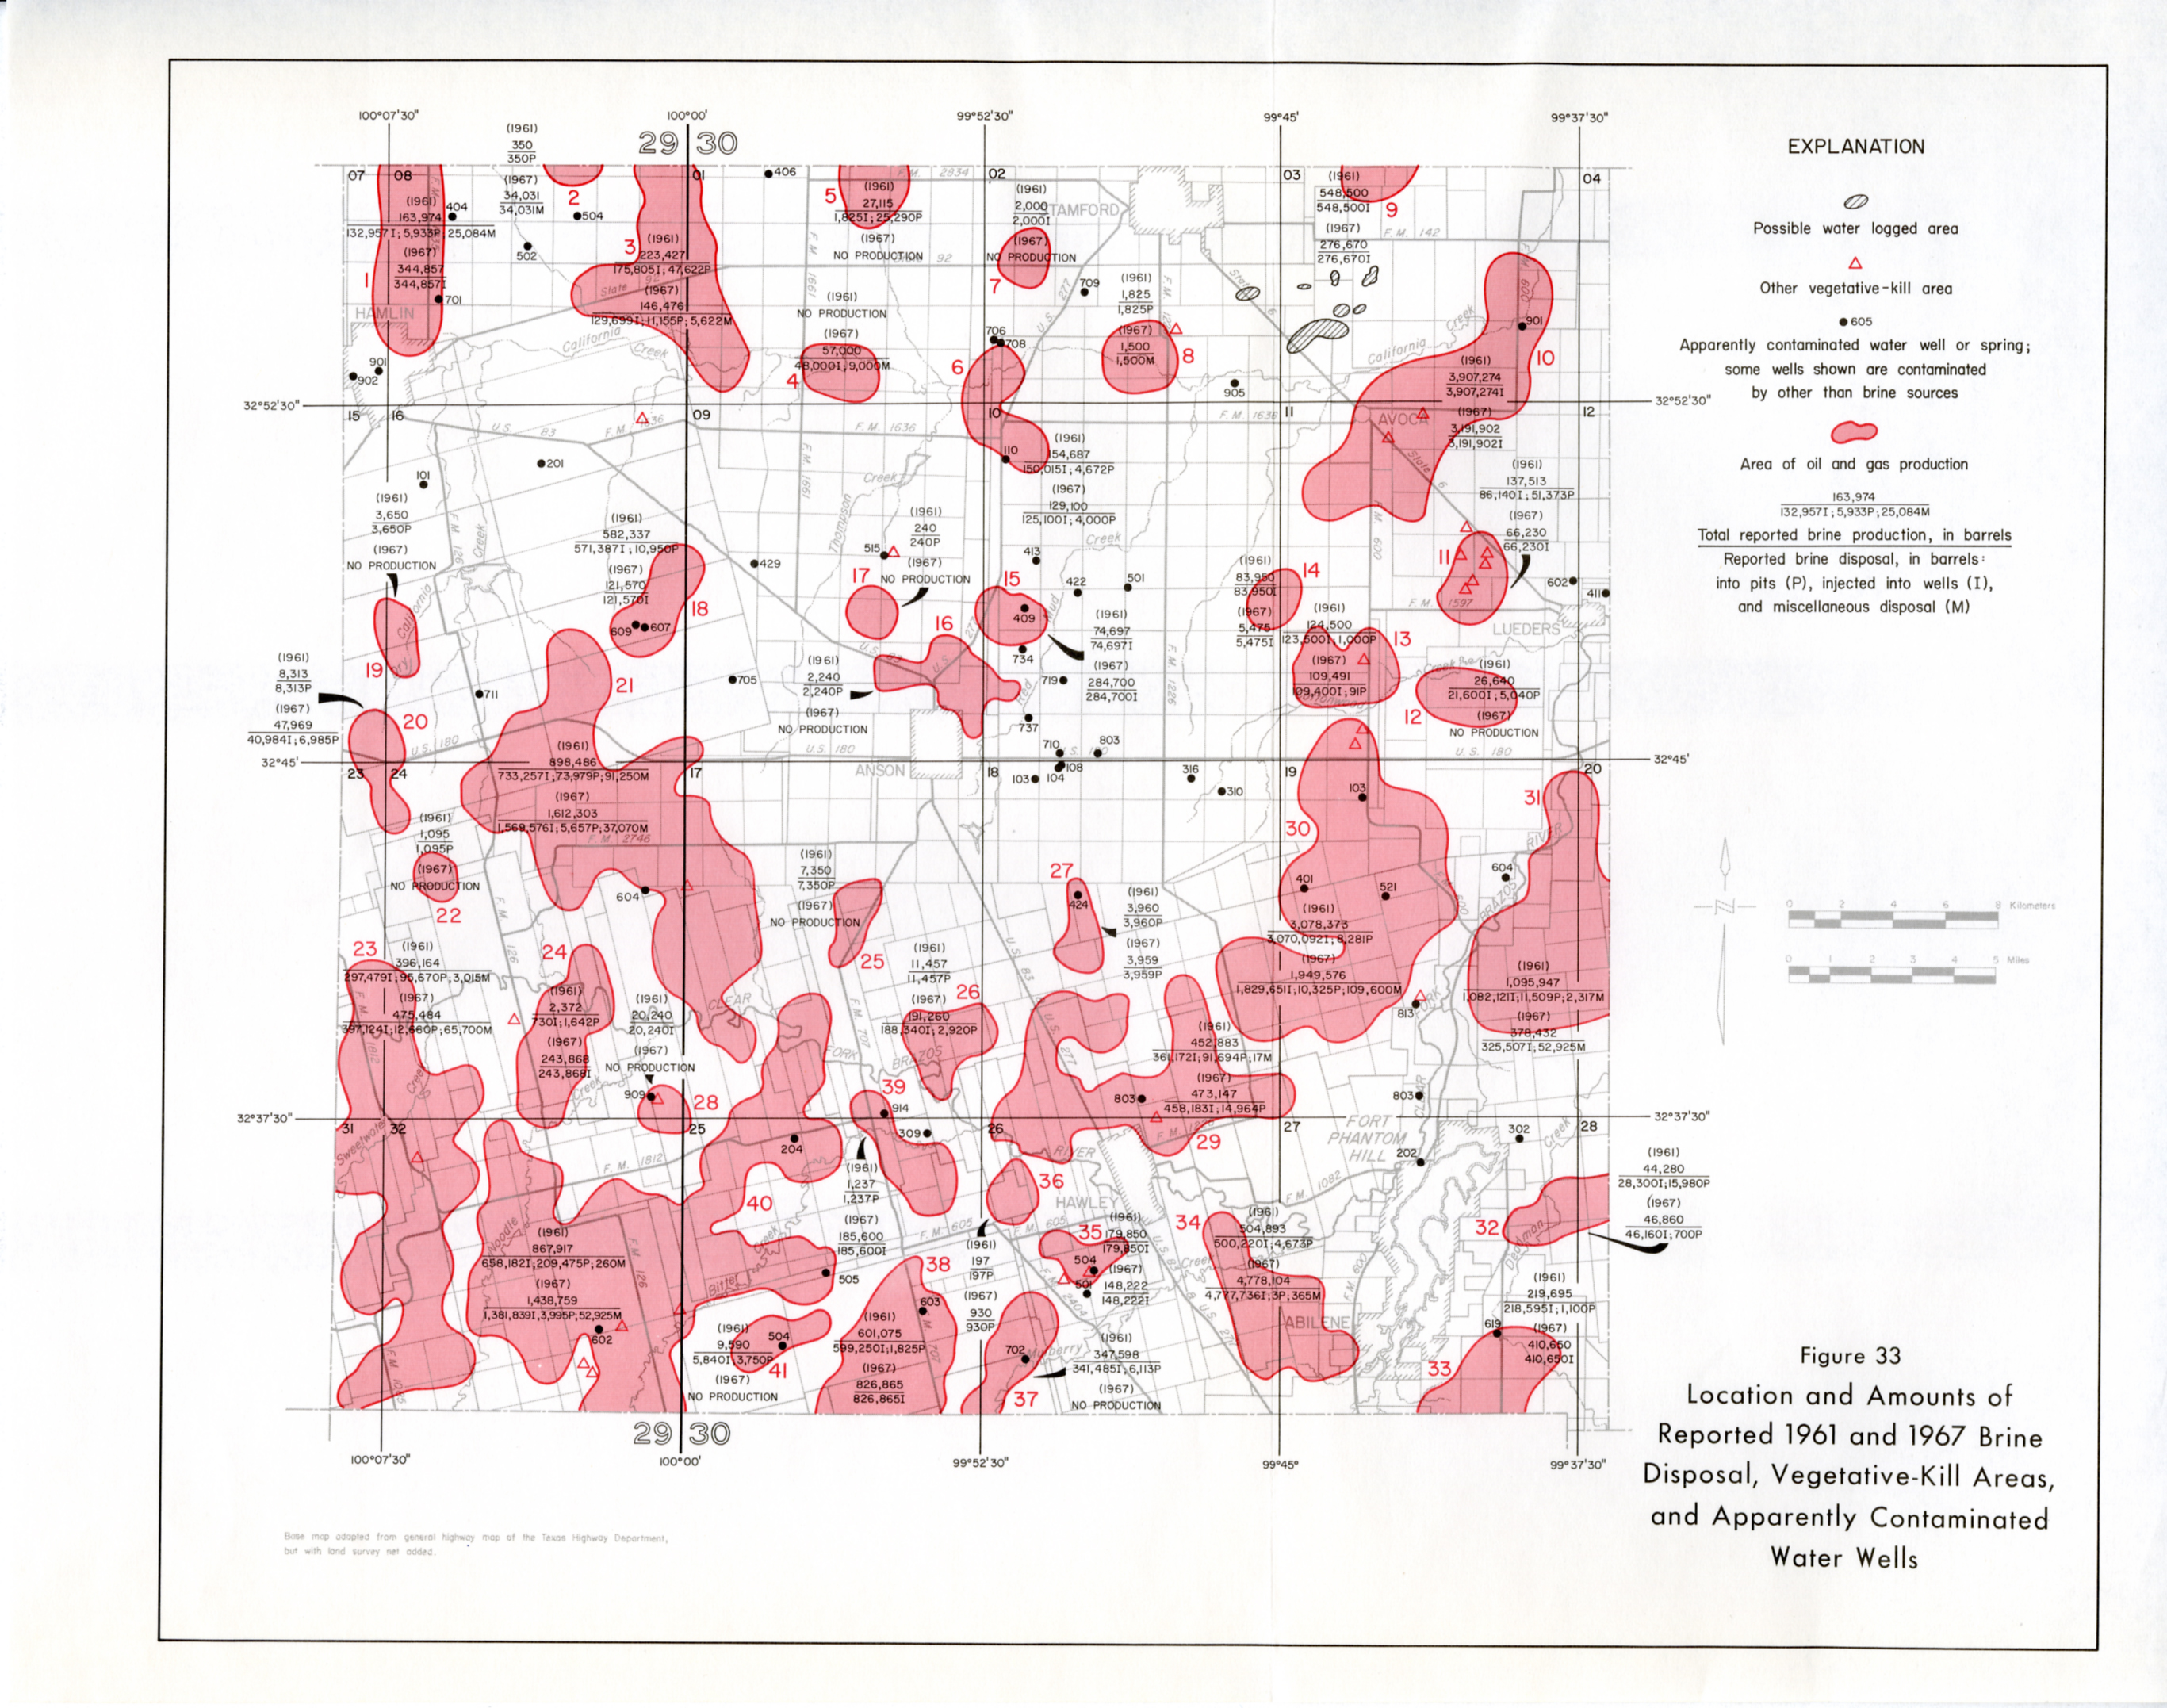
- Figure 33: Location and Amounts of Reported 1961 and 1967 Brine Disposal, Vegetative-Kill Areas, and Apparently Contaminated Water Wells
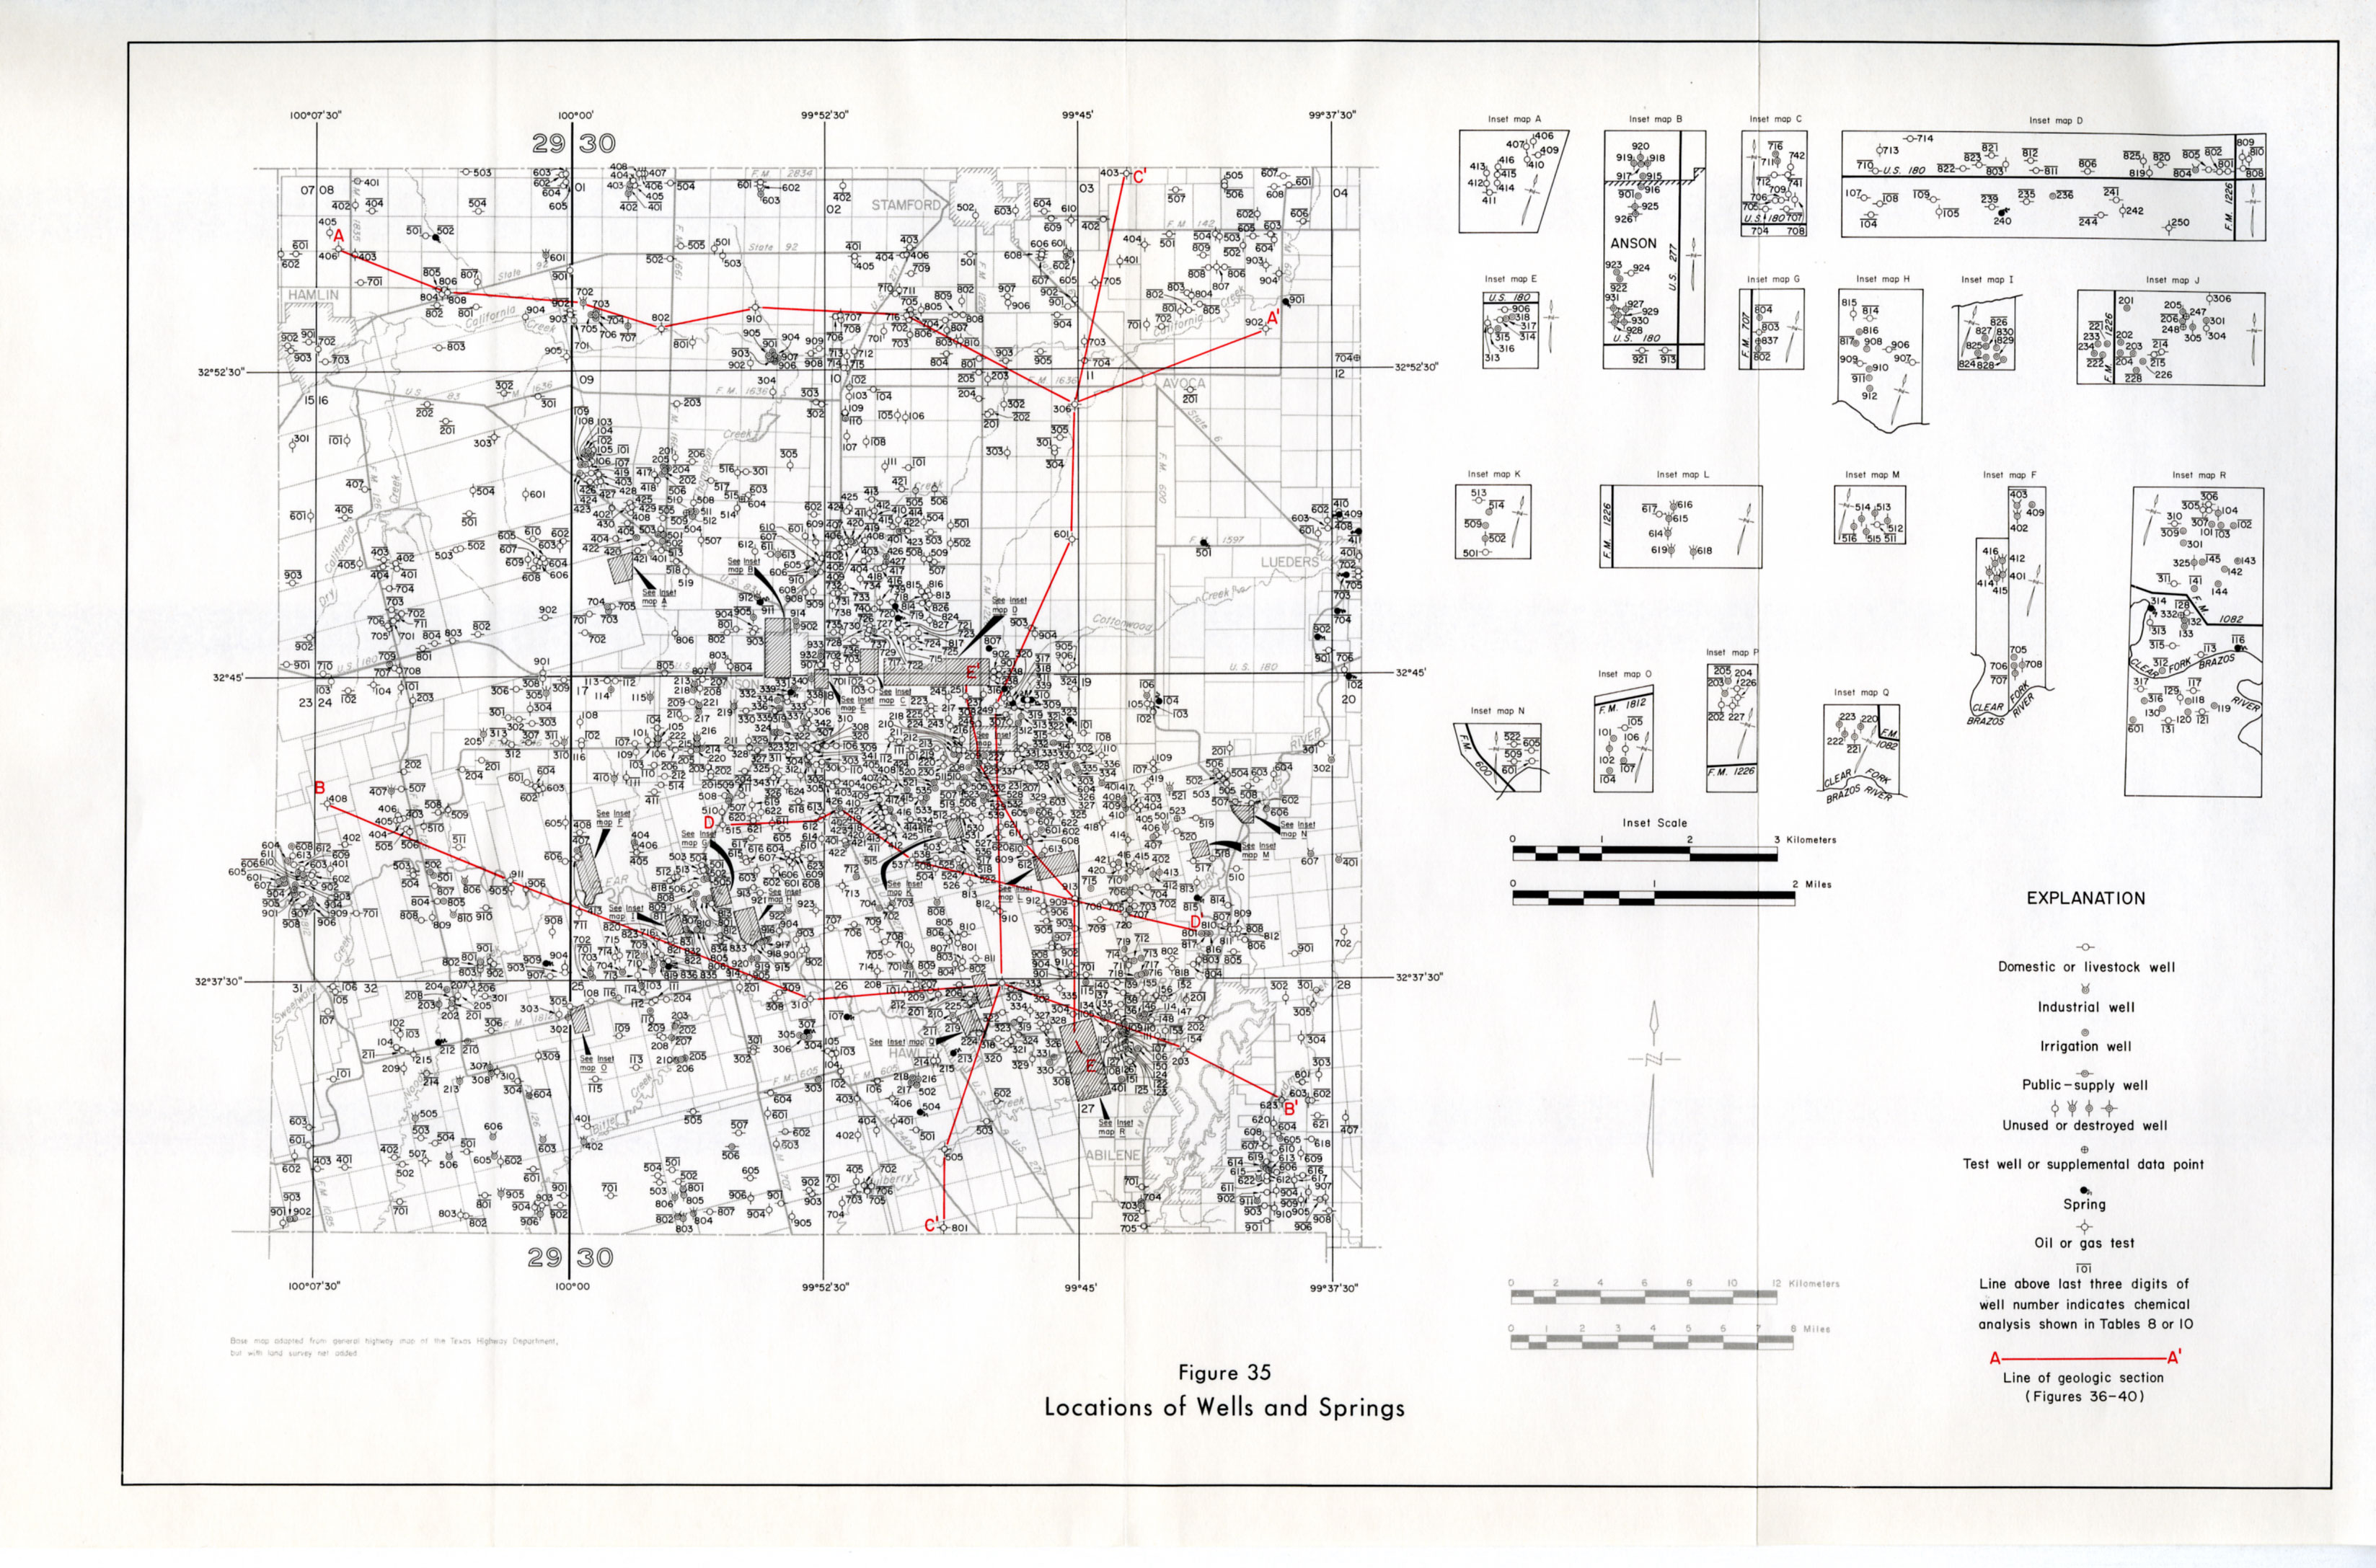
- Figure 35: Locations of Wells and Springs
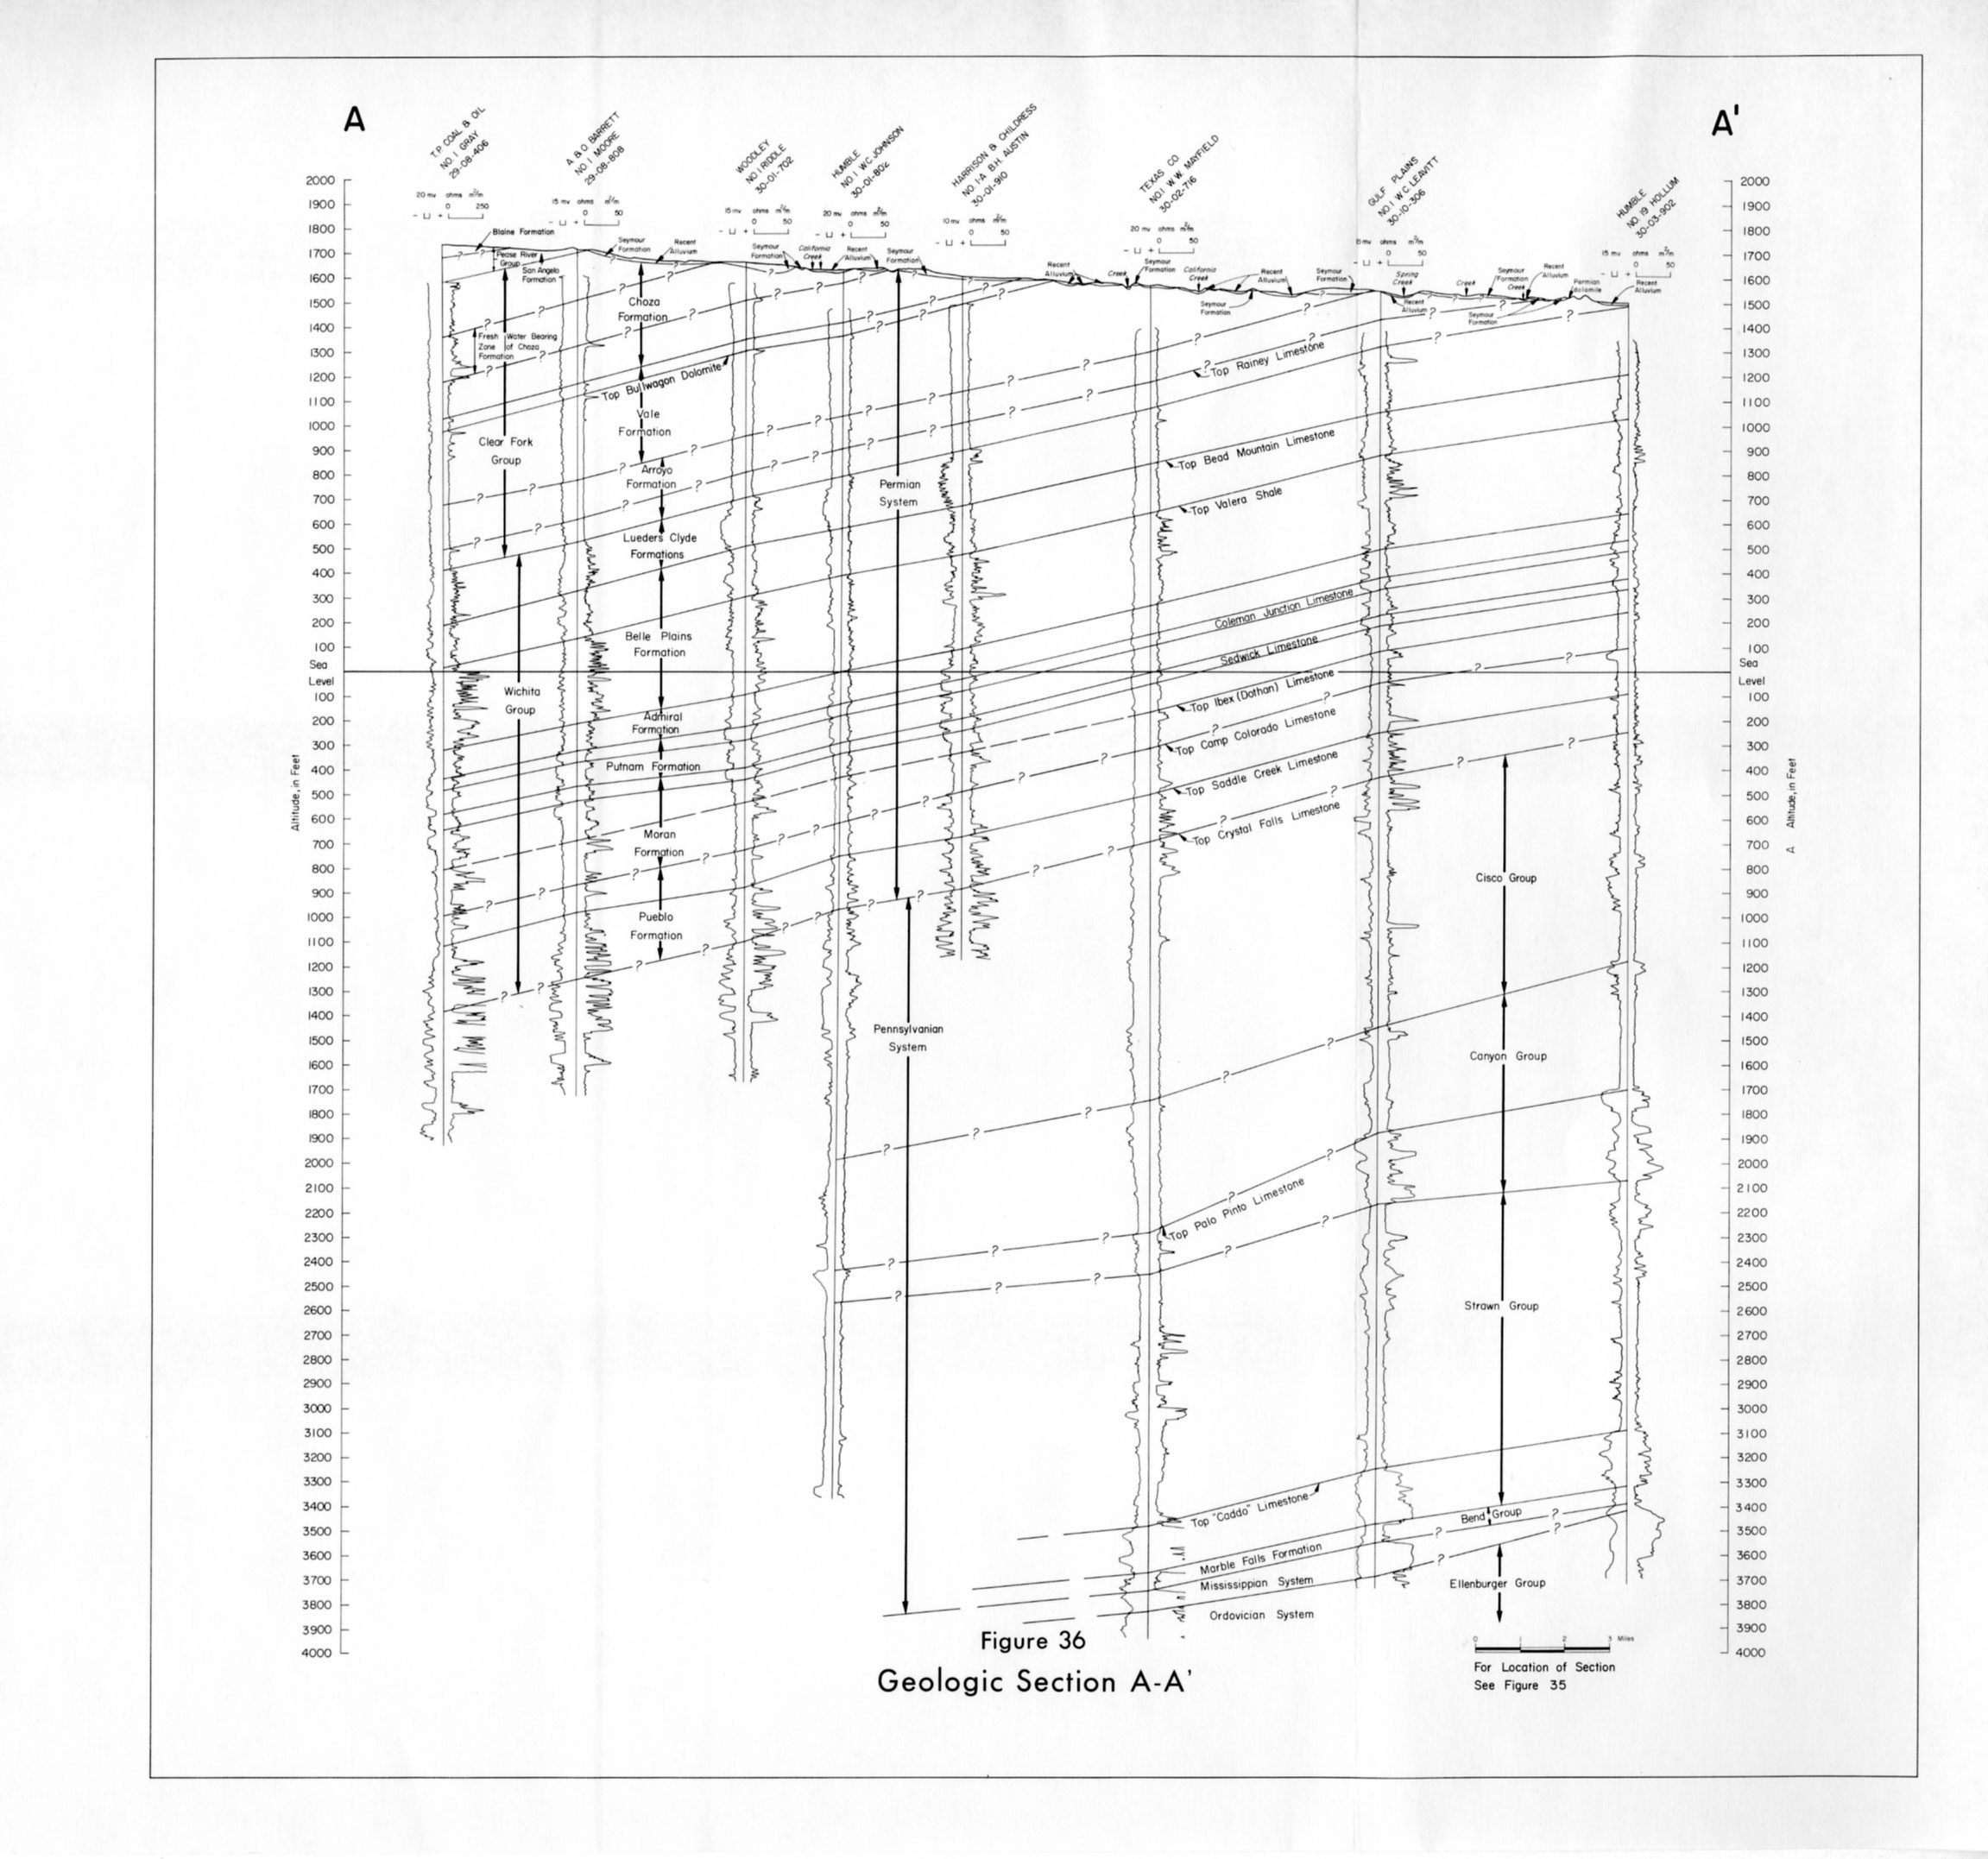
- Figure 36: Geologic Section A-A'
- Figure 37: Geologic Section B-B'
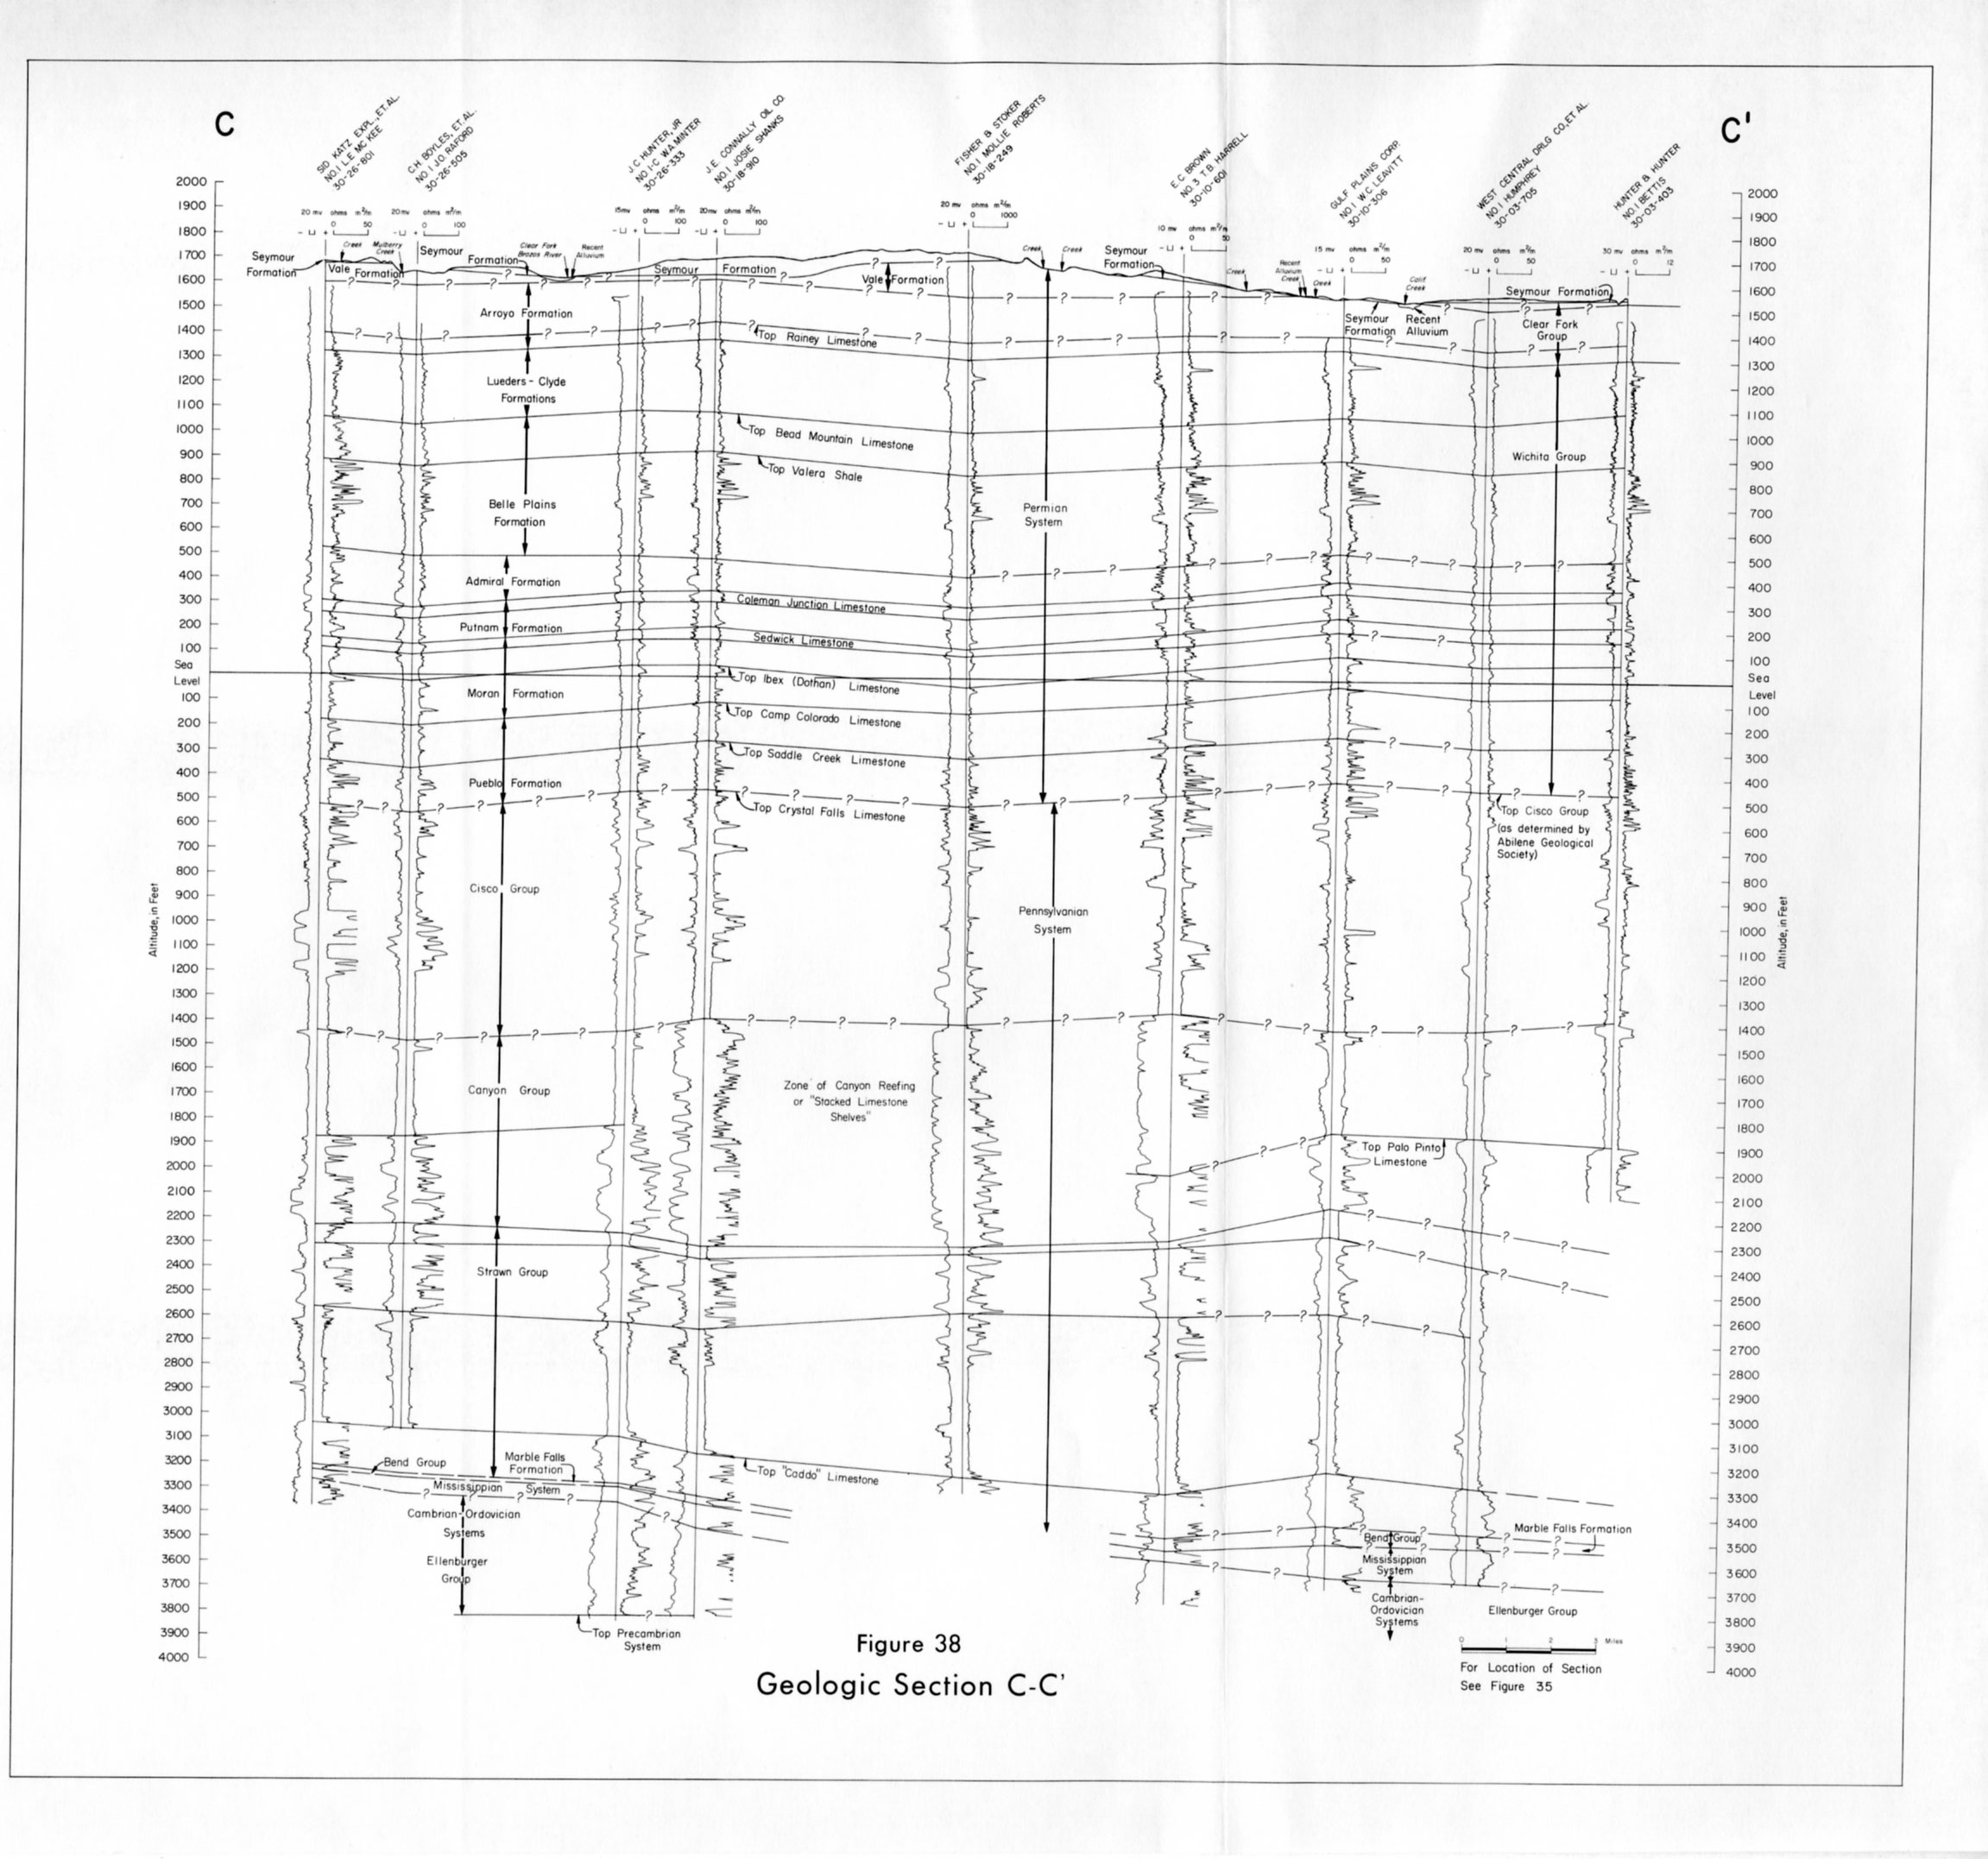
- Figure 38: Geologic Section C-C'
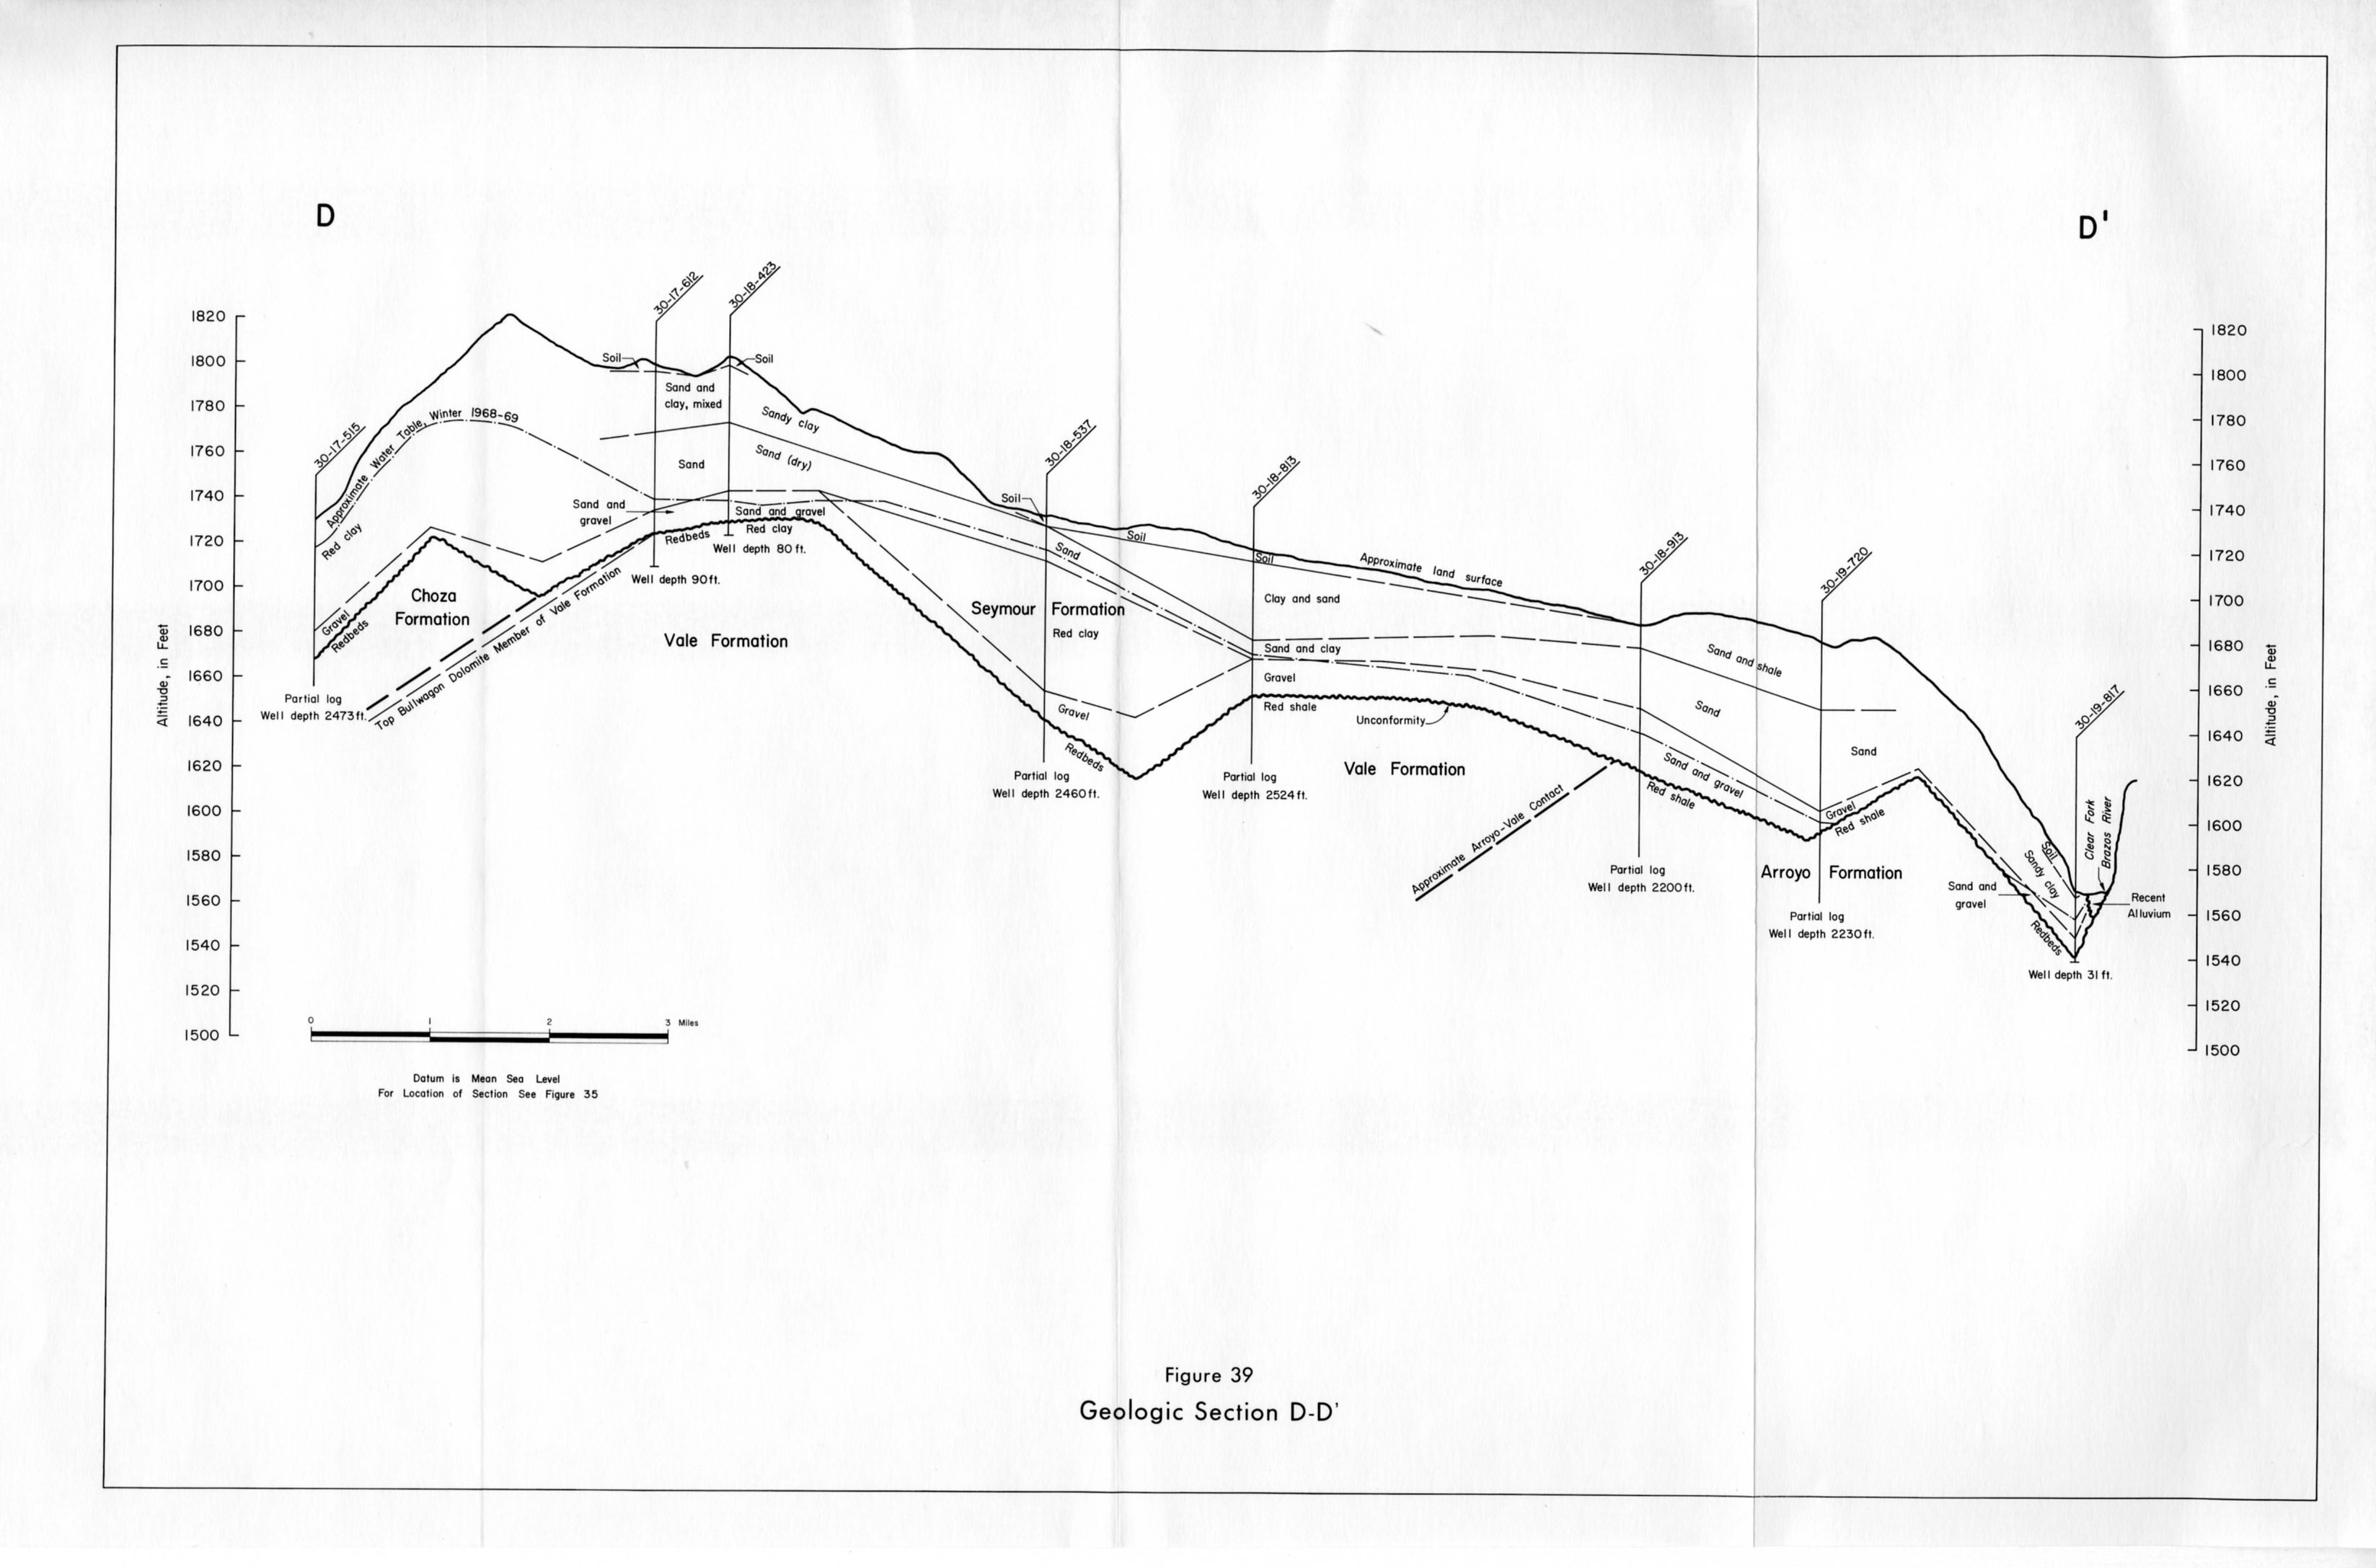
- Figure 39: Geologic Section D-D'
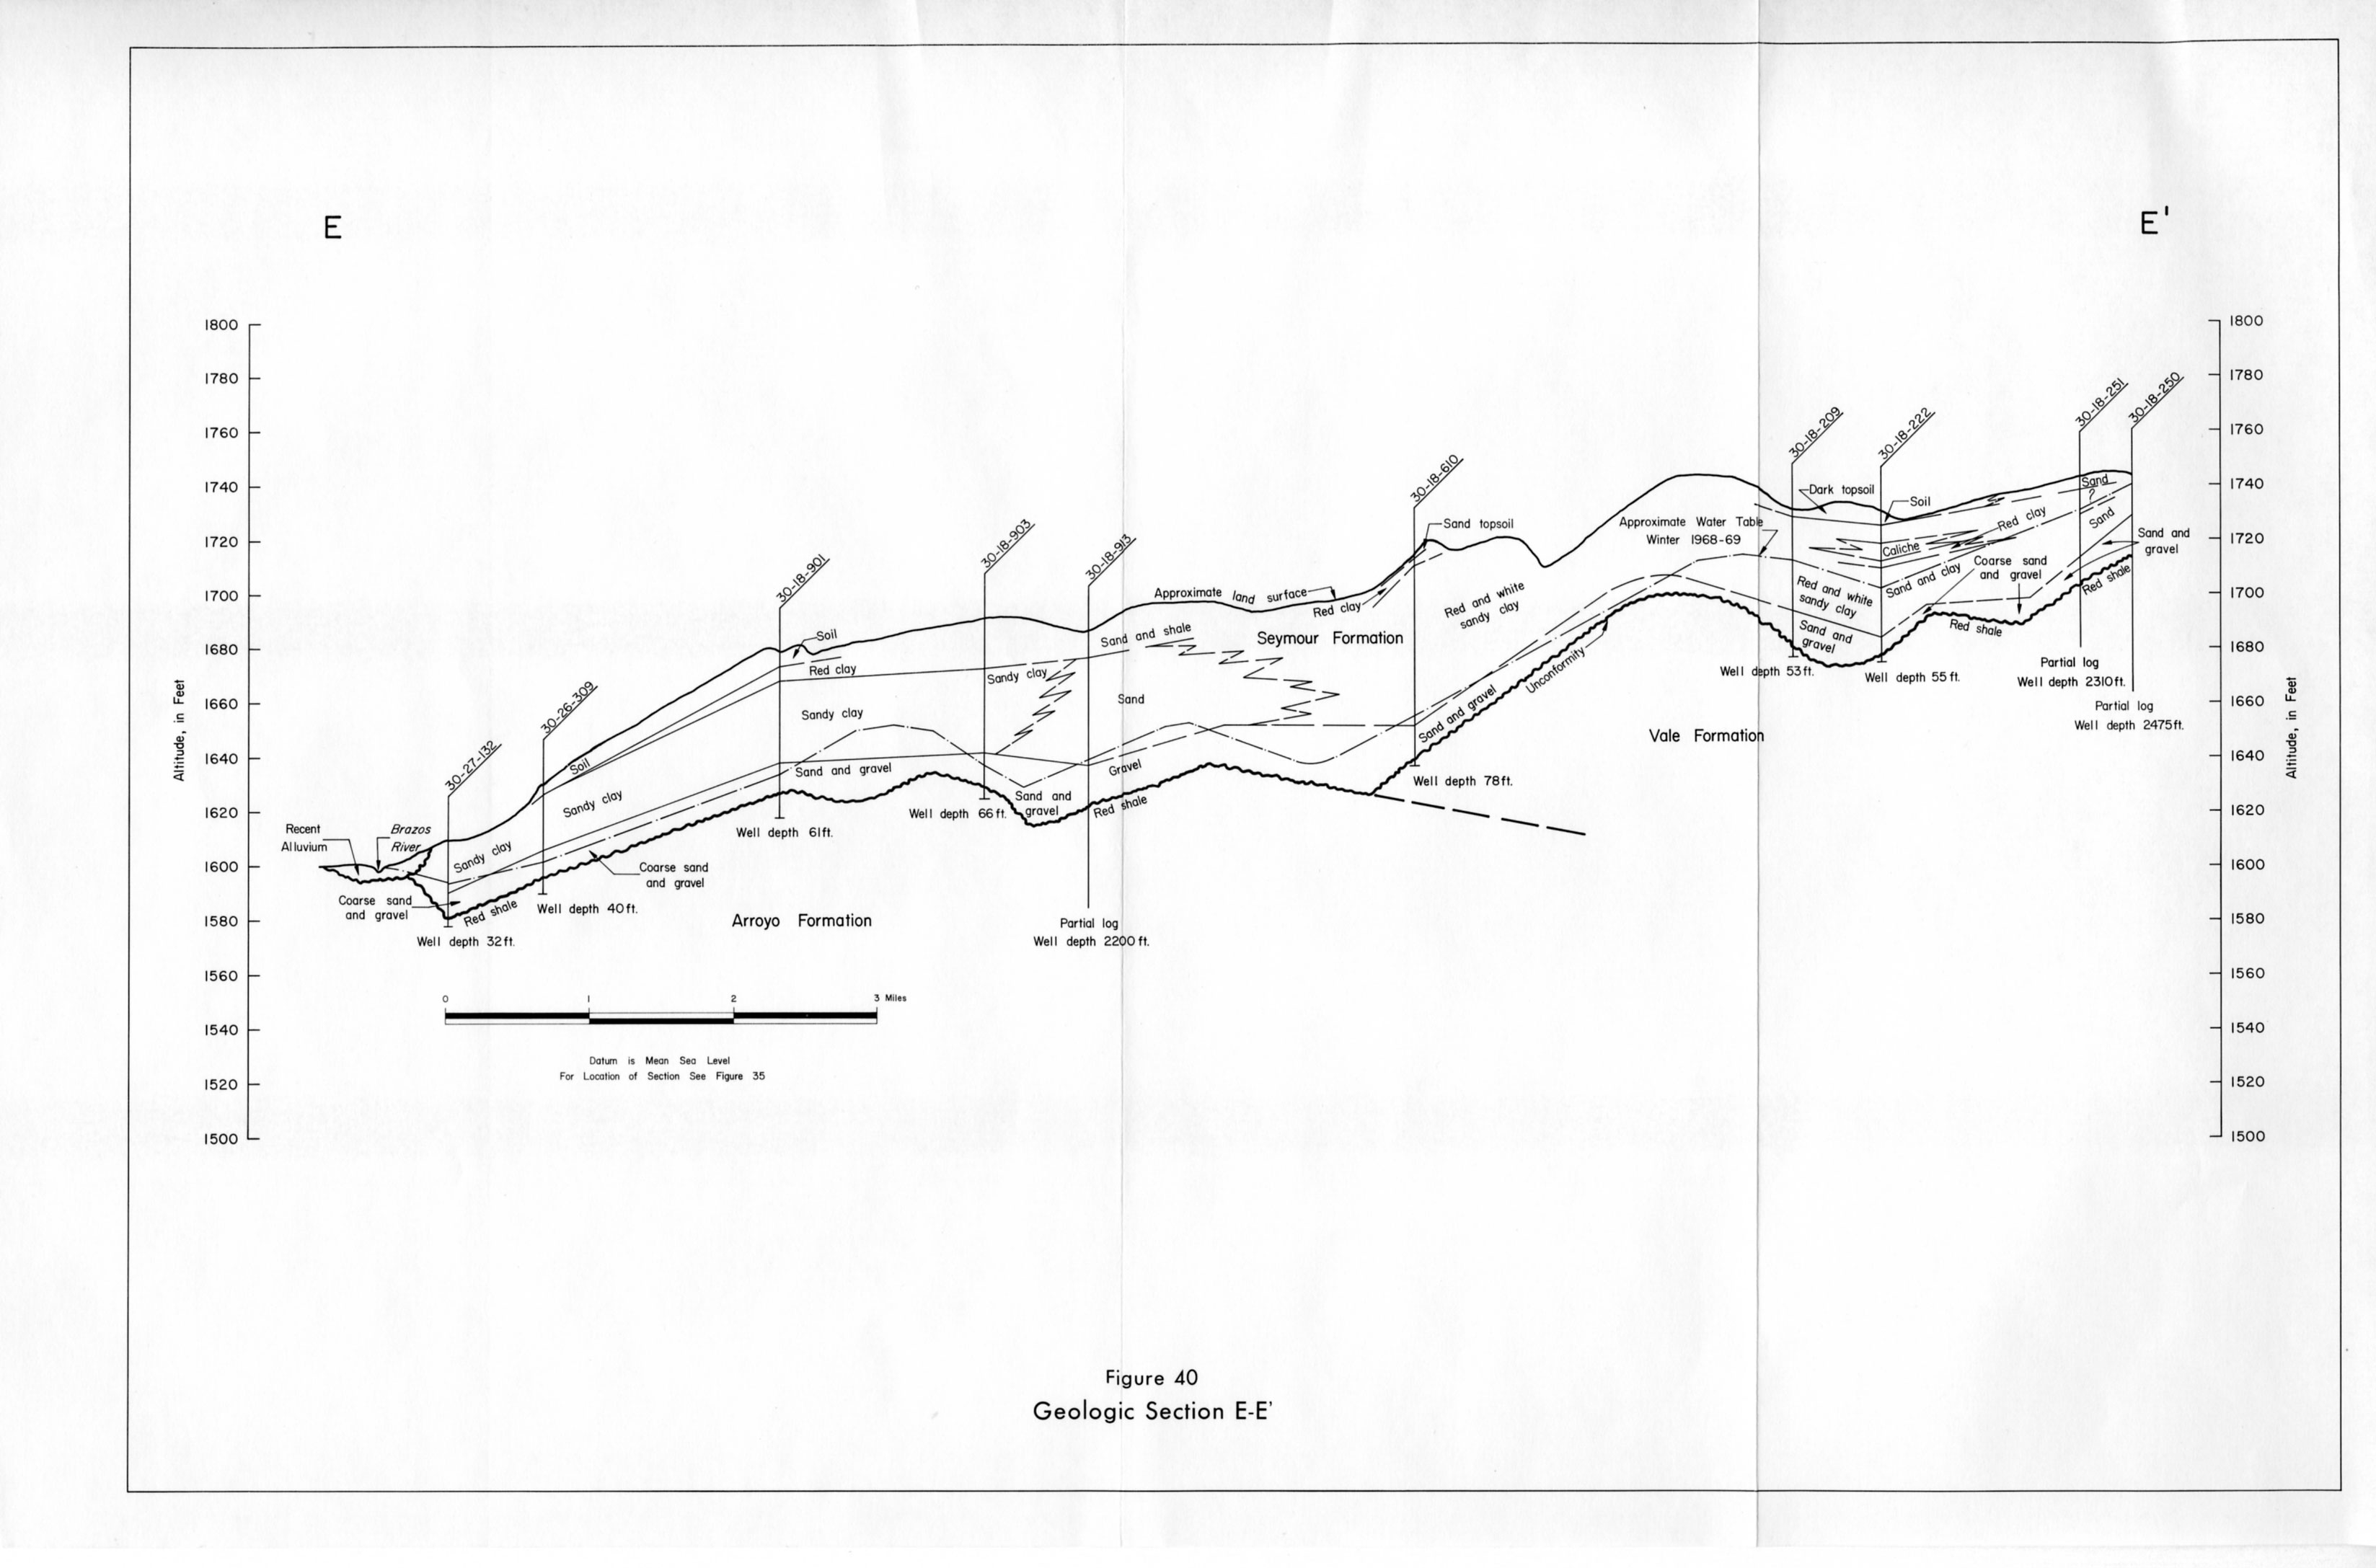
- Figure 40: Geologic Section E-E'