Report 292 Robert Flores | August 1985
- Report 292 - Ground-Water Evaluation From Test Hole Drilling Near Mission, Texas
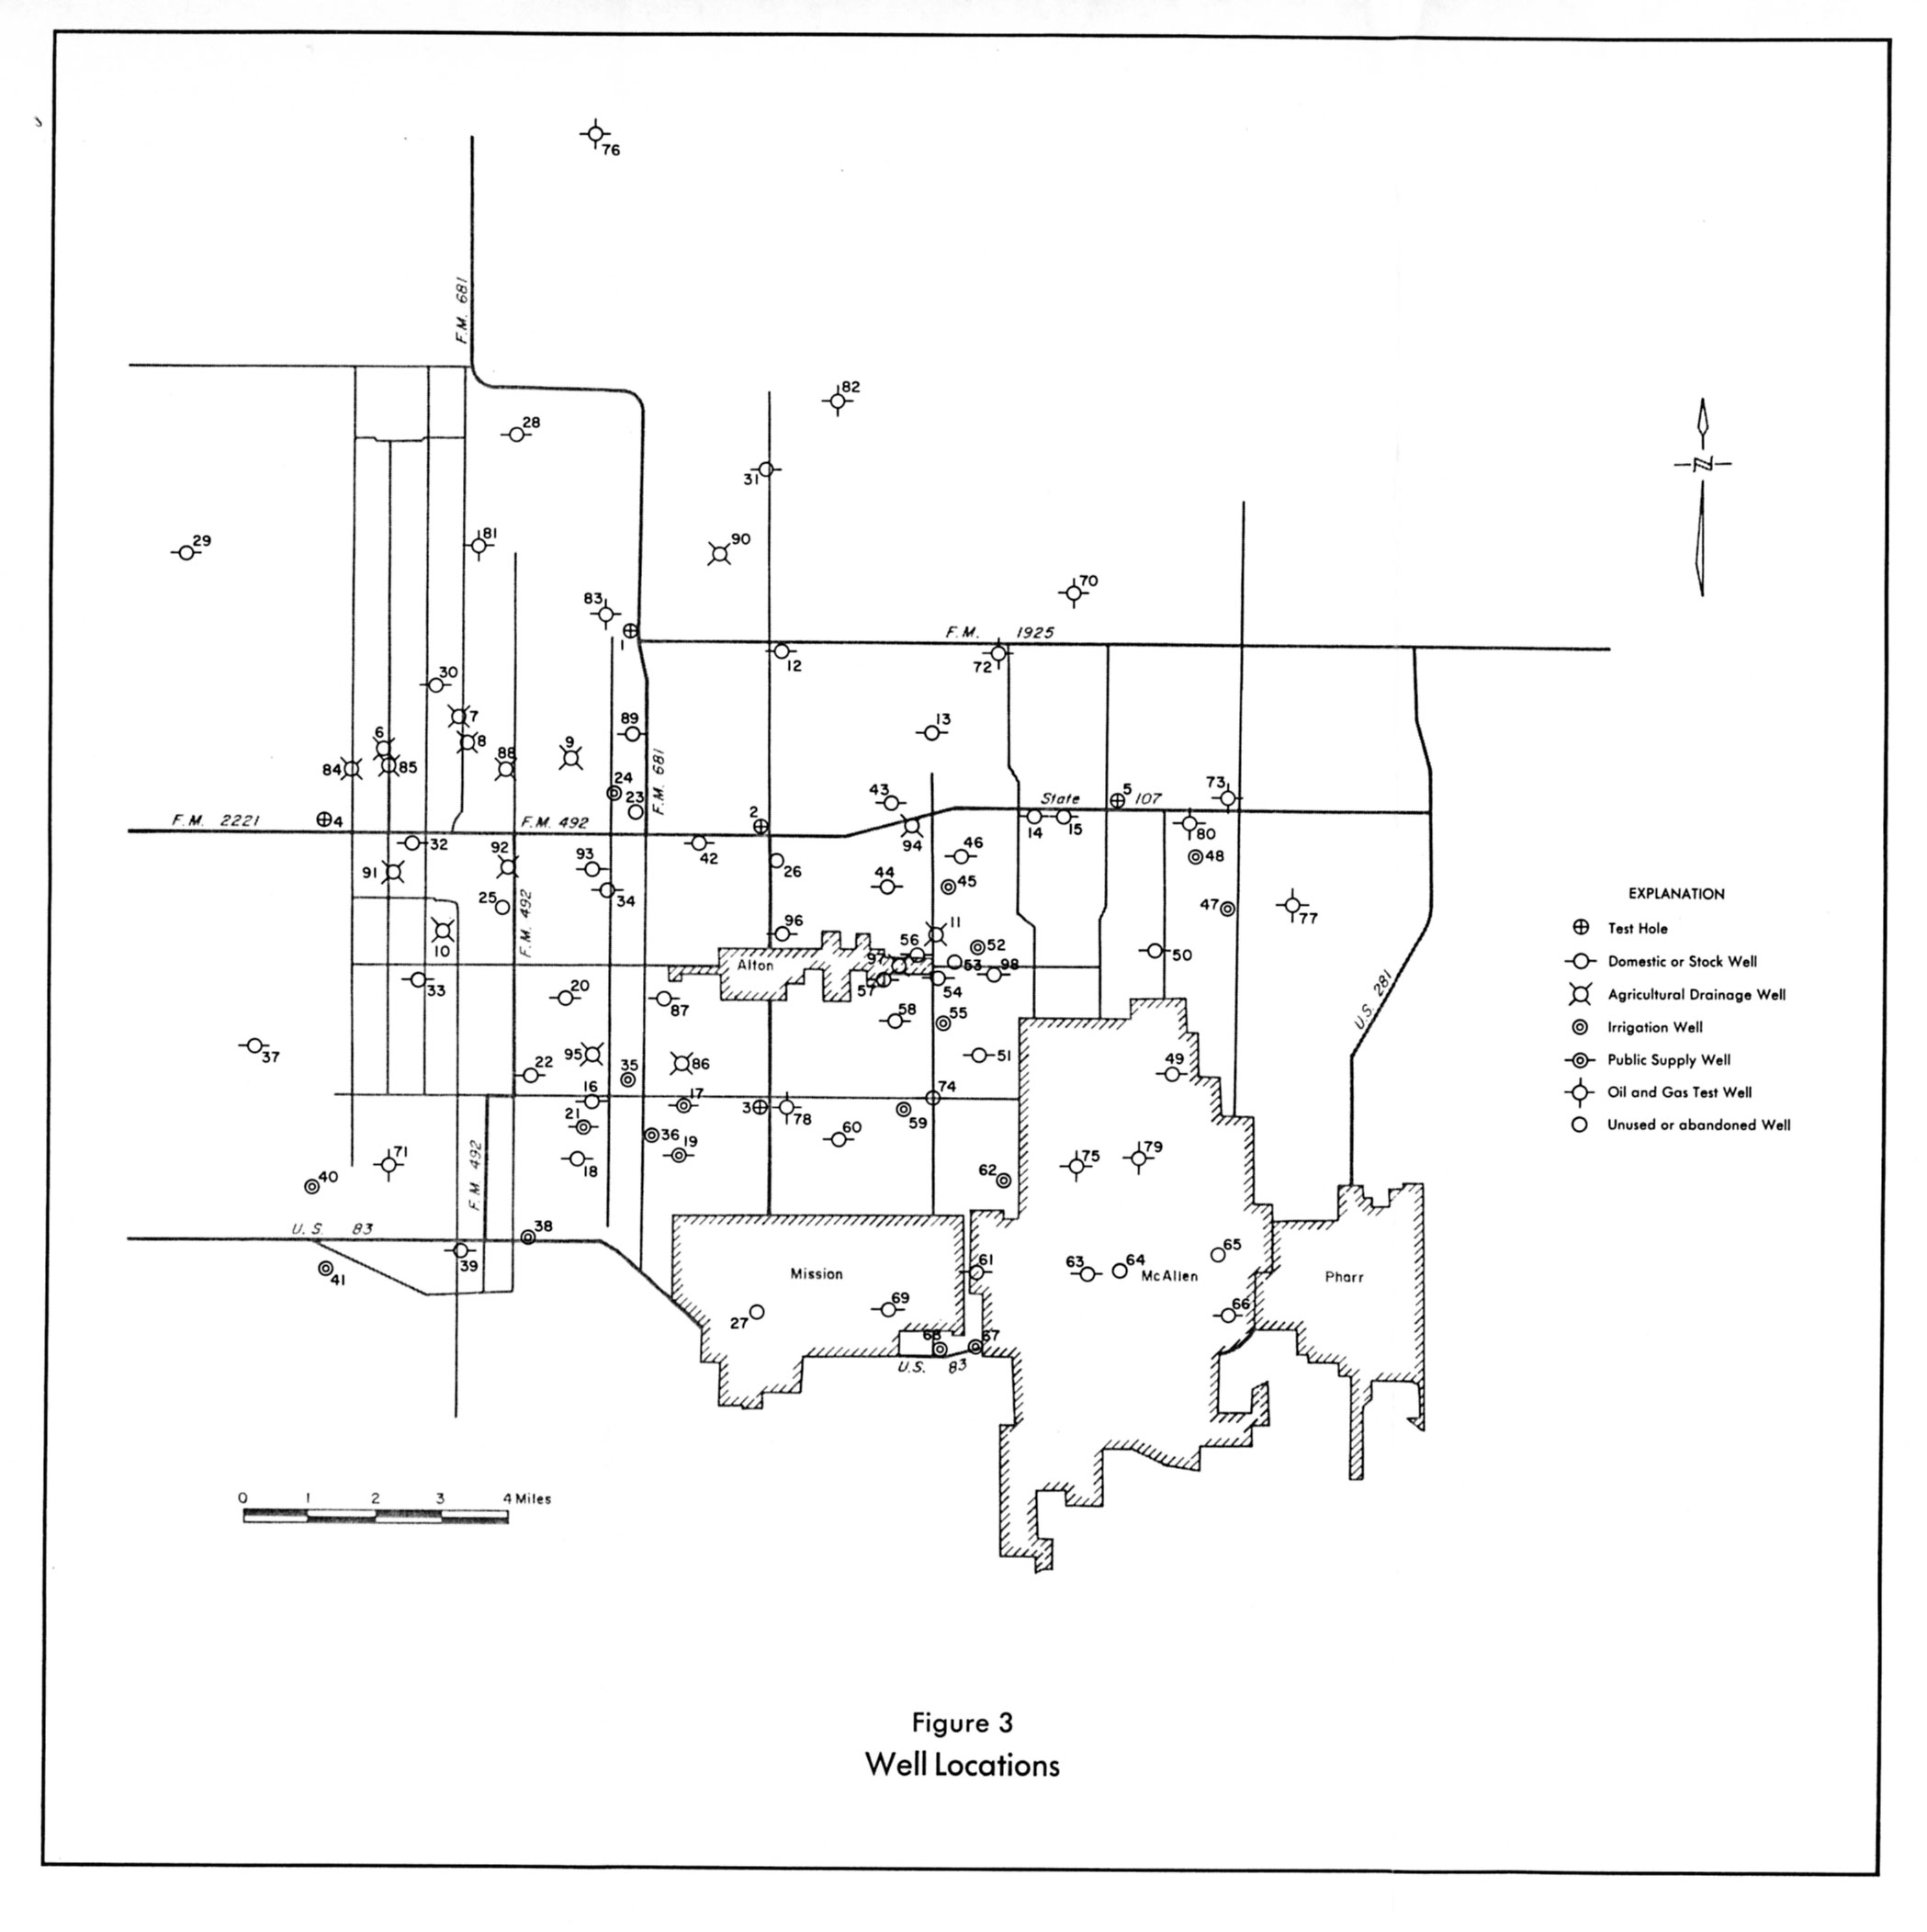
- Figure 3: Well Locations
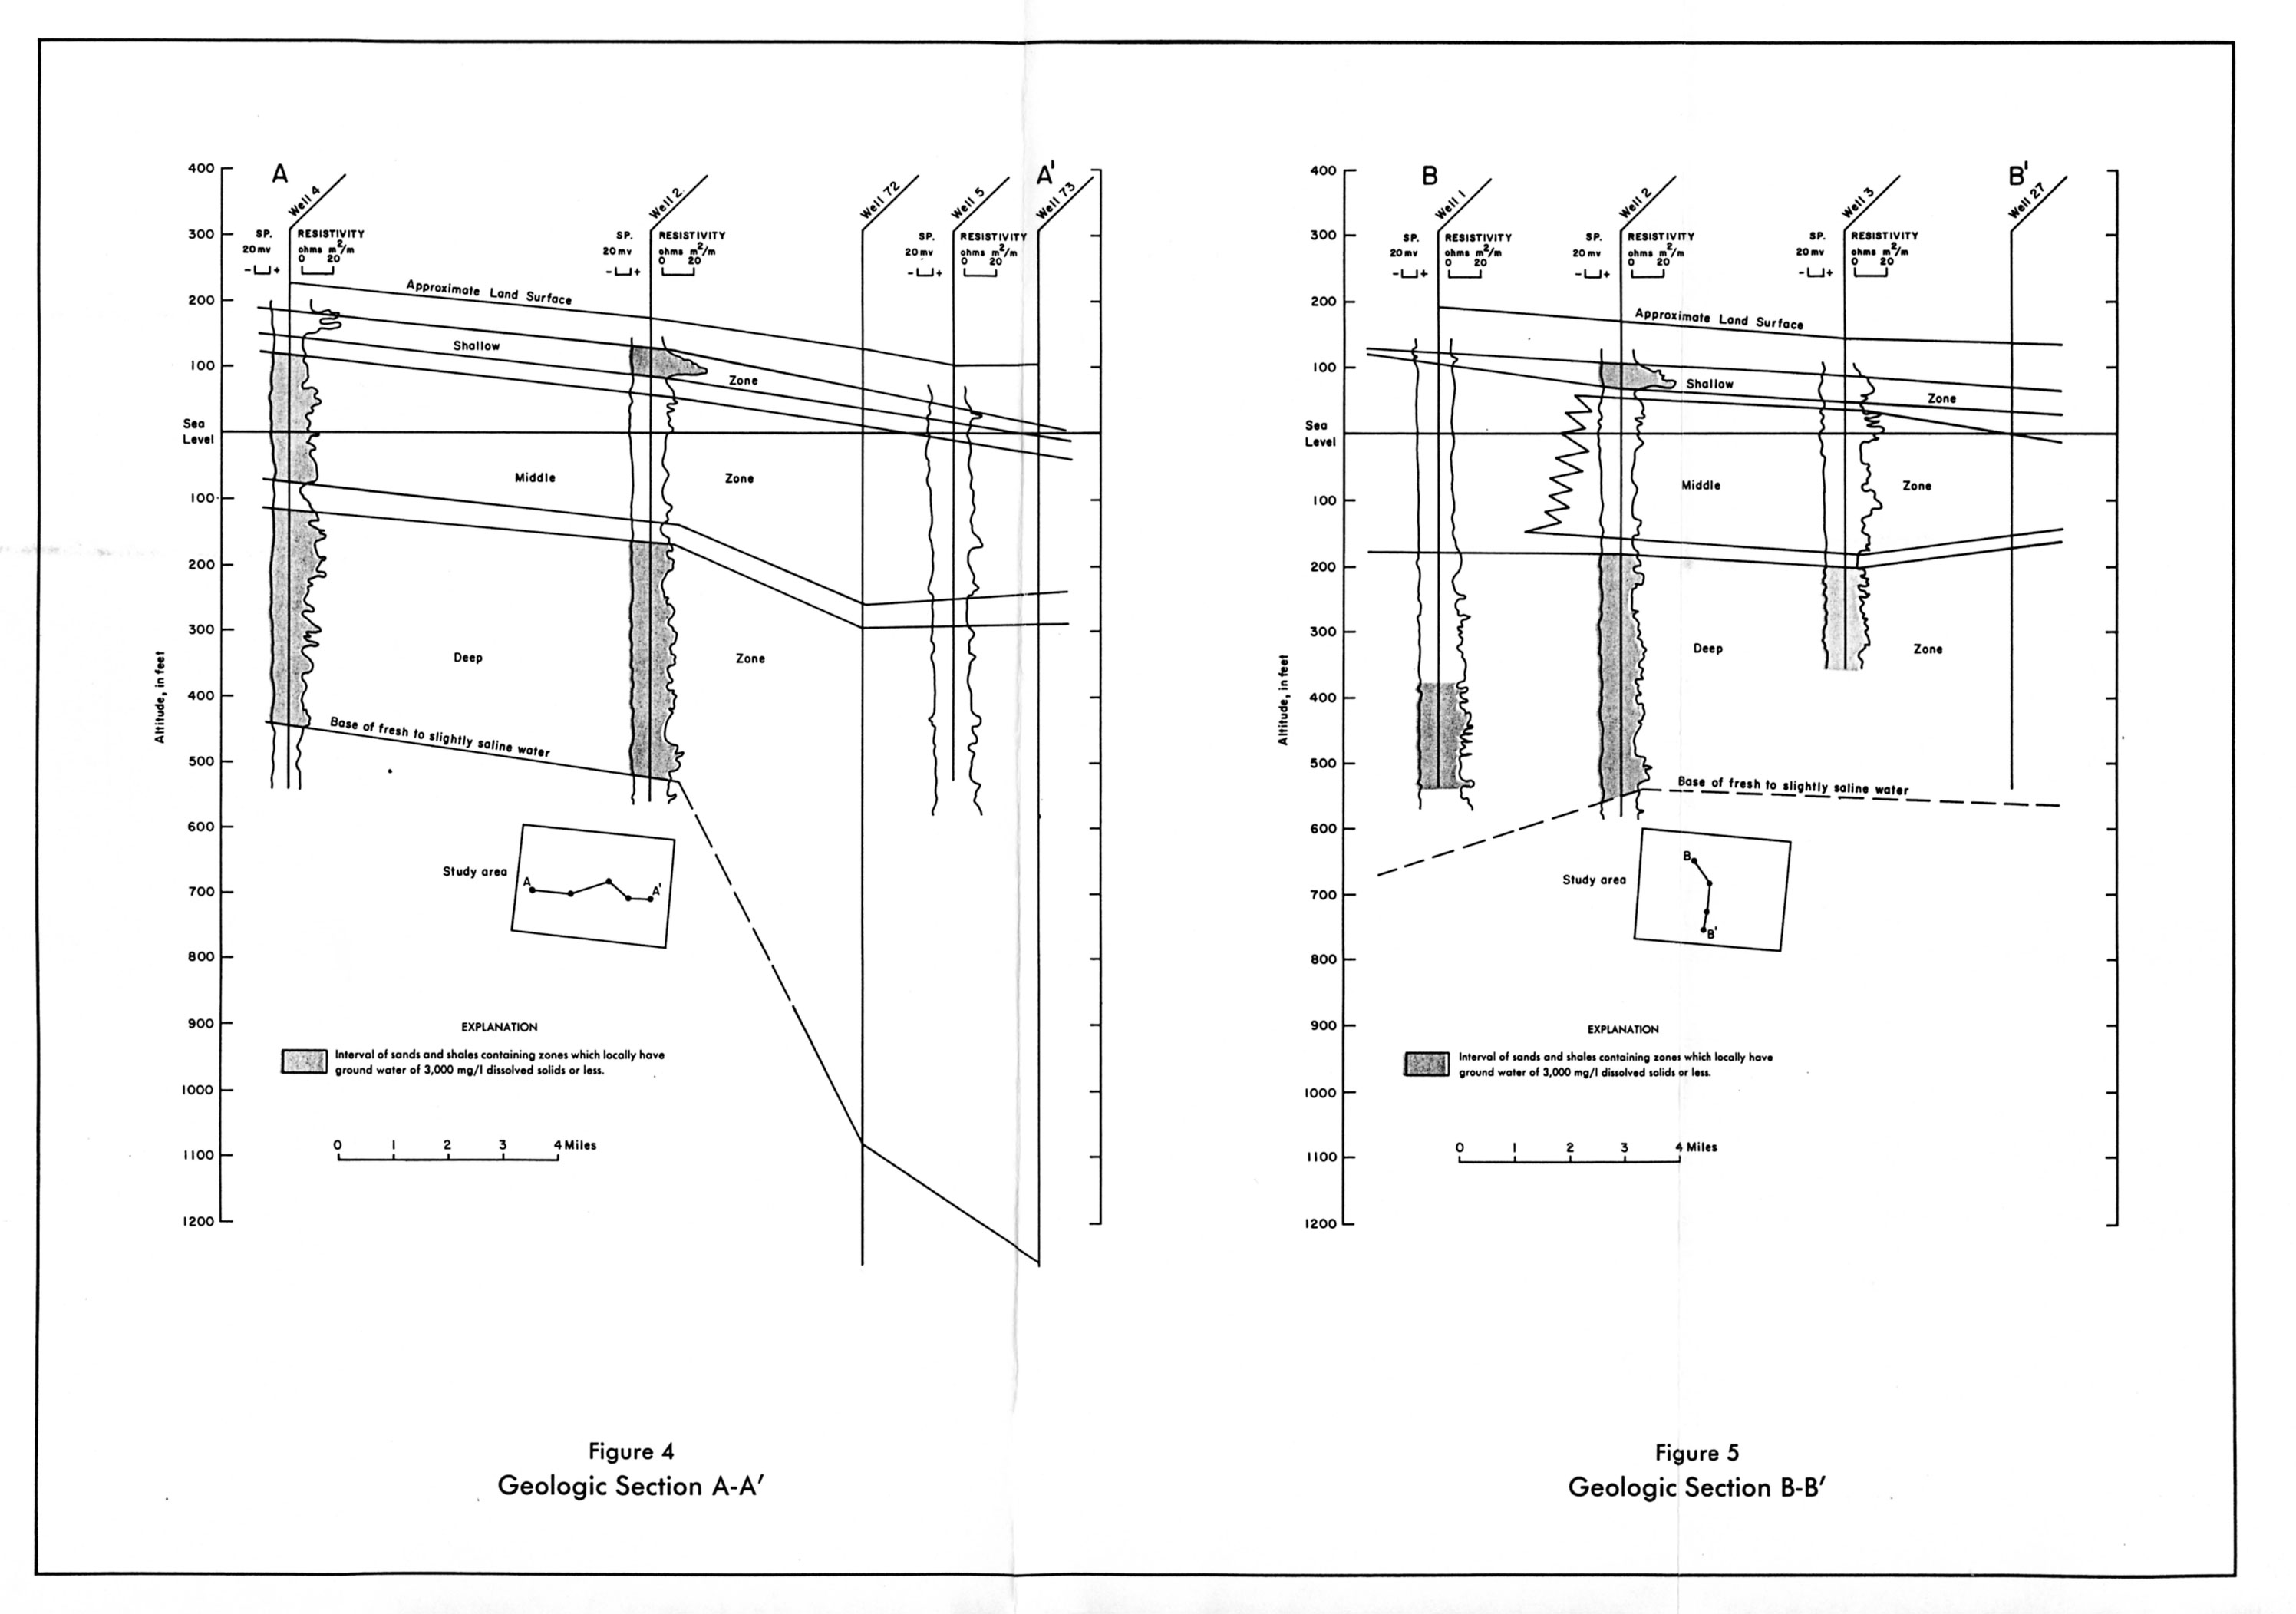
- Figure 4 : Geologic Section A-A'
- Figure 5 : Geologic Section B-B'
- Figure 6: Approximate Altitude of and Depth to Top of the Shallow Zone
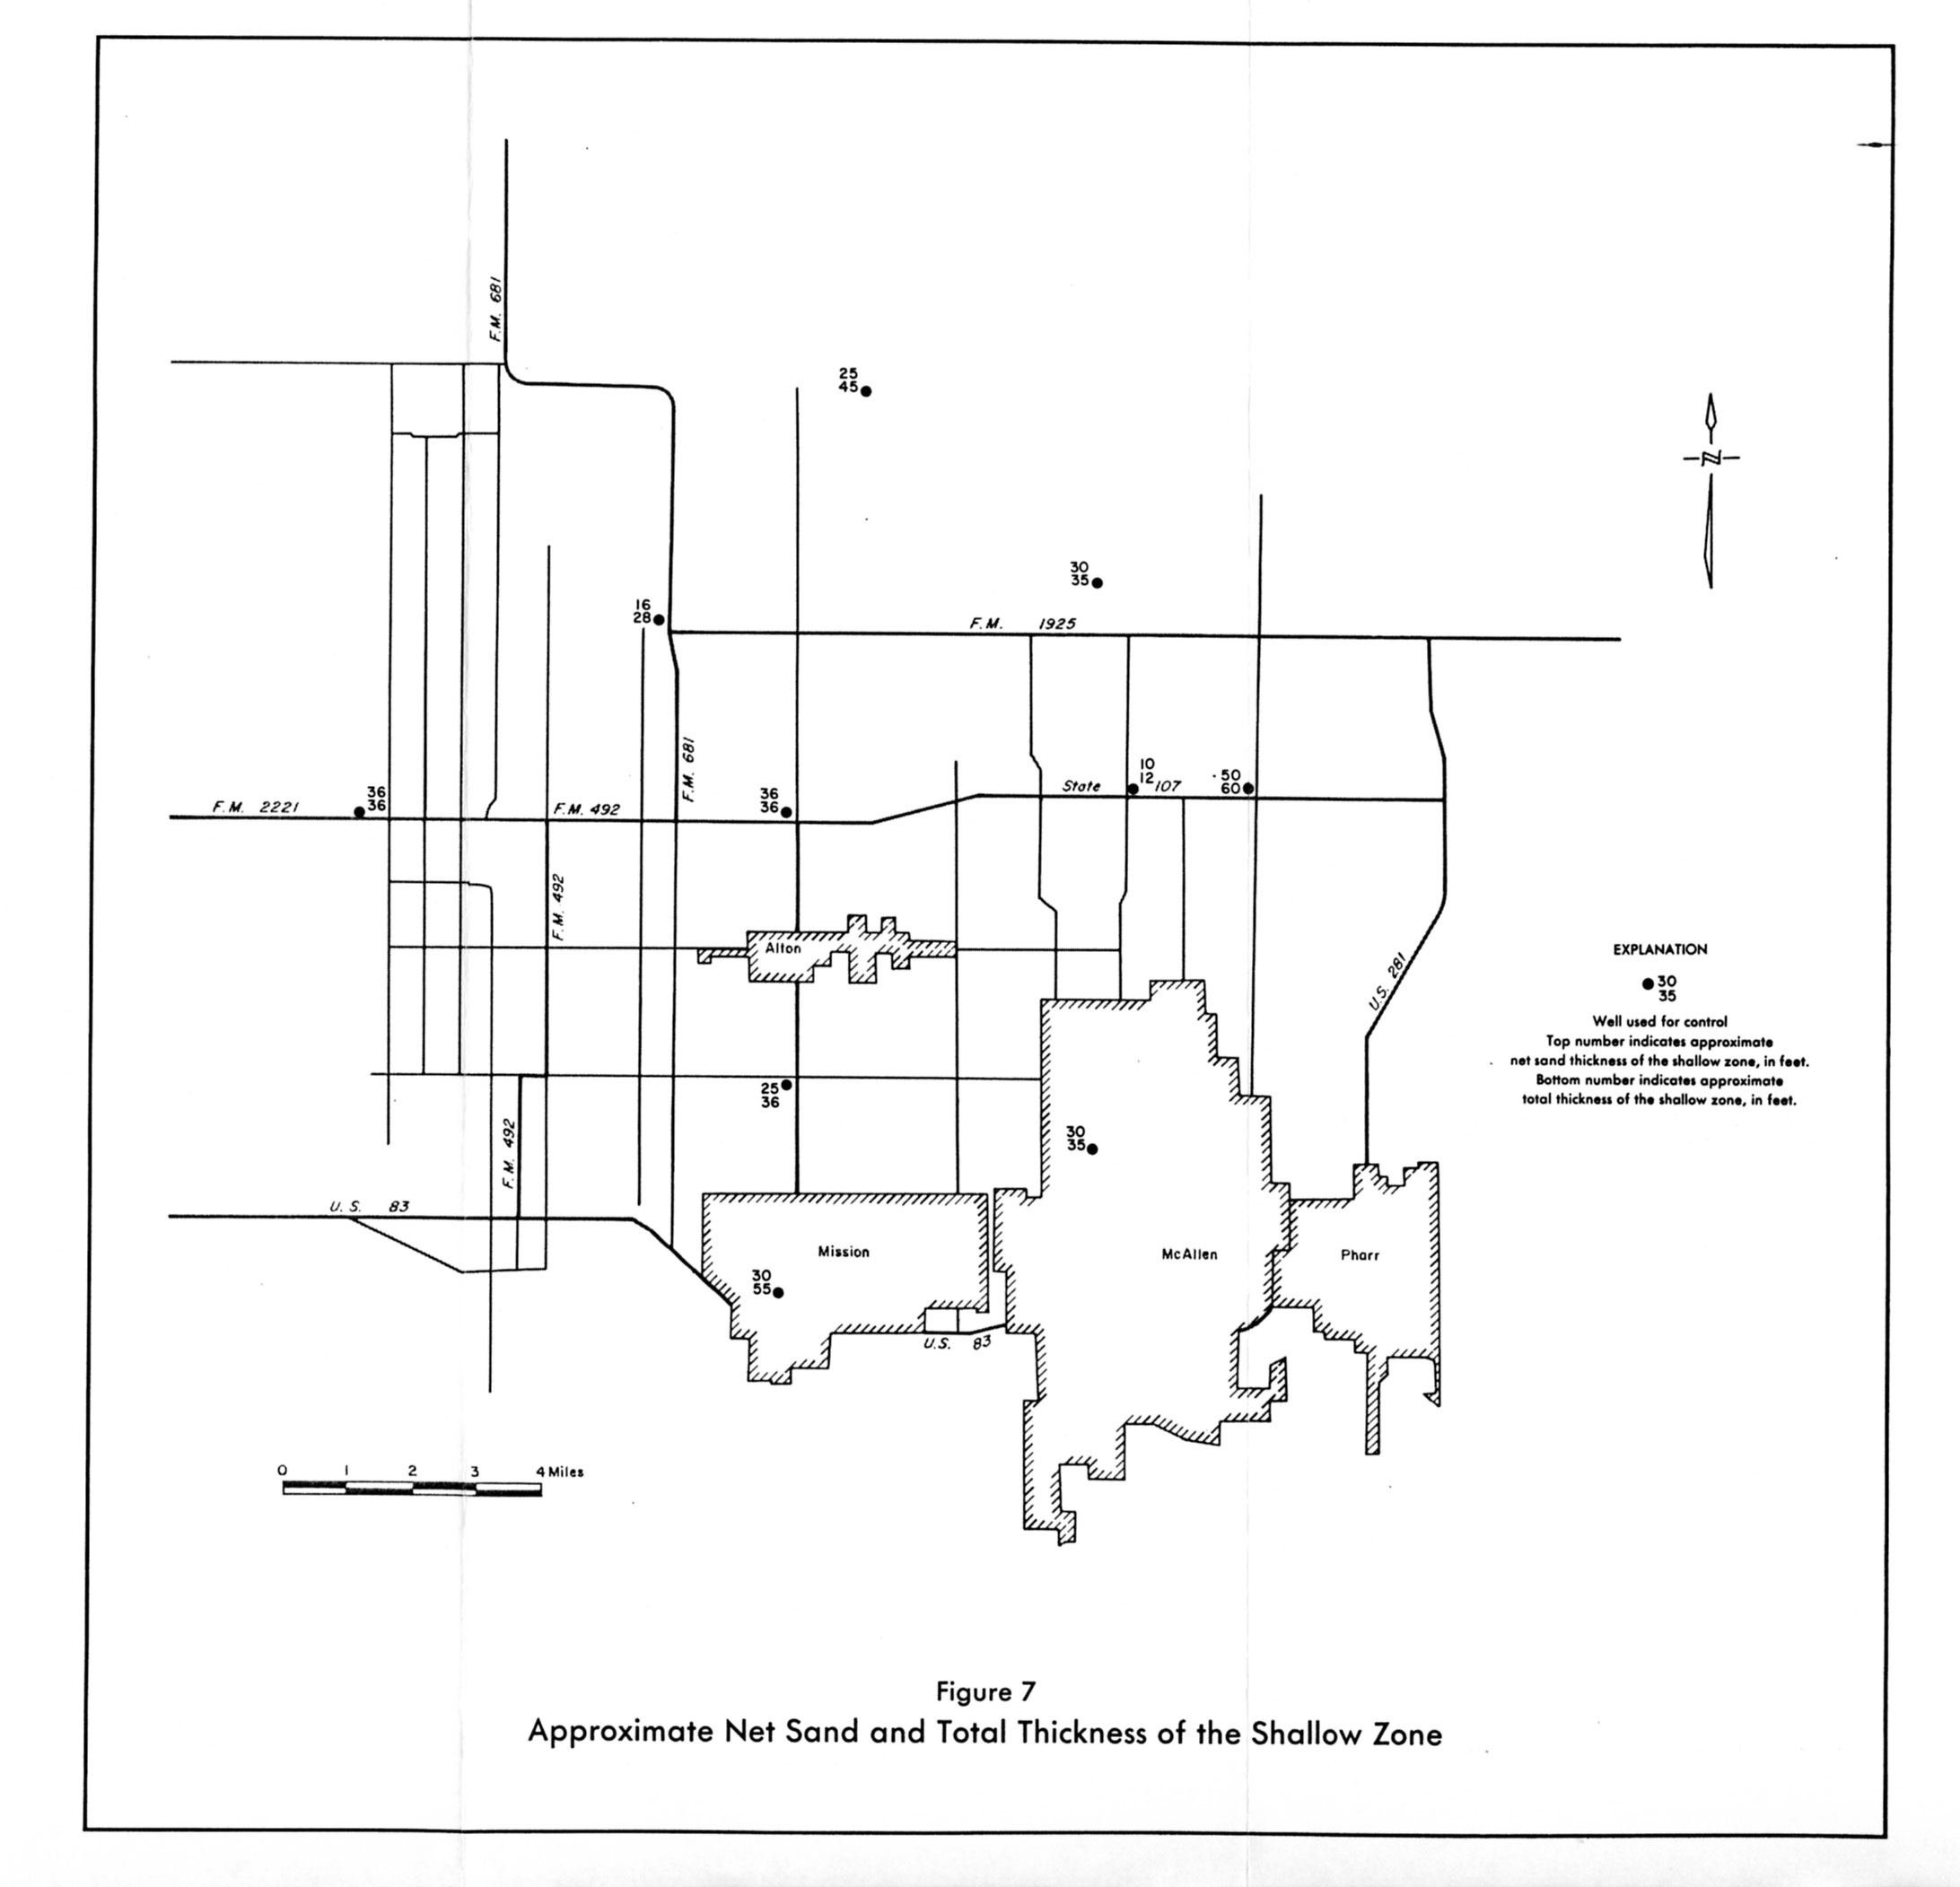
- Figure 7: Approximate Net Sand and Total Thickness of the Shallow Zone
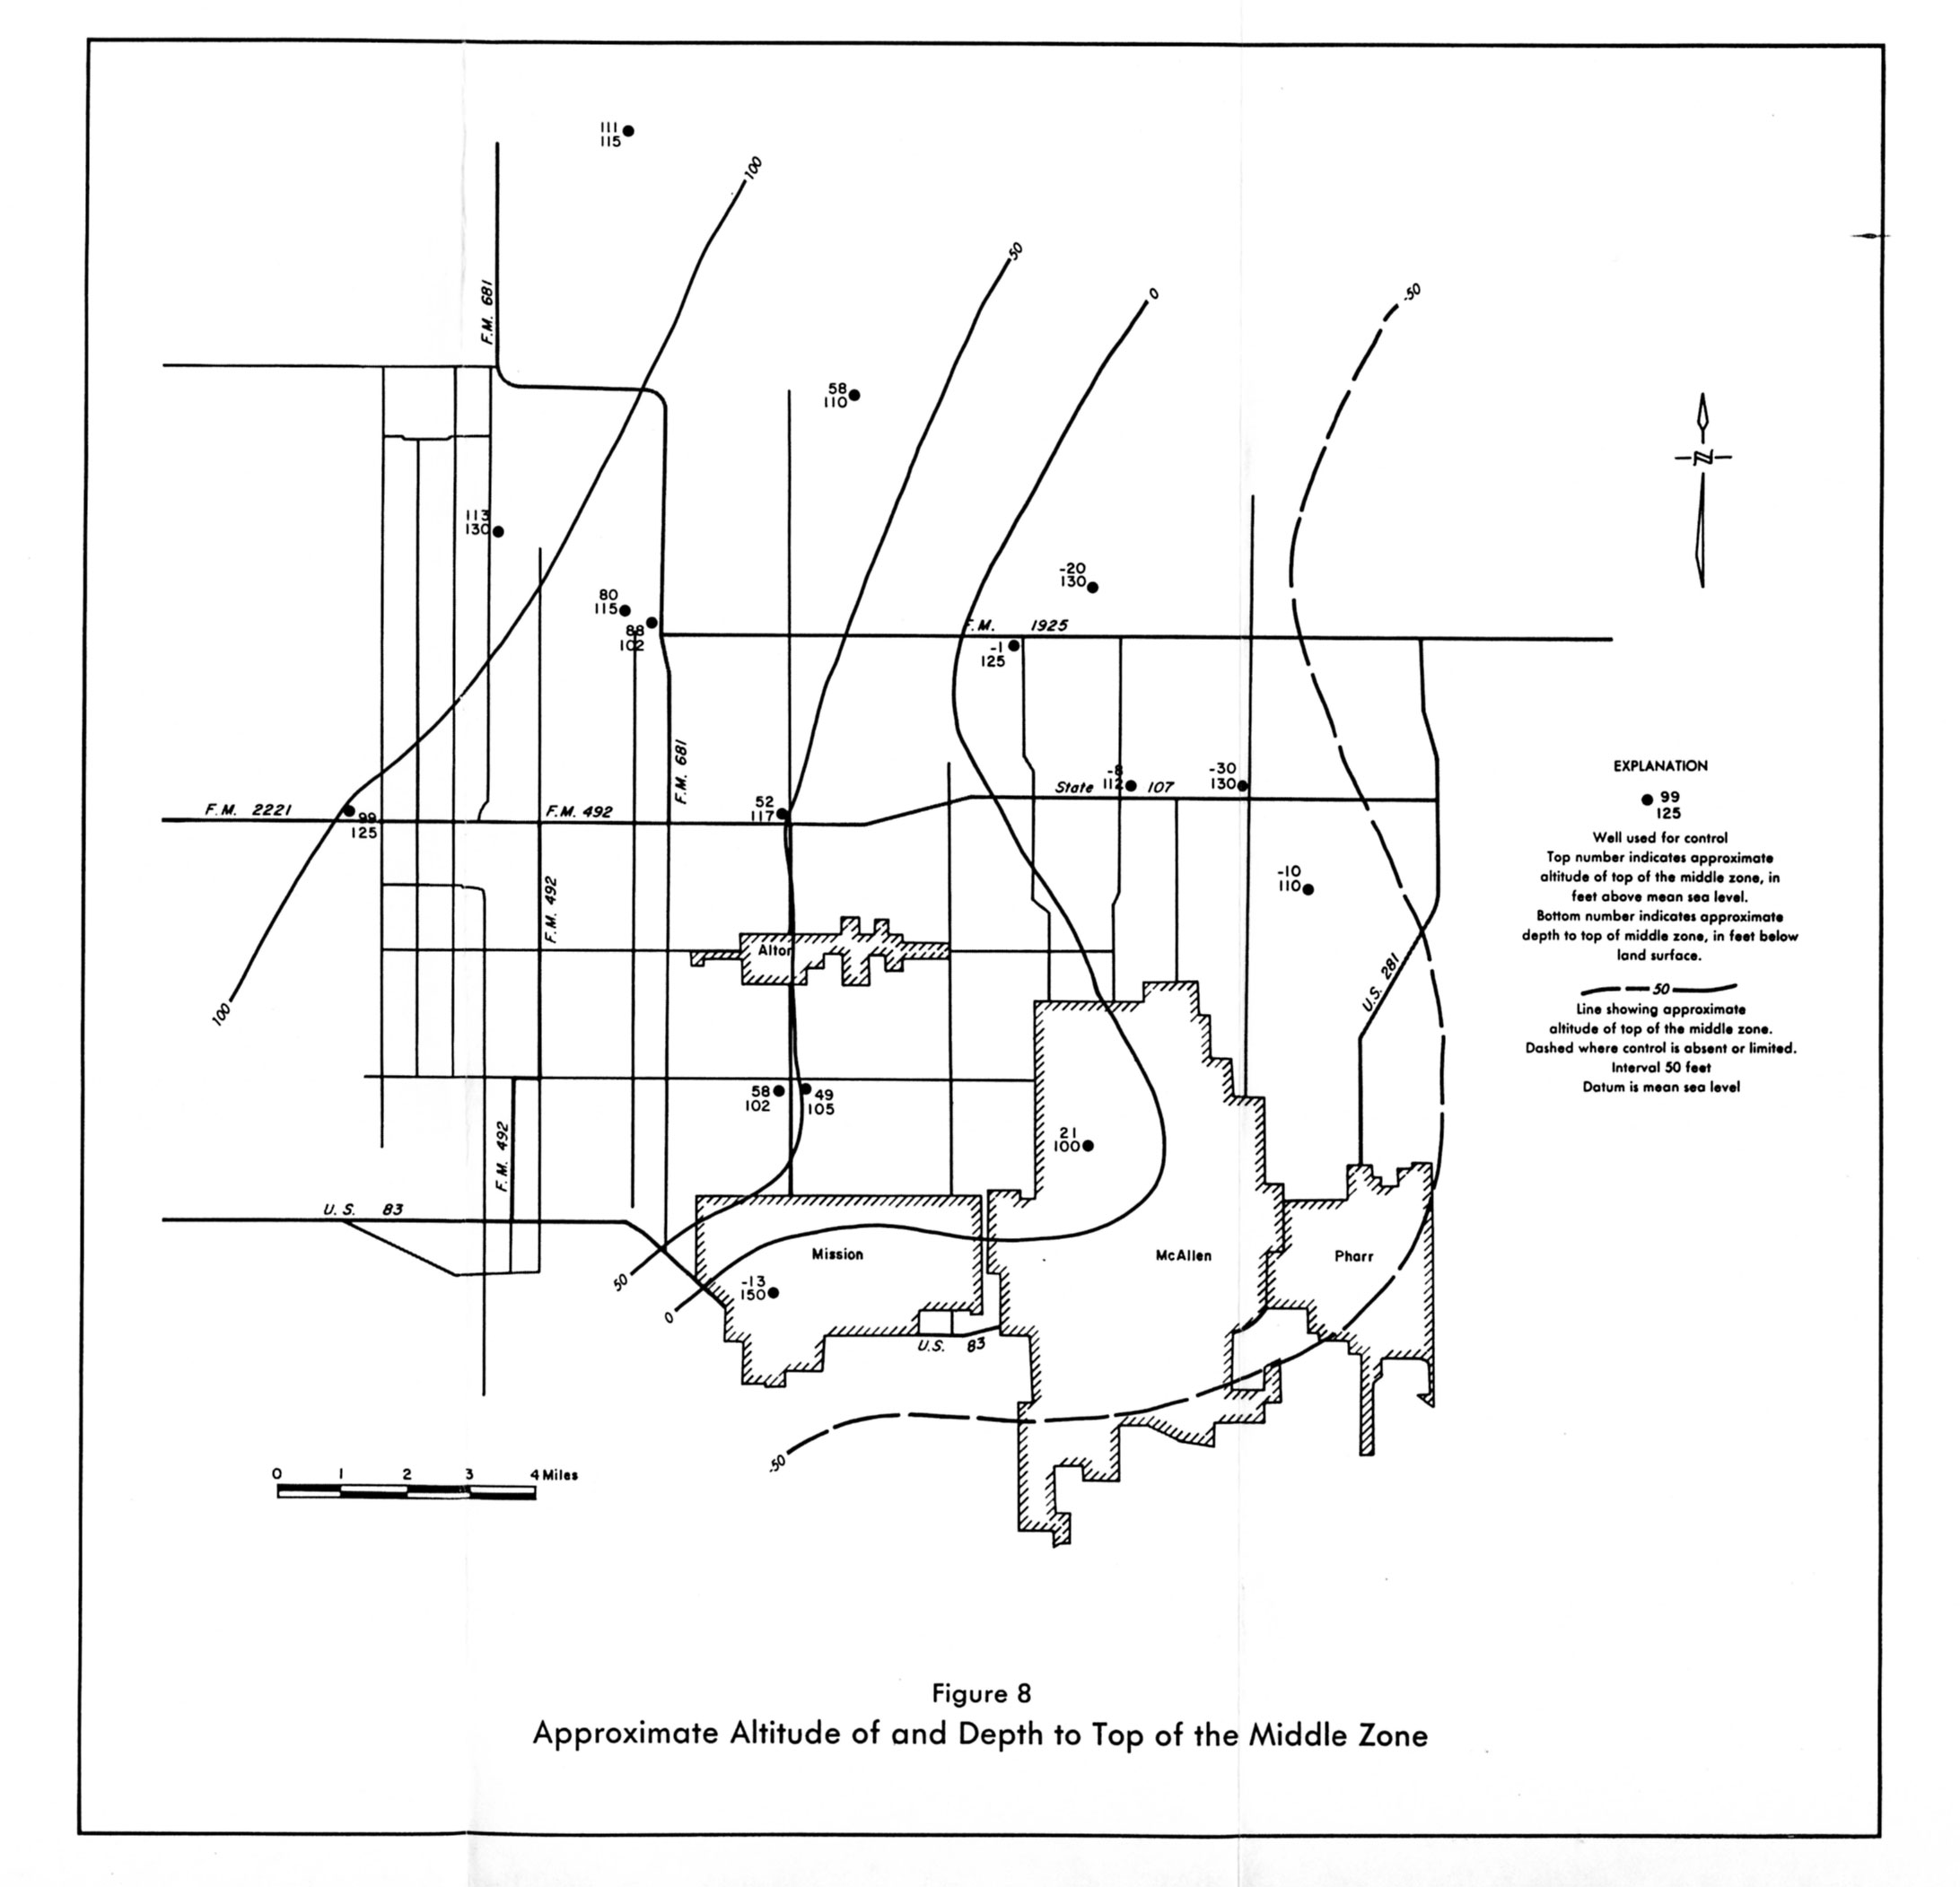
- Figure 8: Approximate Altitude of and Depth to Top of the Middle Zone
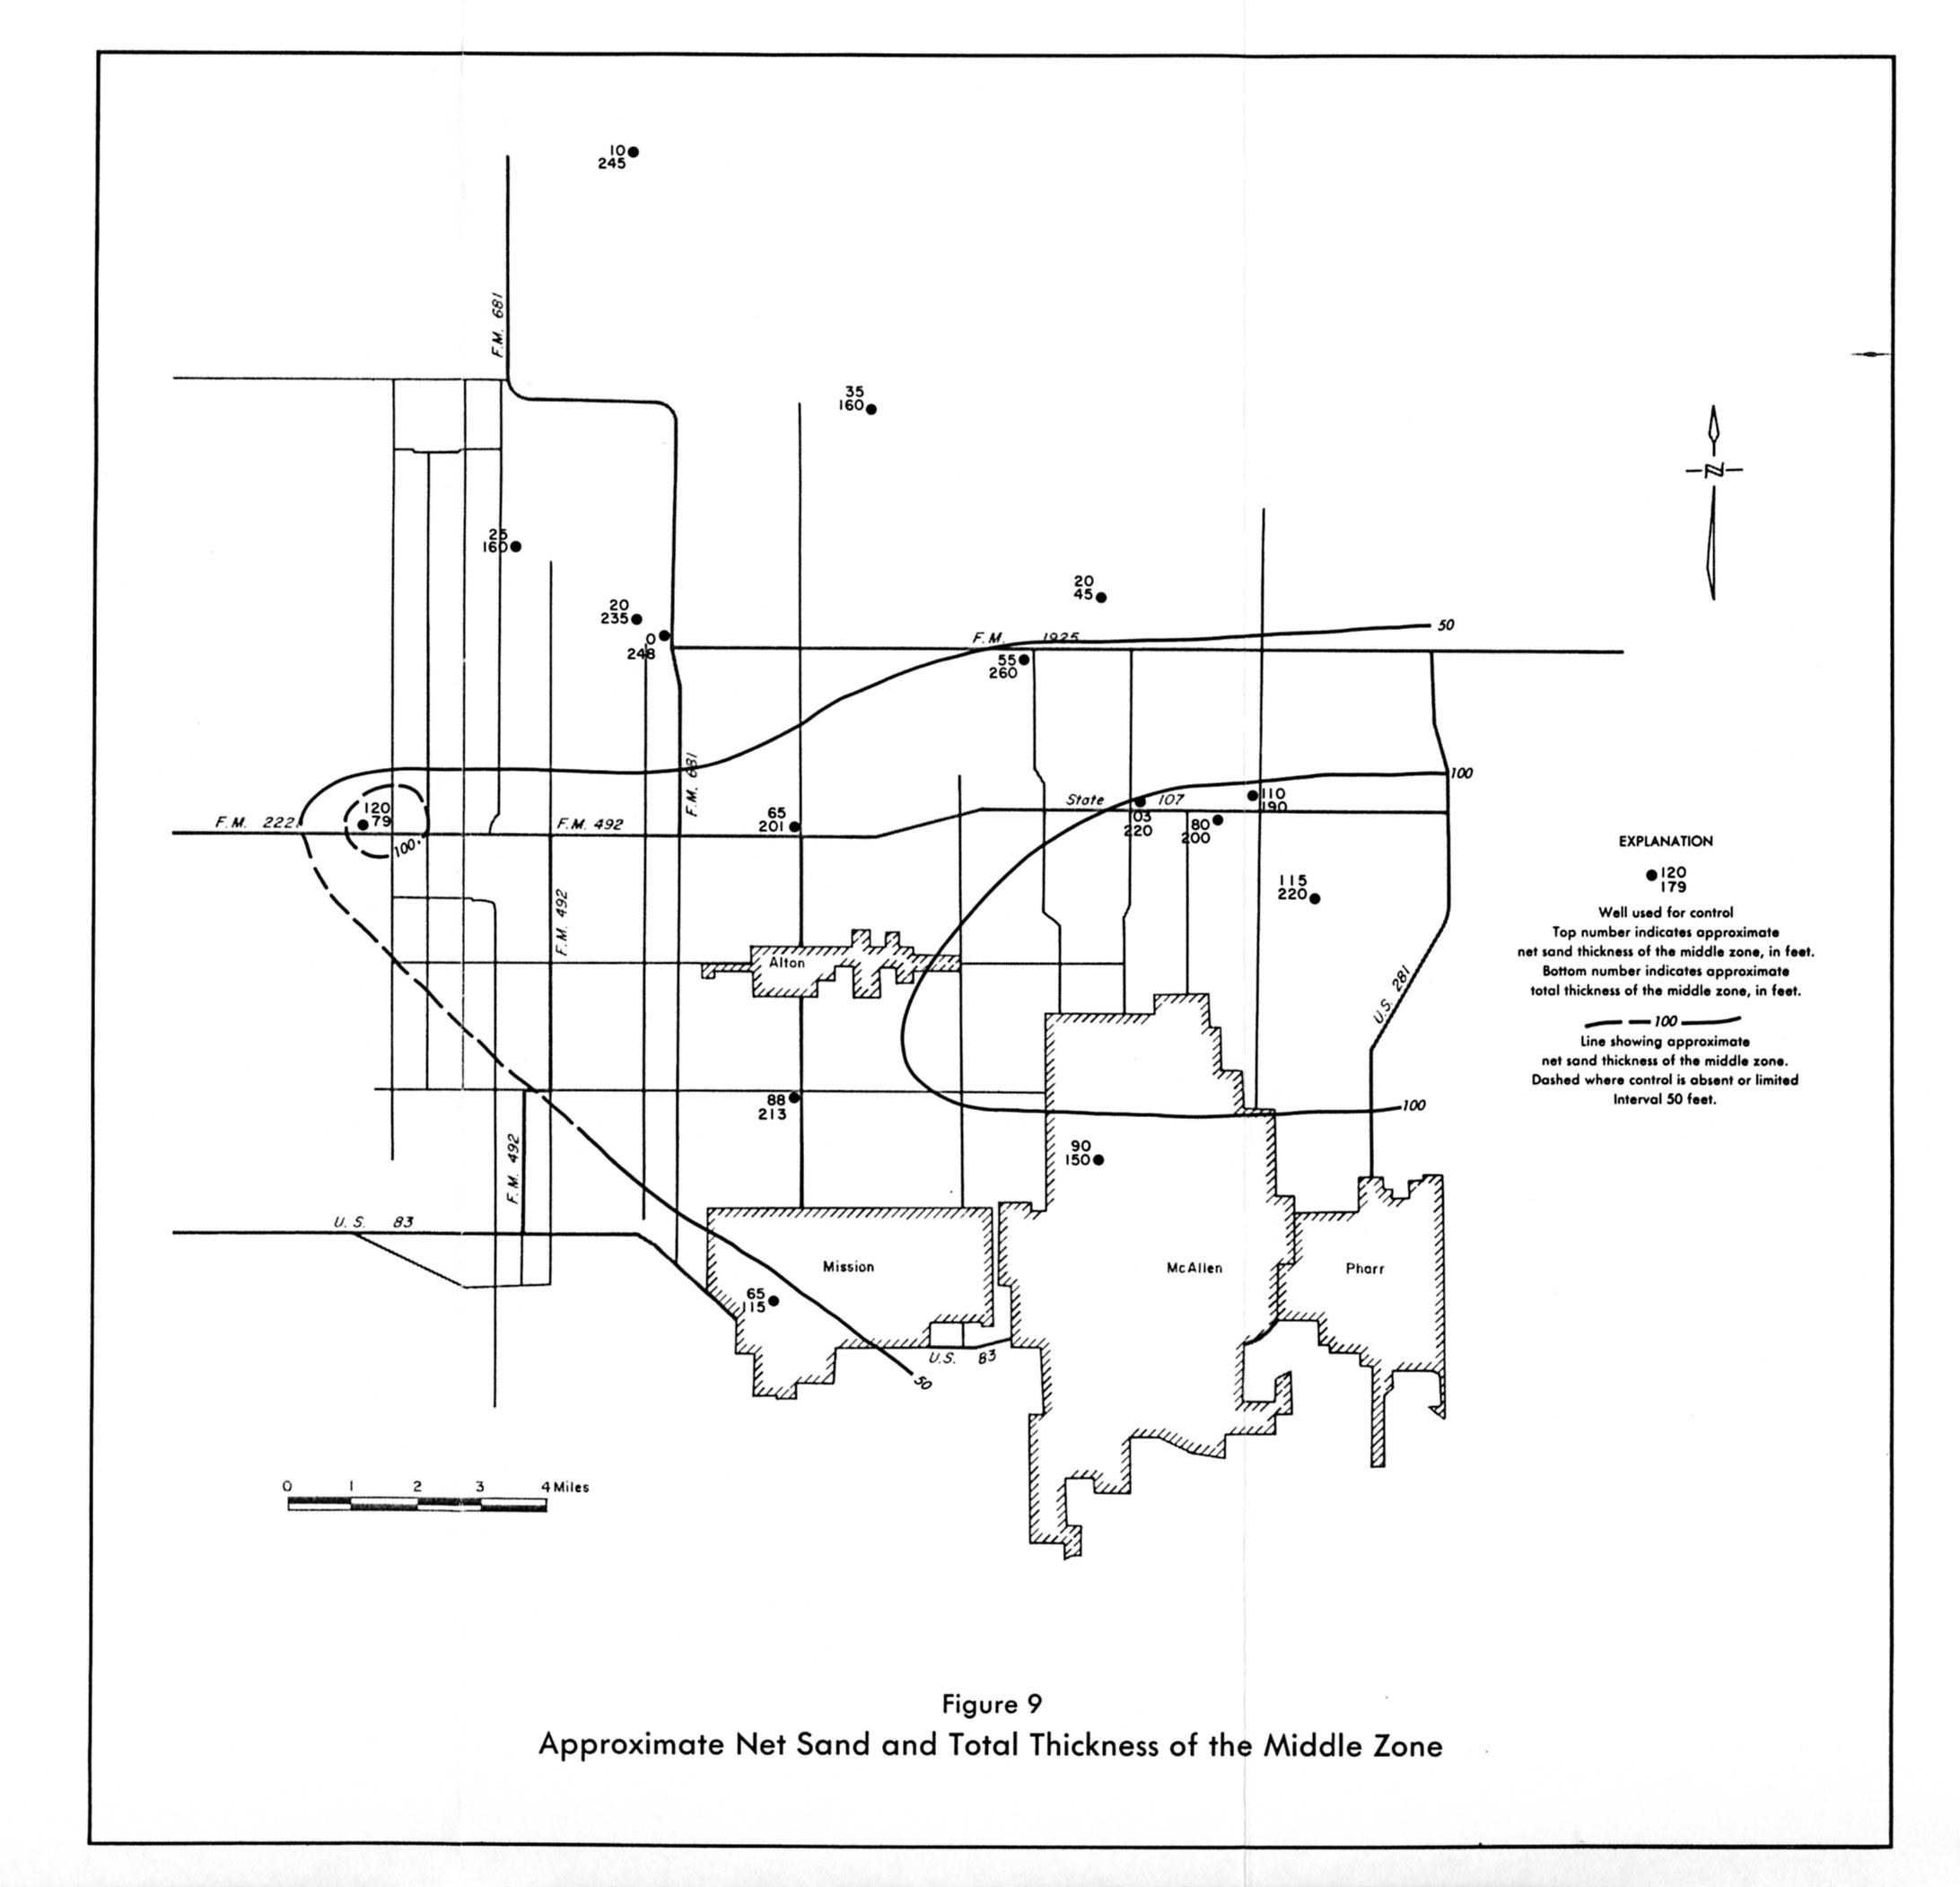
- Figure 9: Approximate Net Sand and Total Thickness of the Middle Zone
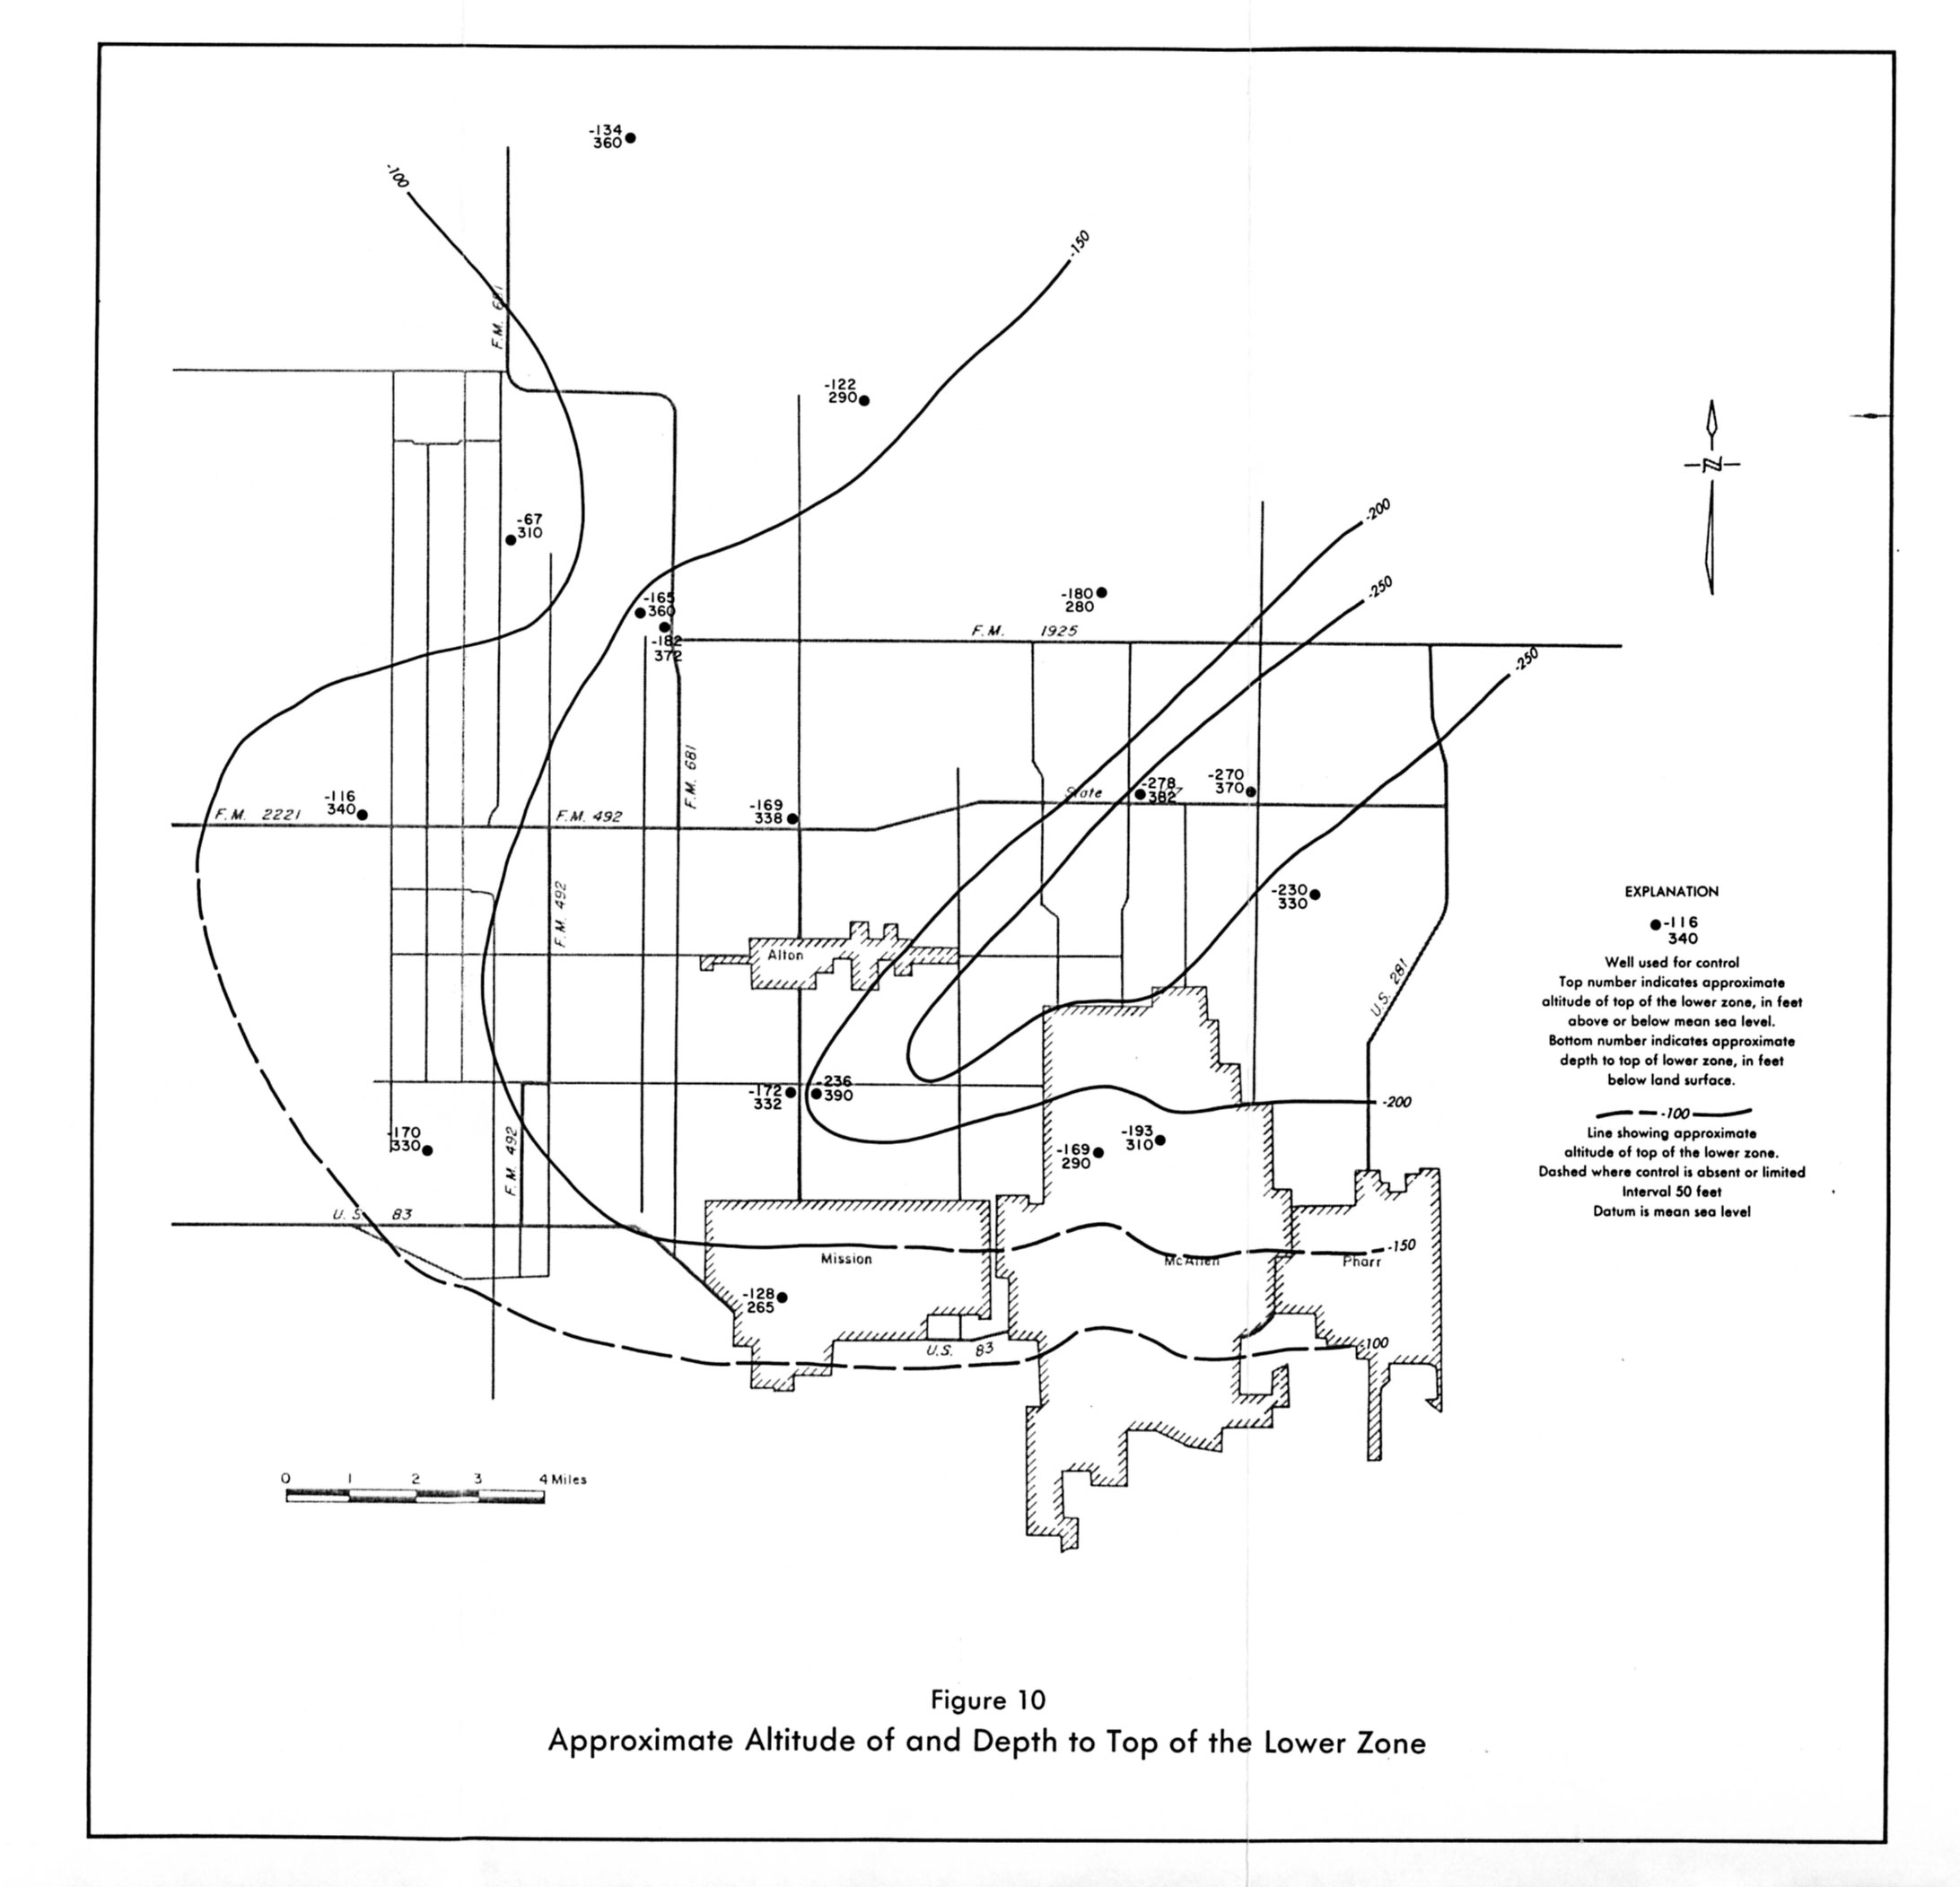
- Figure 10: Approximate Altitude of and Depth to Top of the Lower Zone
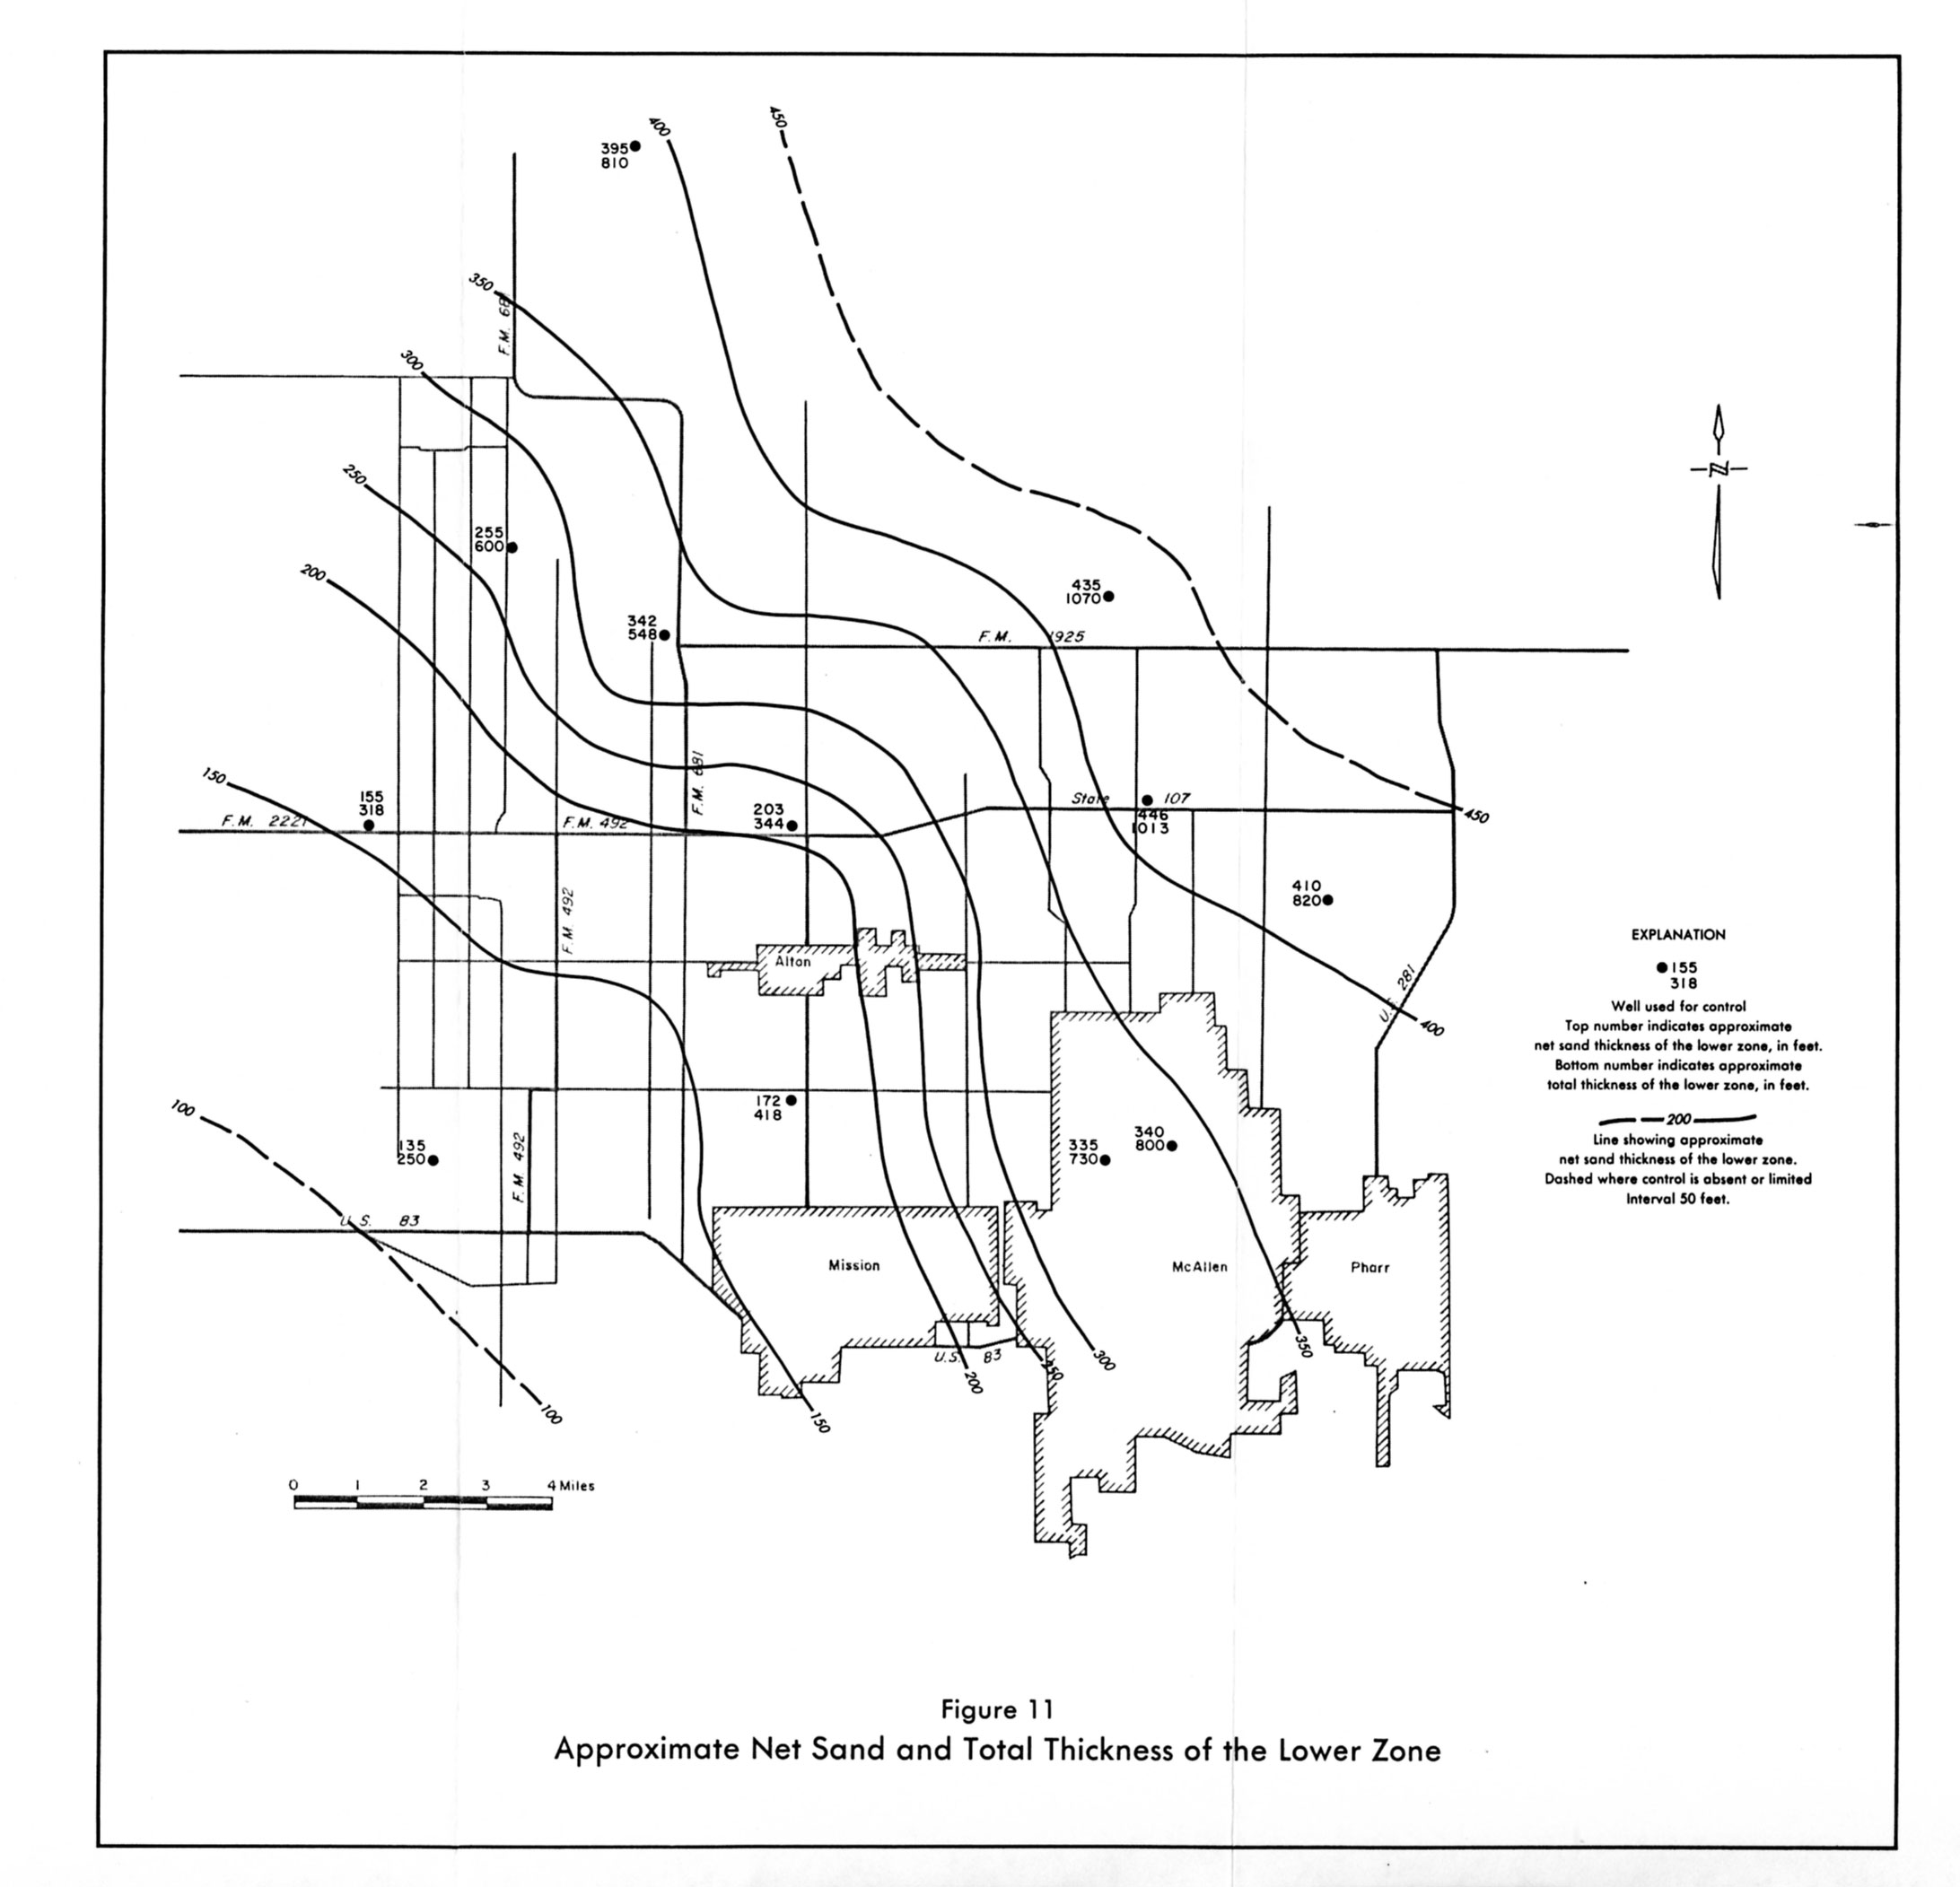
- Figure 11: Approximate Net Sand and Total Thickness of the Lower Zone
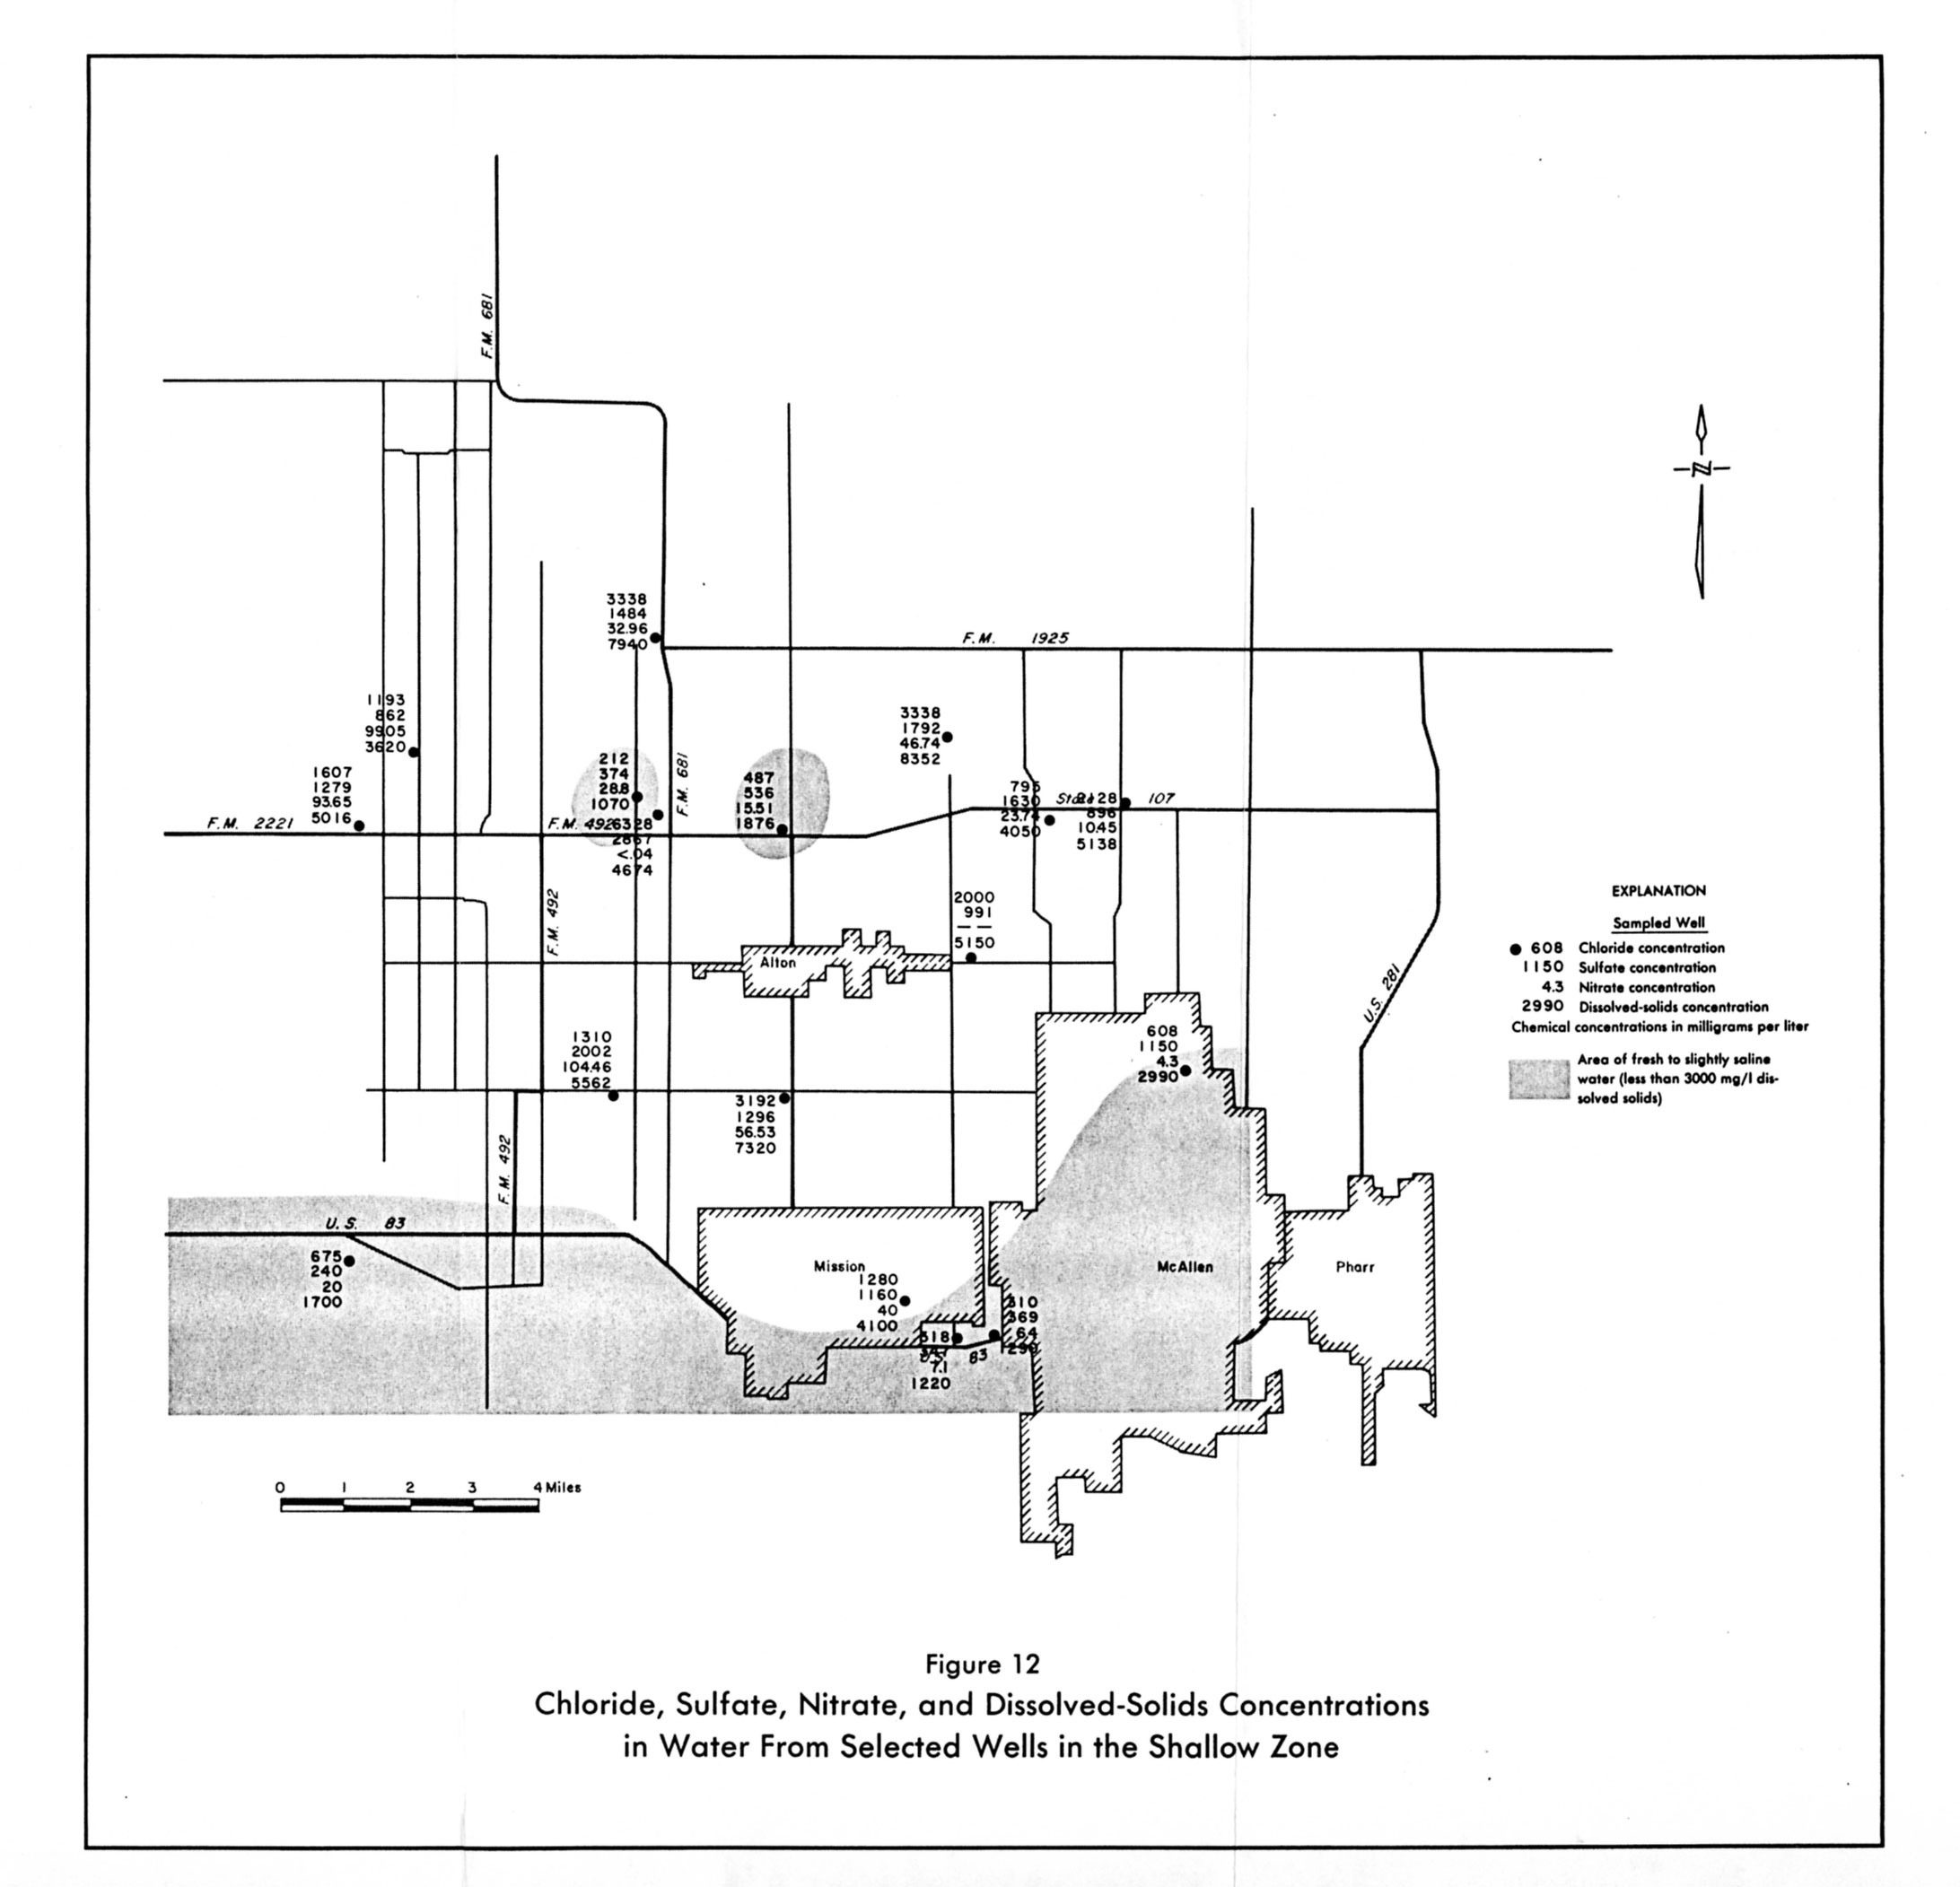
- Figure 12: Chloride, Sulfate, Nitrate, and Dissolved-Solids Concentrations in Water From Wells in the Shallow Zone
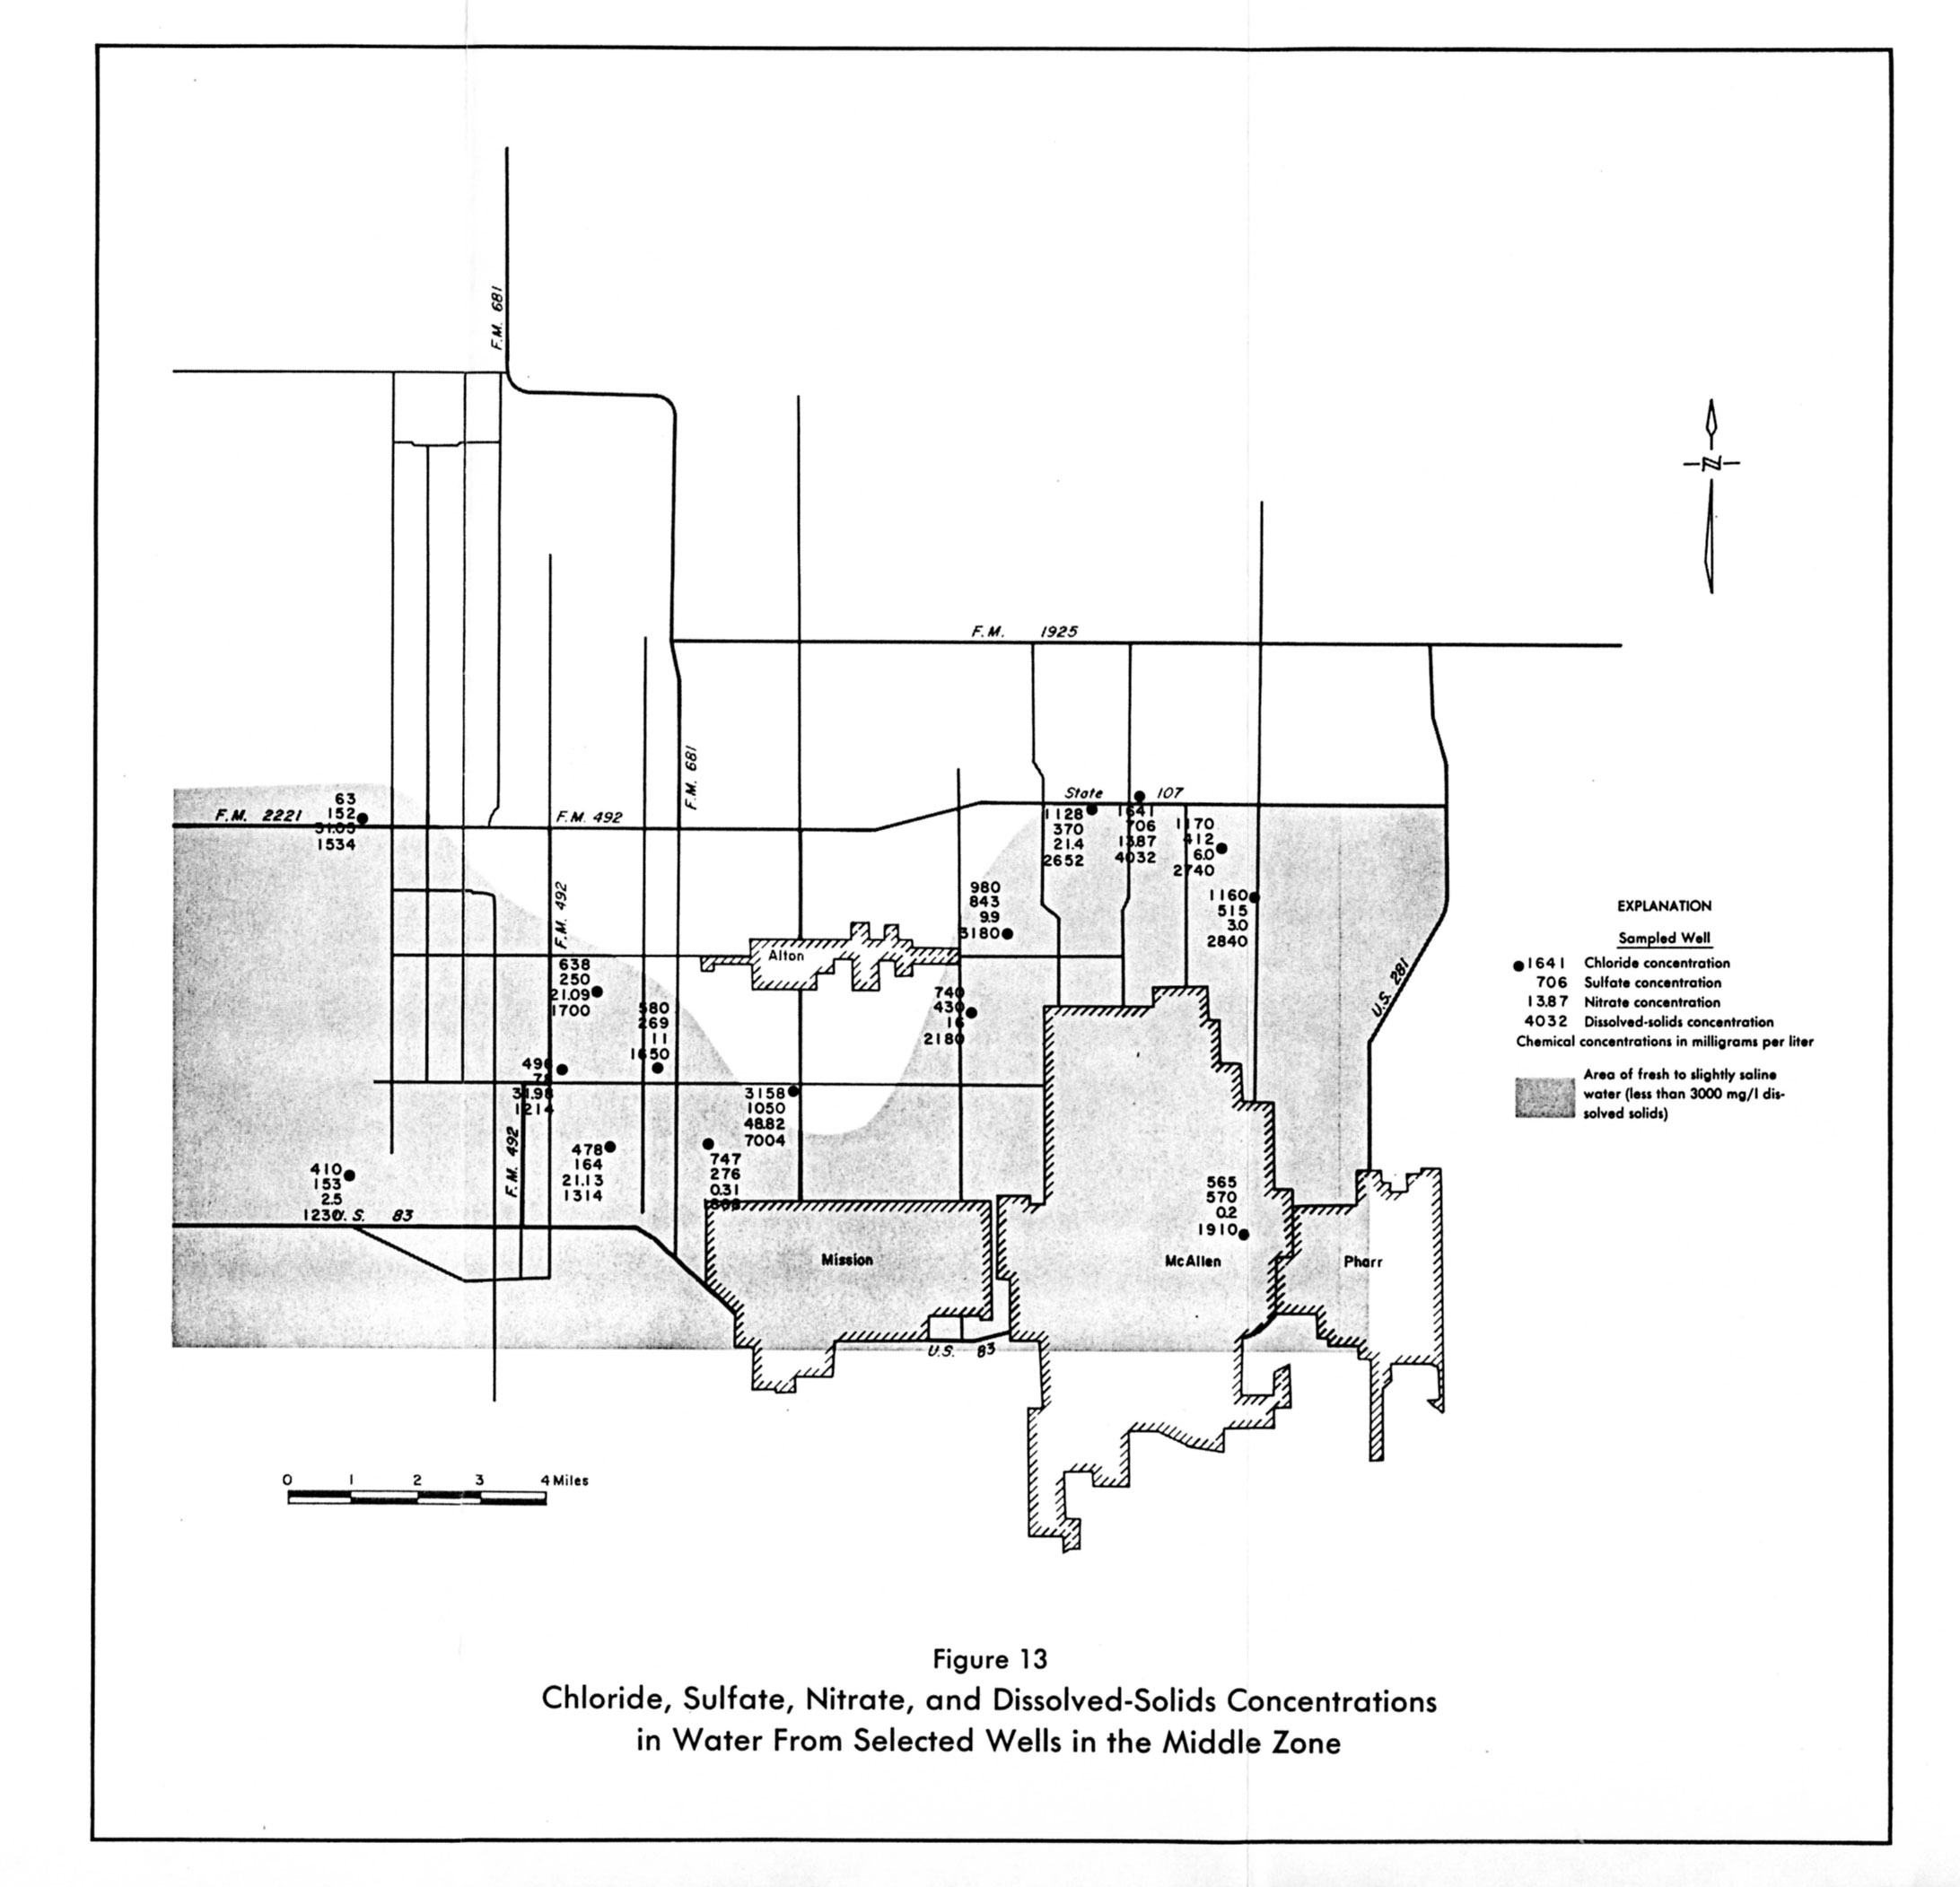
- Figure 13: Chloride, Sulfate, Nitrate, and Dissolved-Solids Concentrations in Water From Wells in the Middle Zone
- Figure 14: Chloride, Sulfate, Nitrate, and Dissolved-Solids Concentrations in Water From Wells in the Lower Zone
- Figure 16: Approximate Altitude of Water Levels in Wells in the Shallow Zone, 1979-1983