Report 155 by J.B. Wesselman, U.S. Geological Survey | August 1972
- Report 155 - Ground-Water Resources of Fort Bend County, Texas
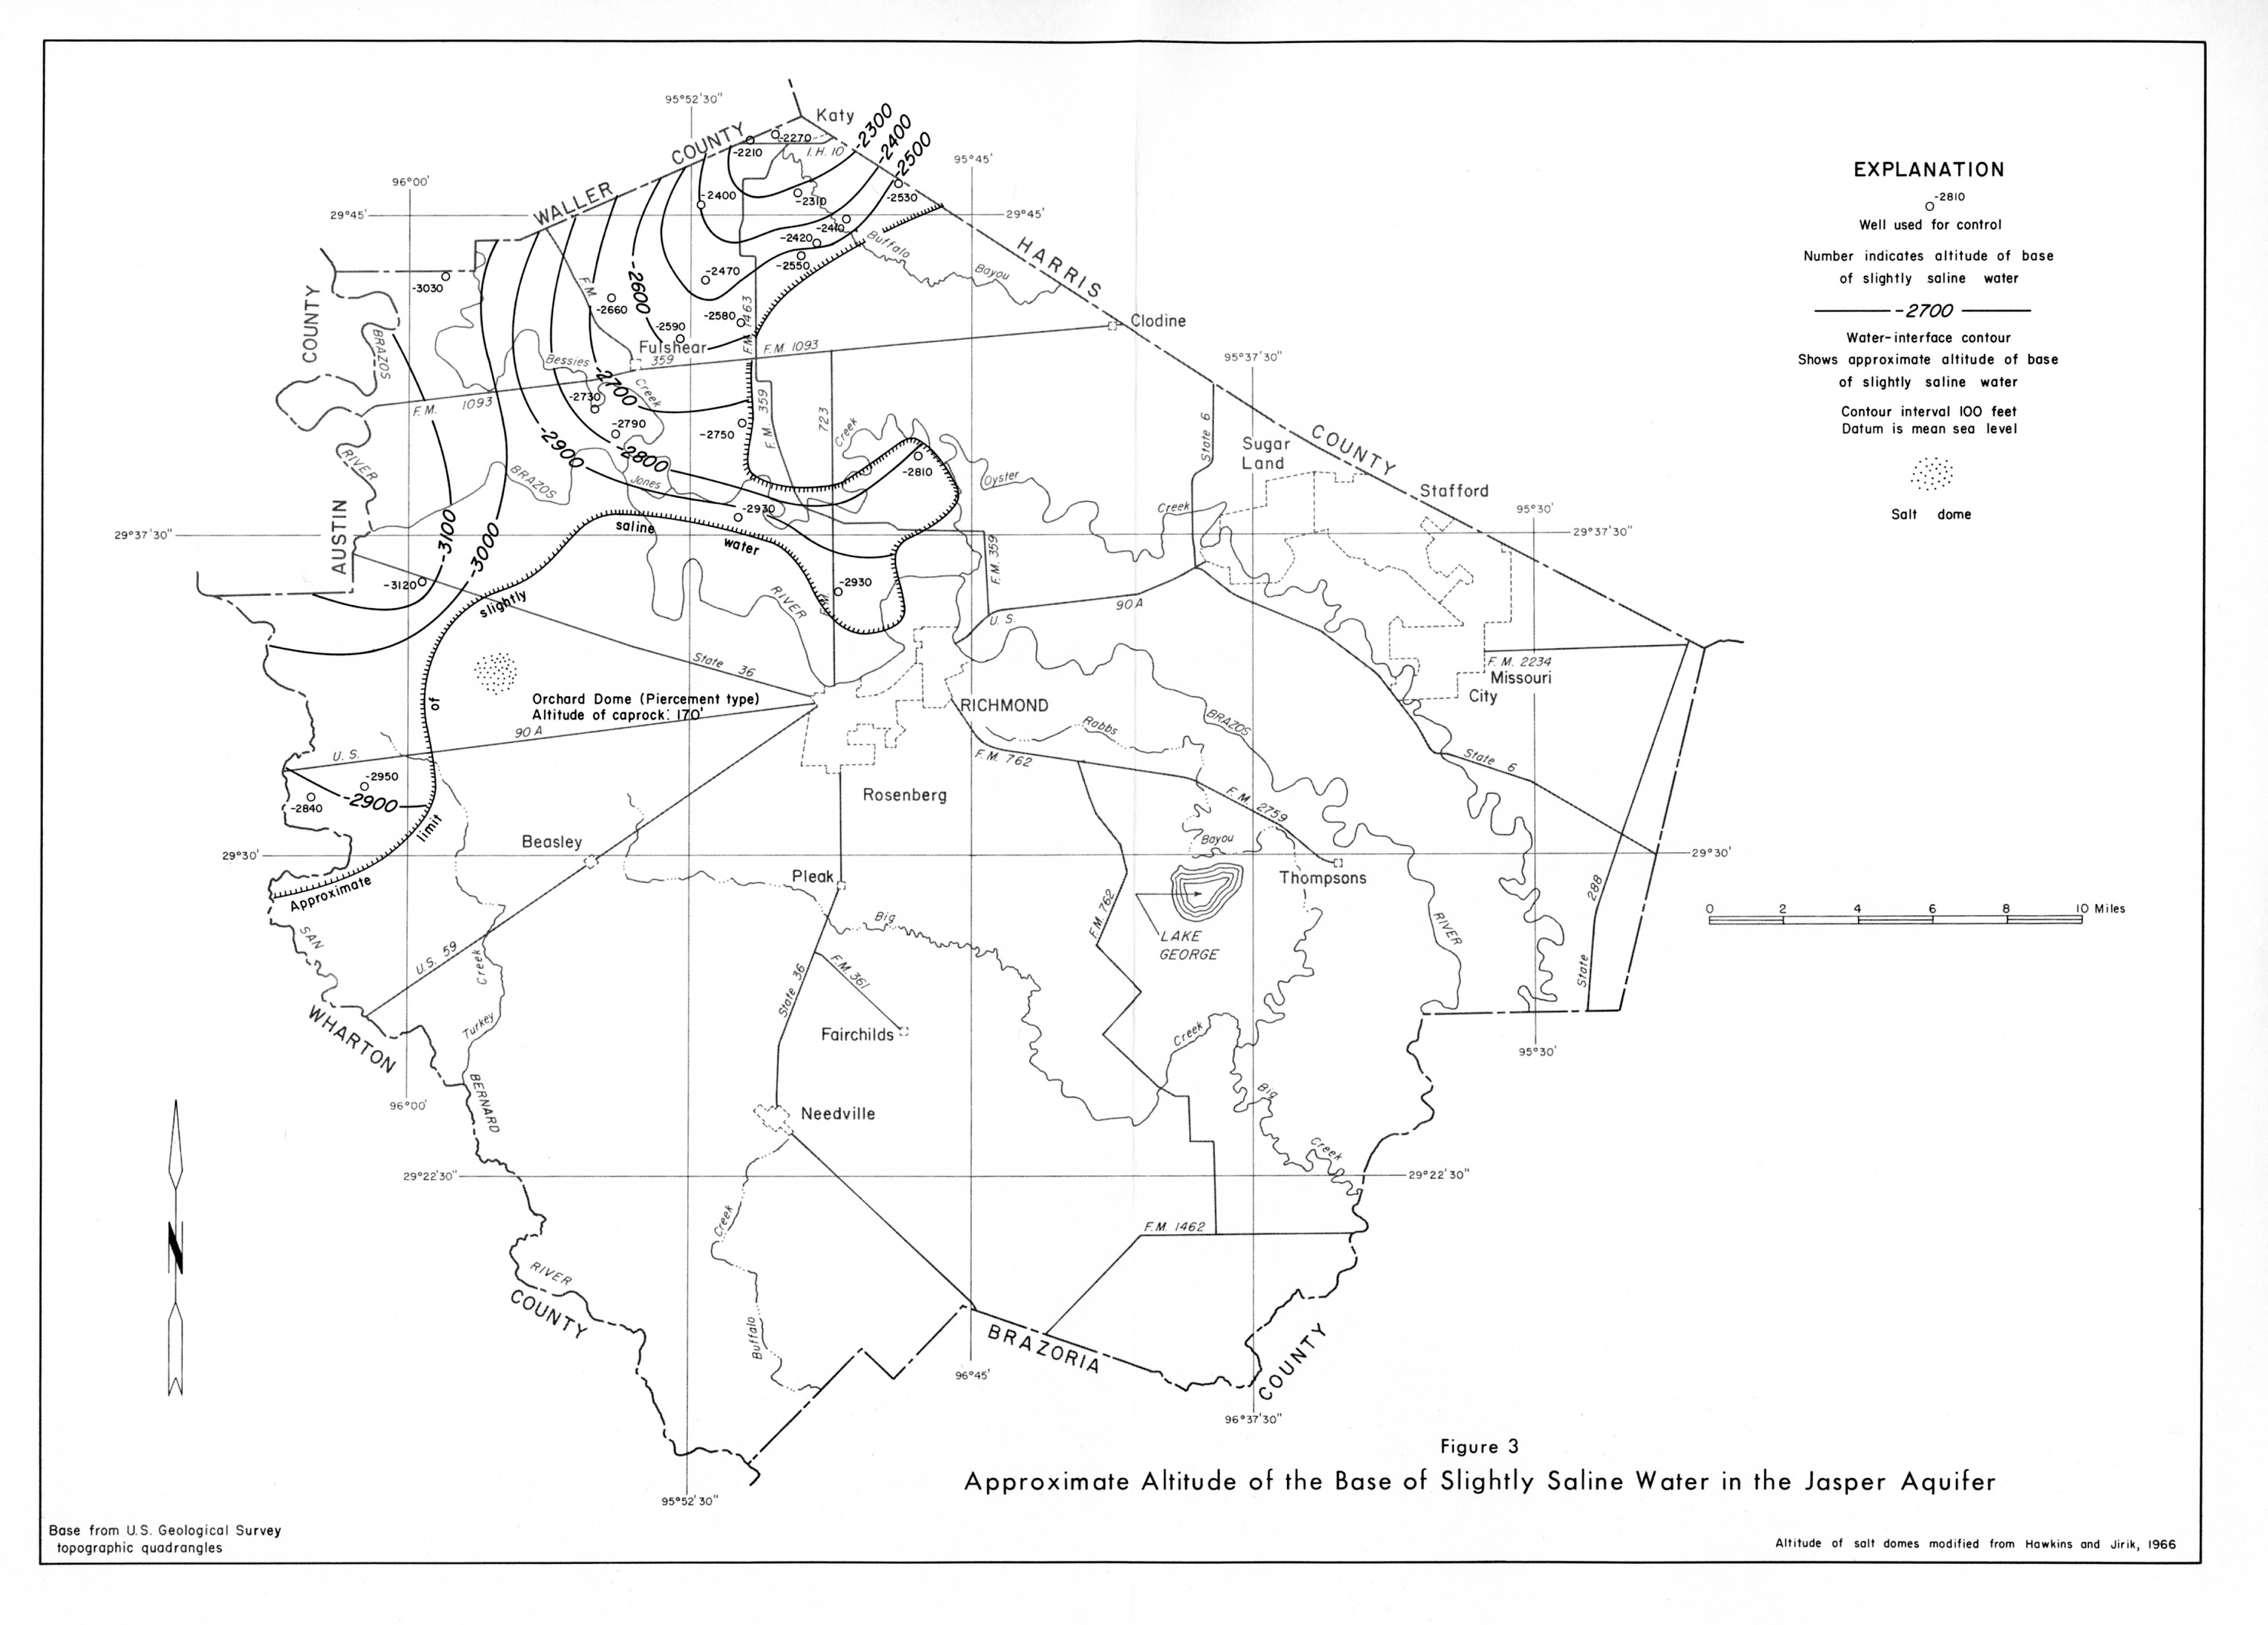
- Figure 3 - Approximate Altitude of the Base of Slightly Saline Water in the Jasper Aquifer
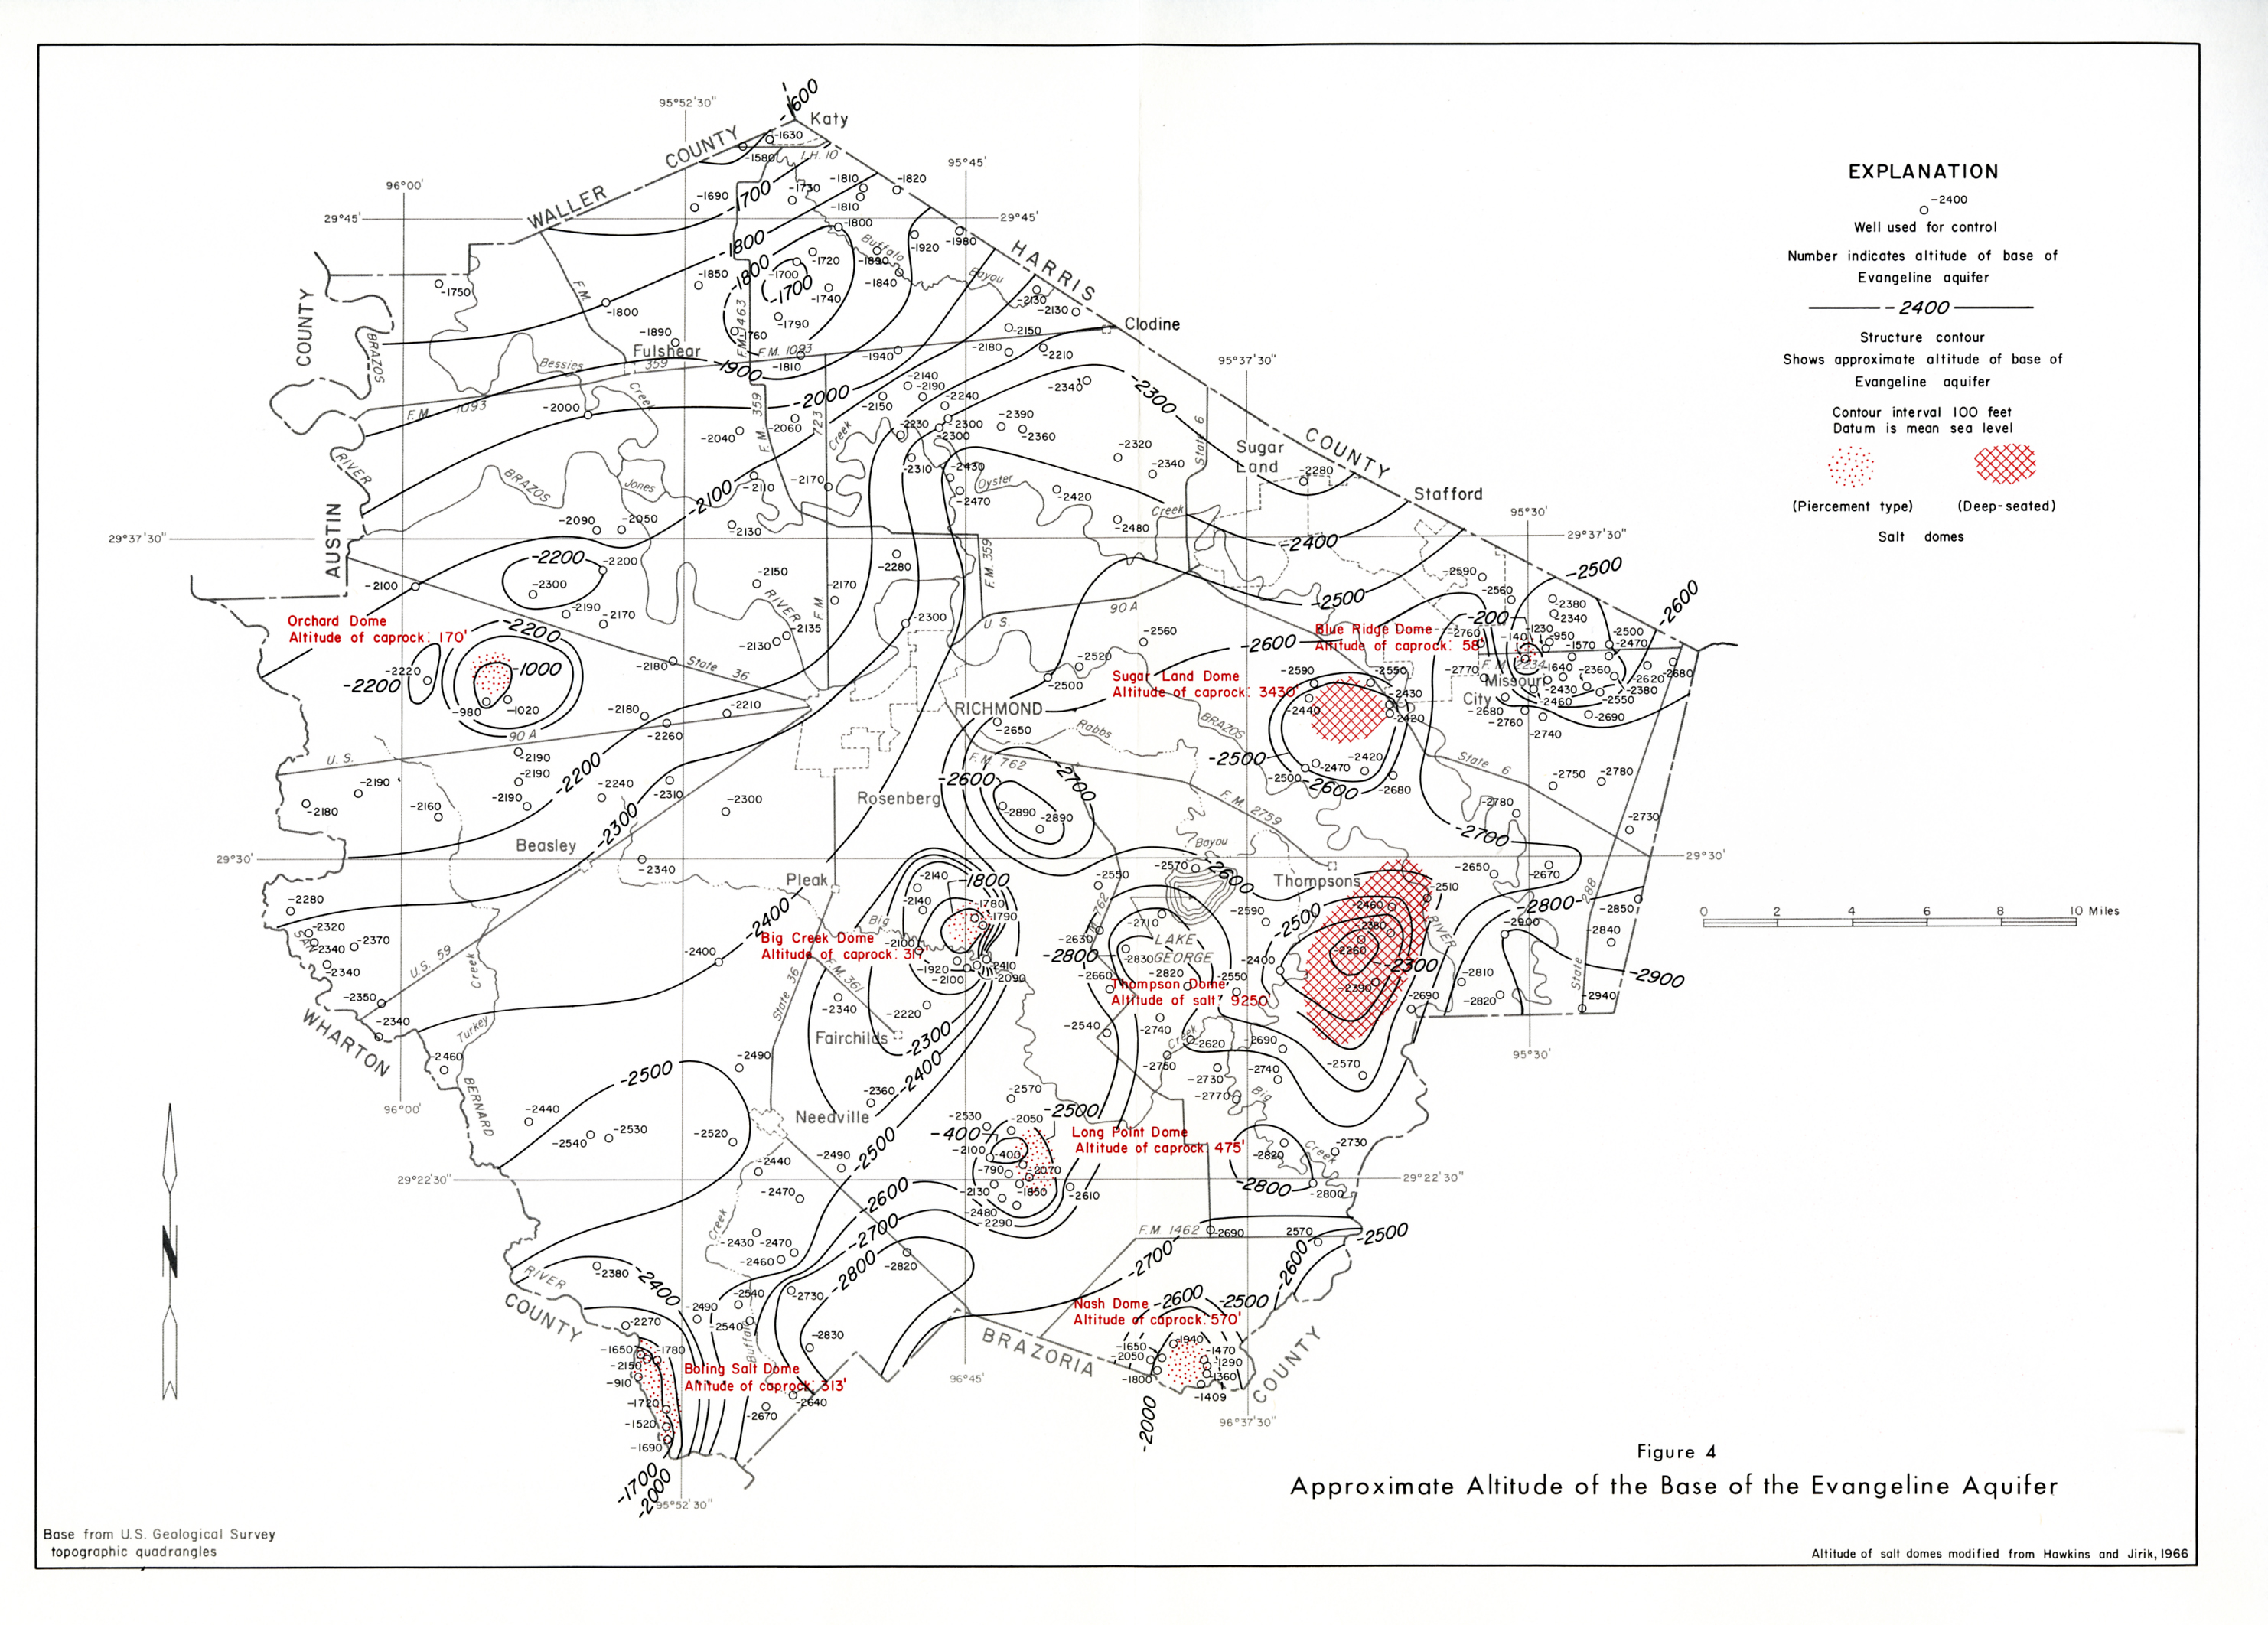
- Figure 4 - Approximate Altitude of the Base of the Evangeline Aquifer
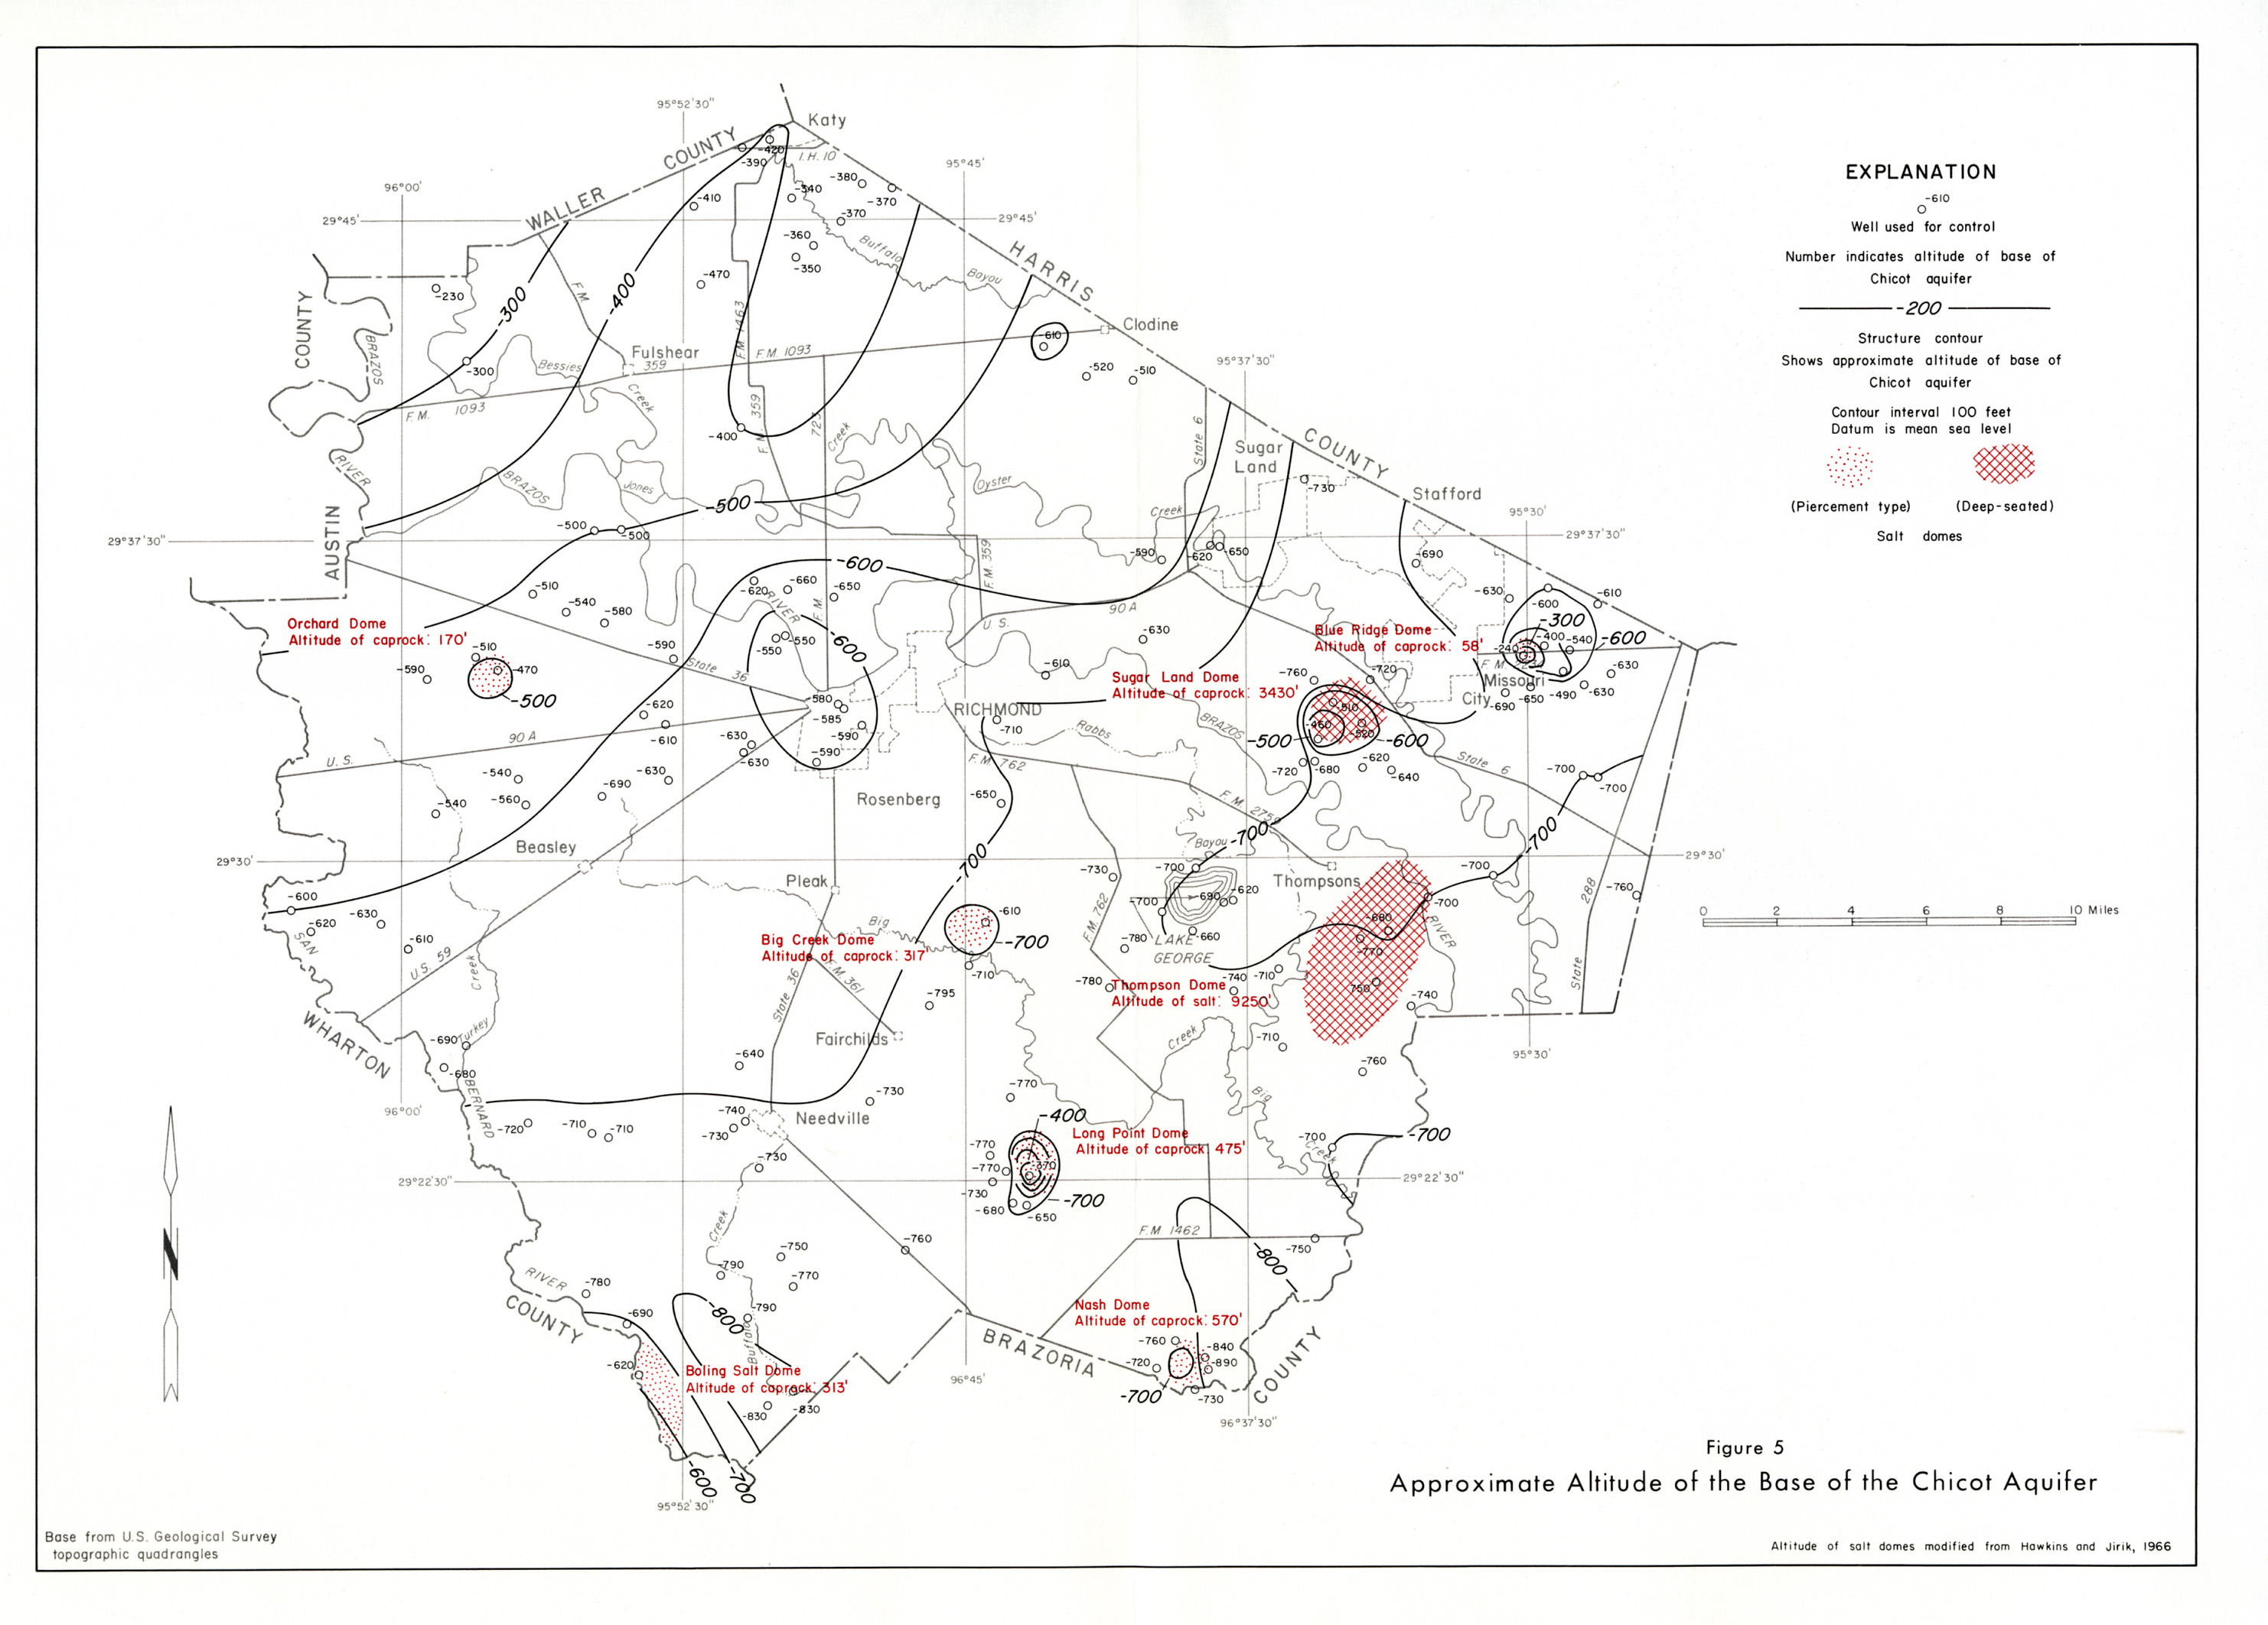
- Figure 5 - Approximate Altitude of the Base of the Chicot Aquifer
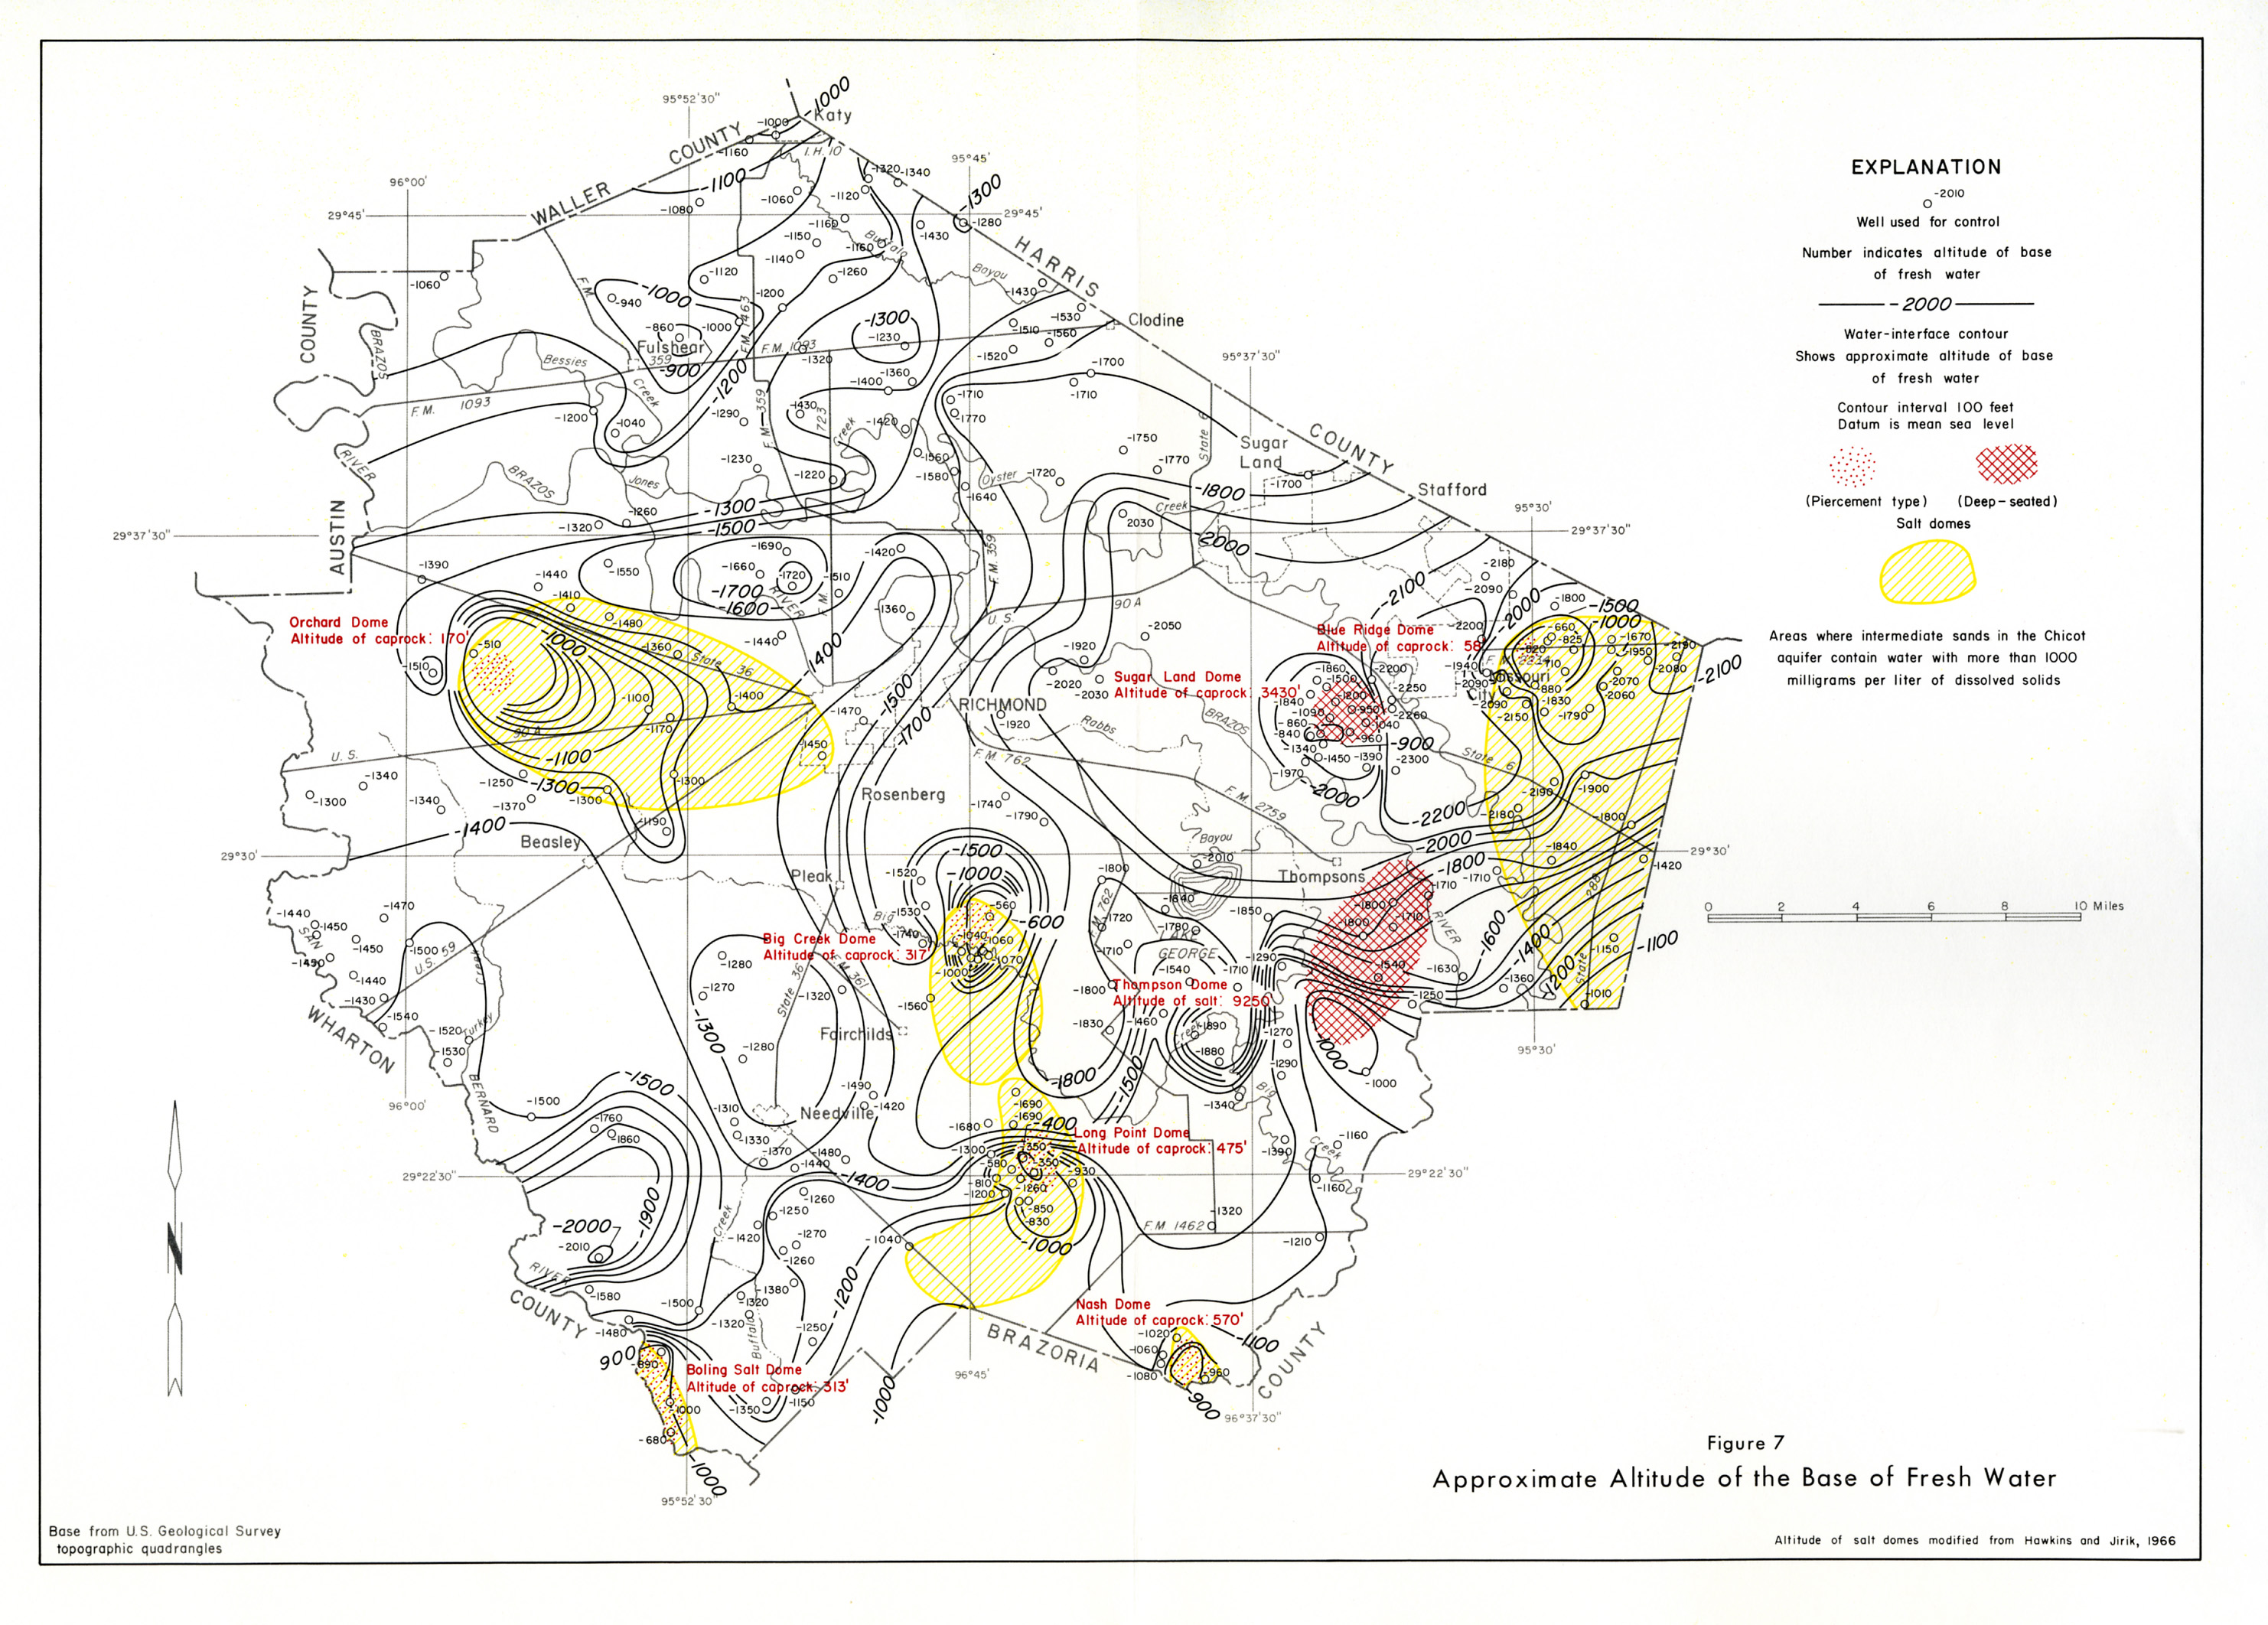
- Figure 7 - Approximate Altitude of the Base of Fresh Water
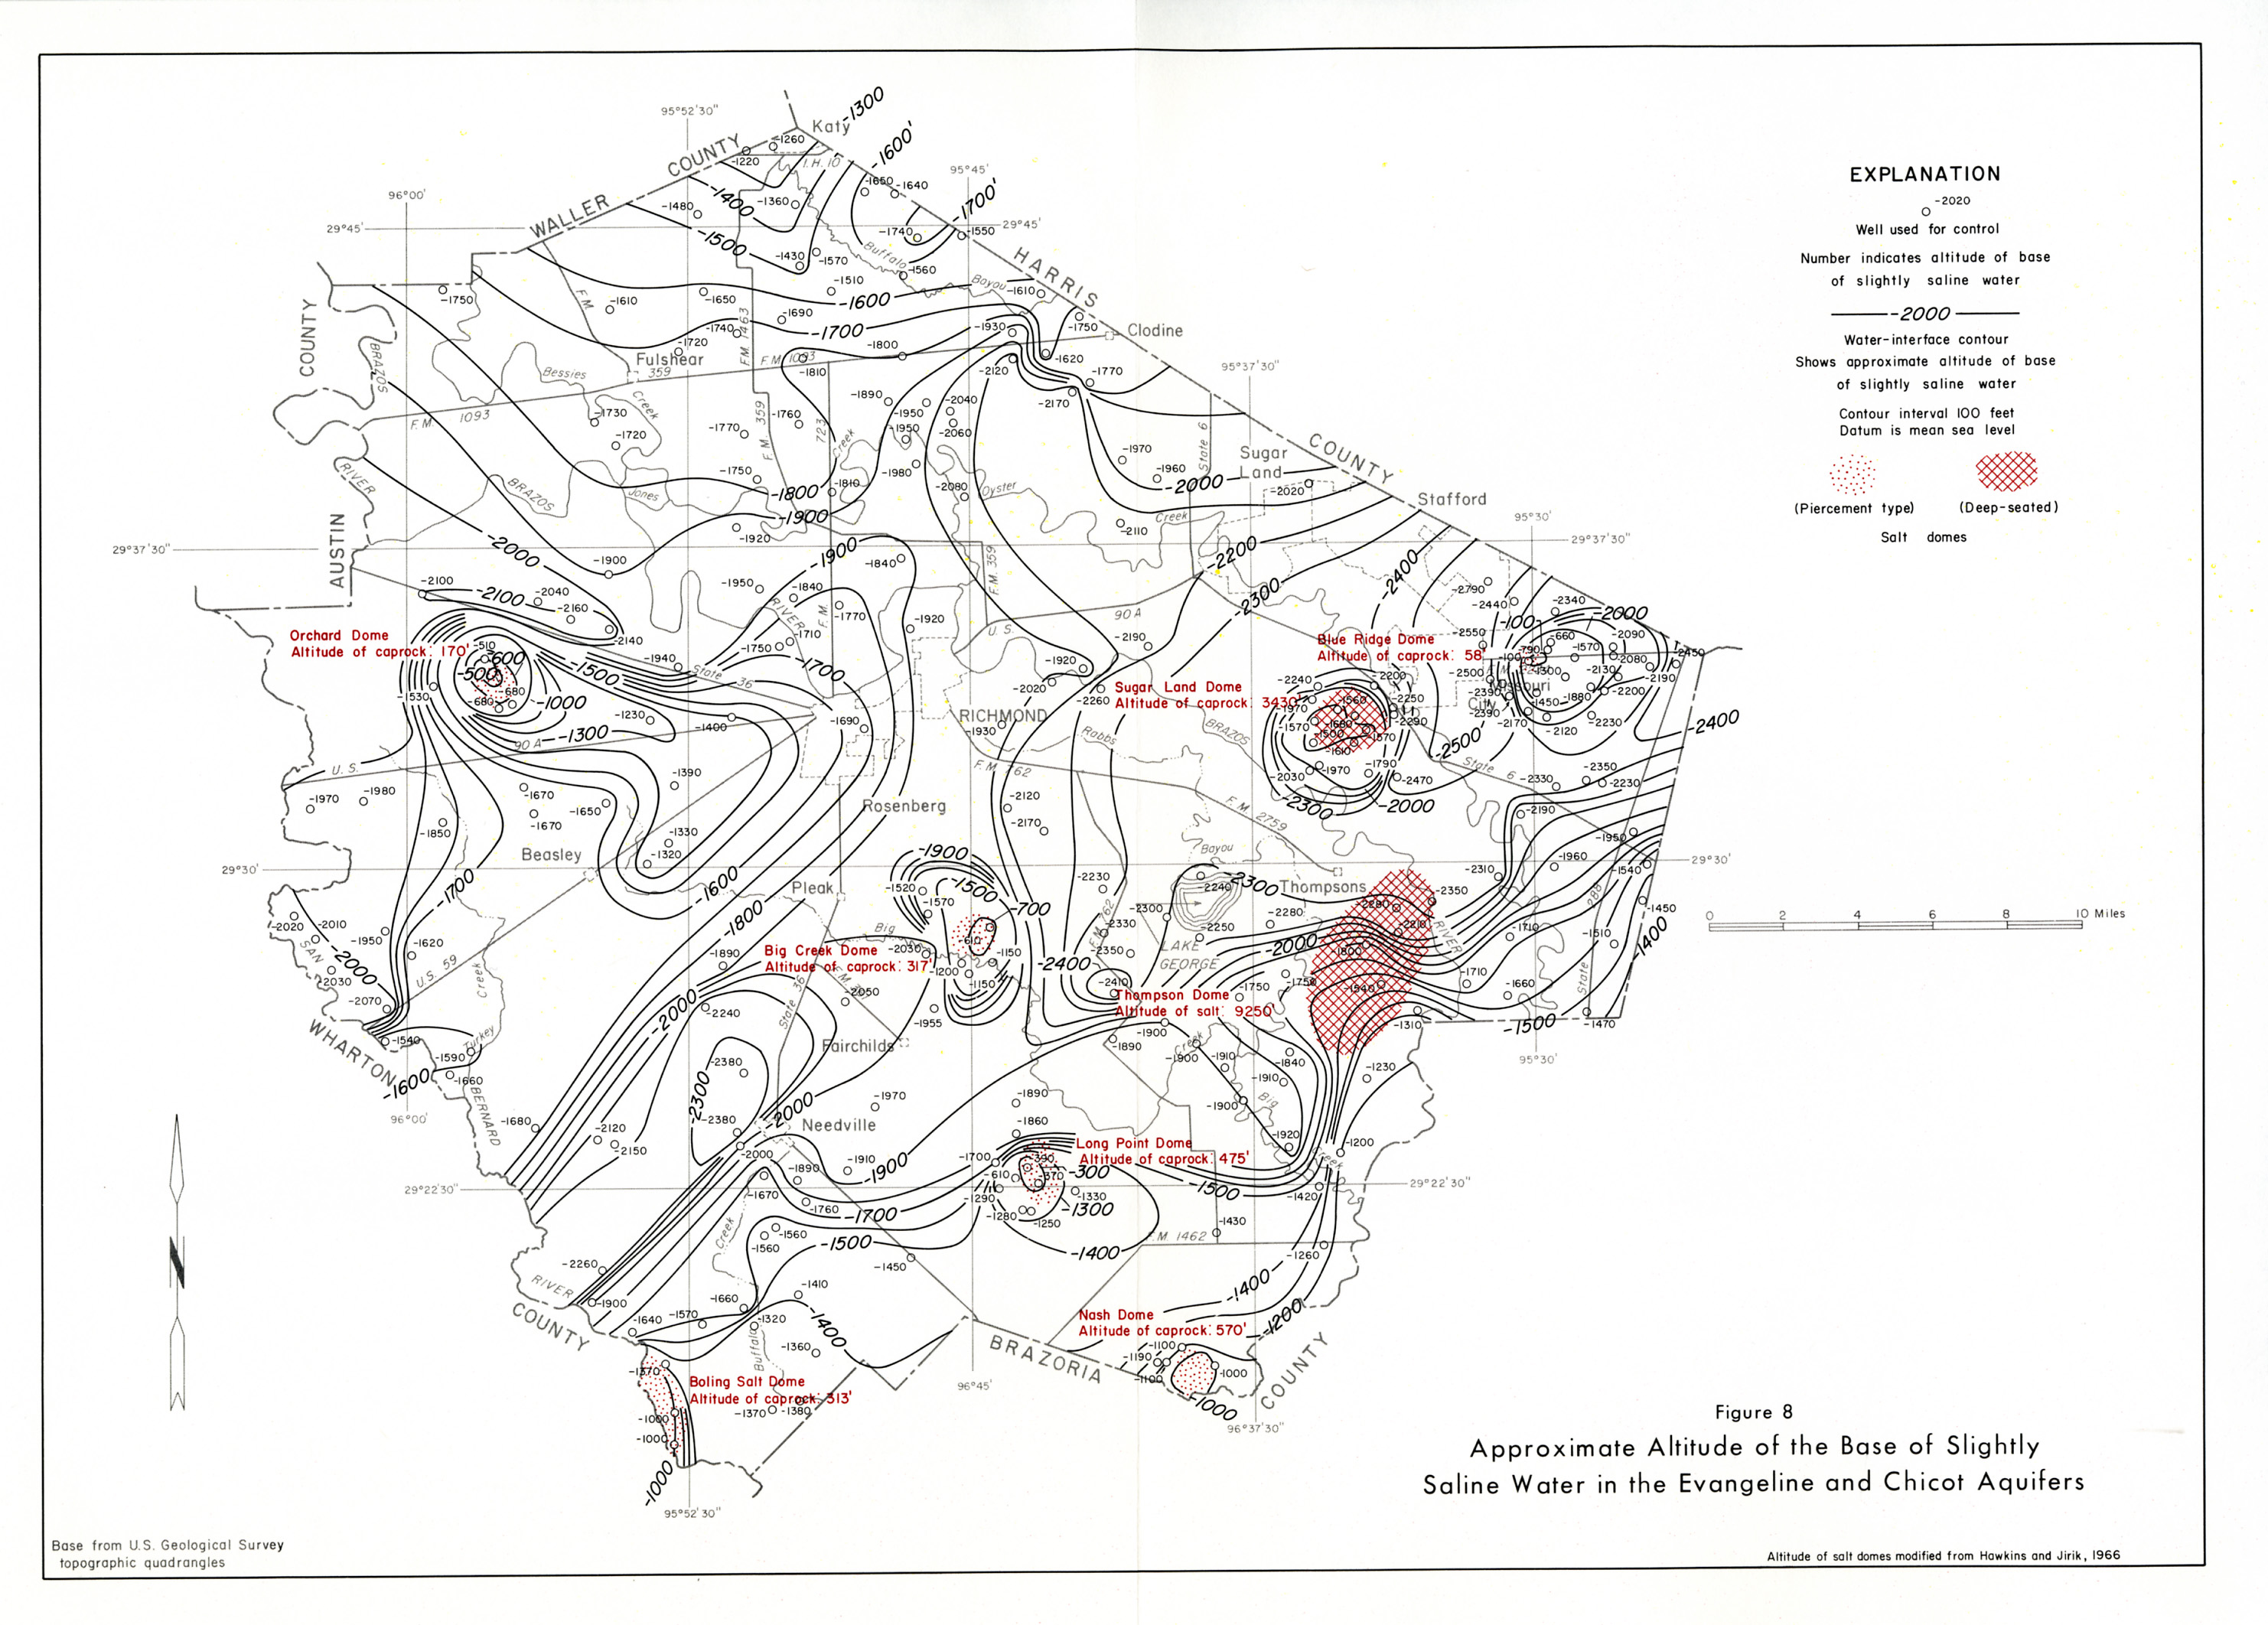
- Figure 8 - Approximate Altitude of the Base of Slightly Saline Water in the Evangeline and Chicot Aquifers
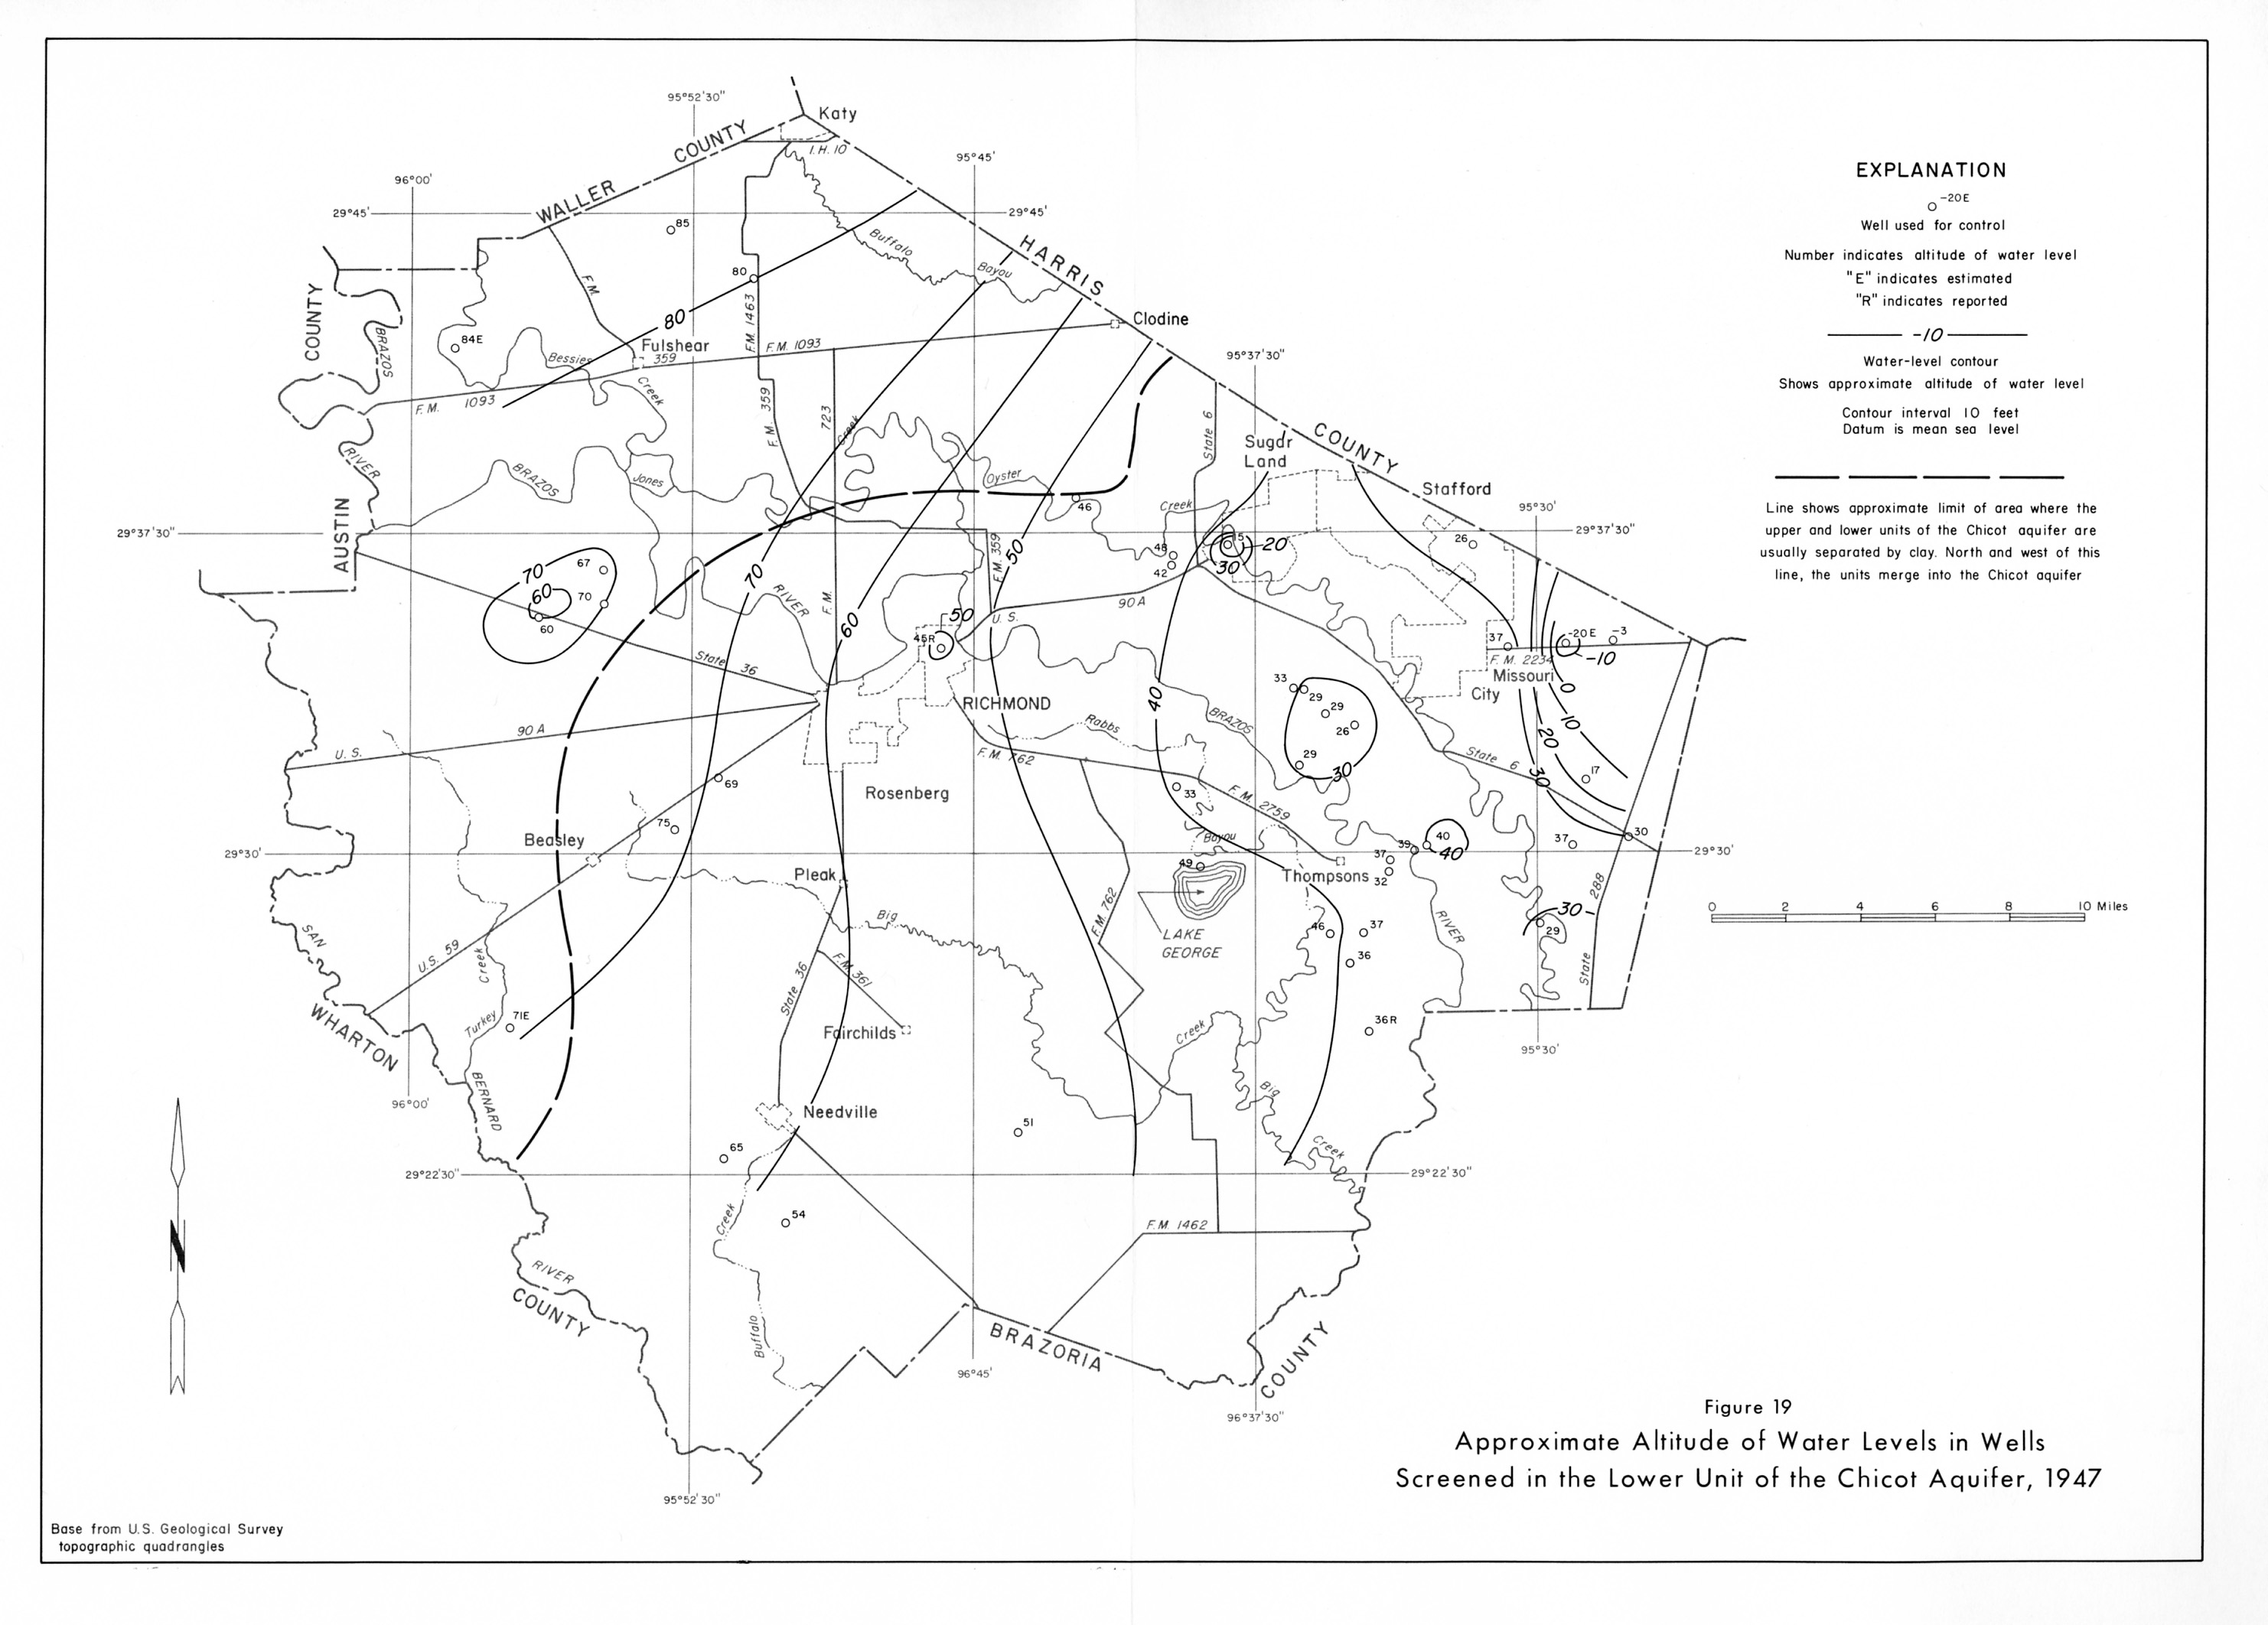
- Figure 19 - Approximate Altitude of Water Levels in Wells Screened in the Lower Unit of the Chicot Aquifer, 1947
- Figure 20 - Approximate Altitude of Water Levels in Wells Screened in the Lower Unit of the Chicot Aquifer, 1968-1969
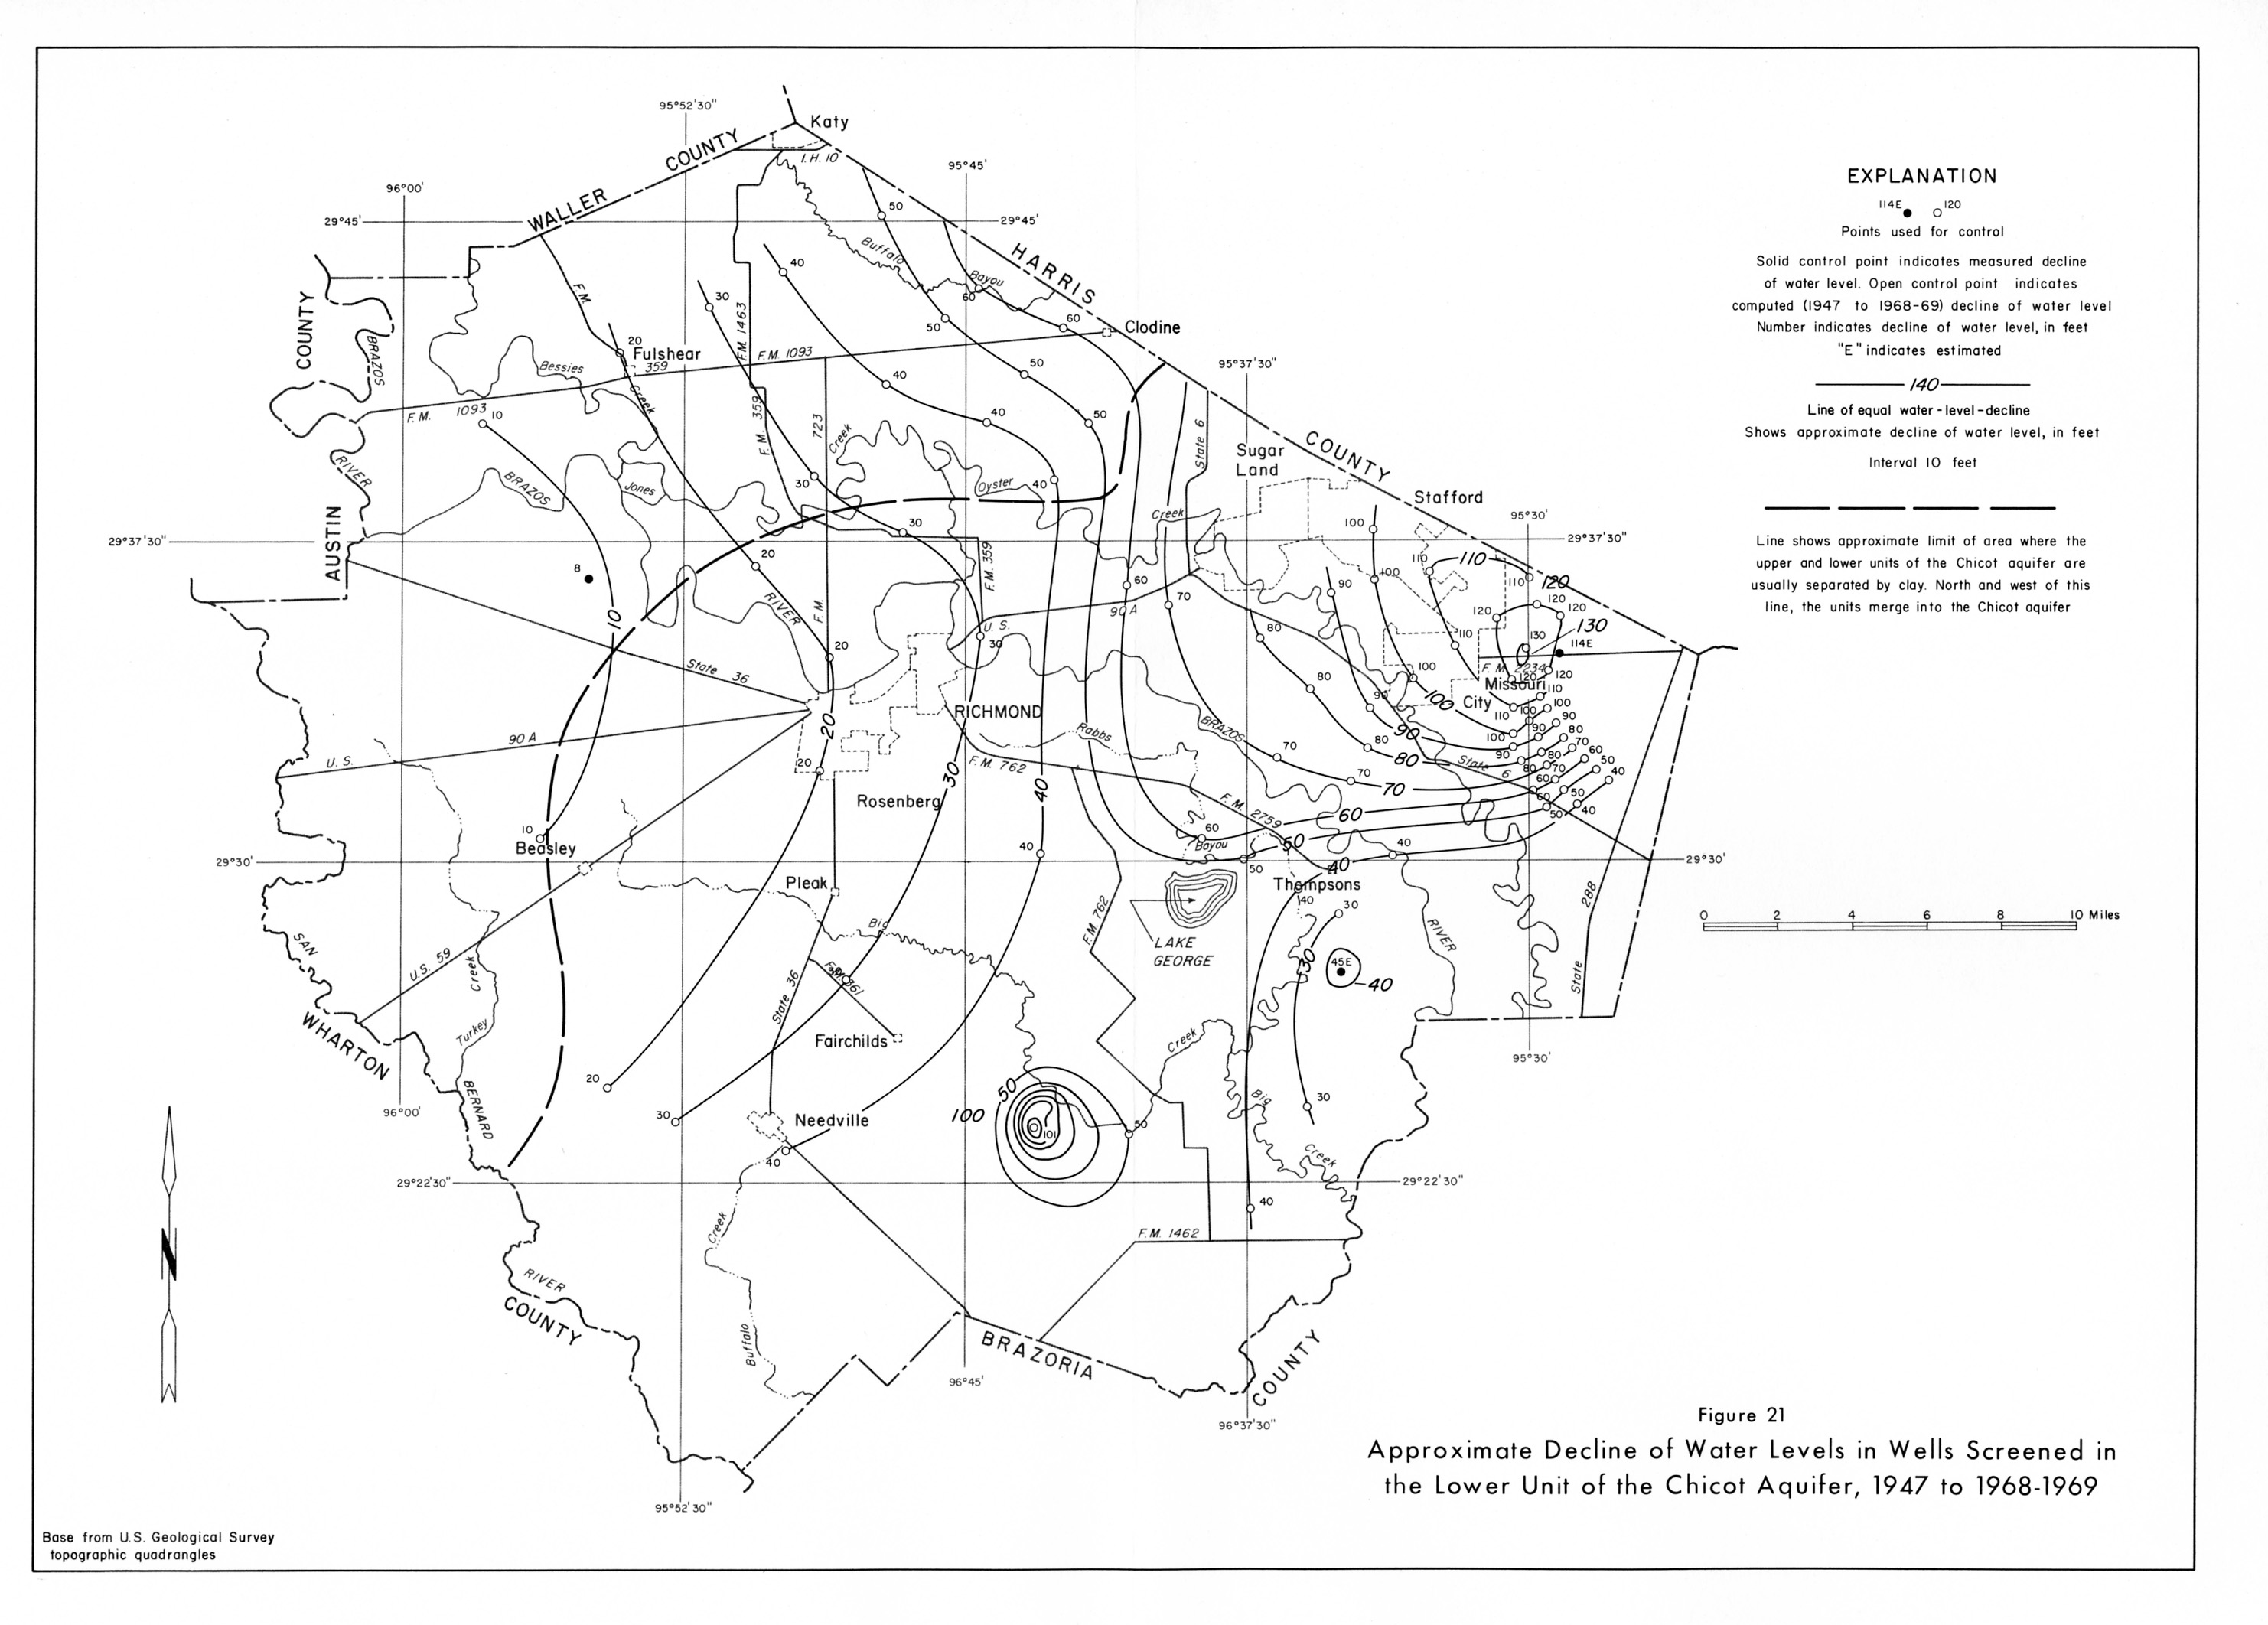
- Figure 21 - Approximate Decline of Water Levels in Wells Screened in the Lower Unit of the Chicot Aquifer, 1947 to 1968-1969
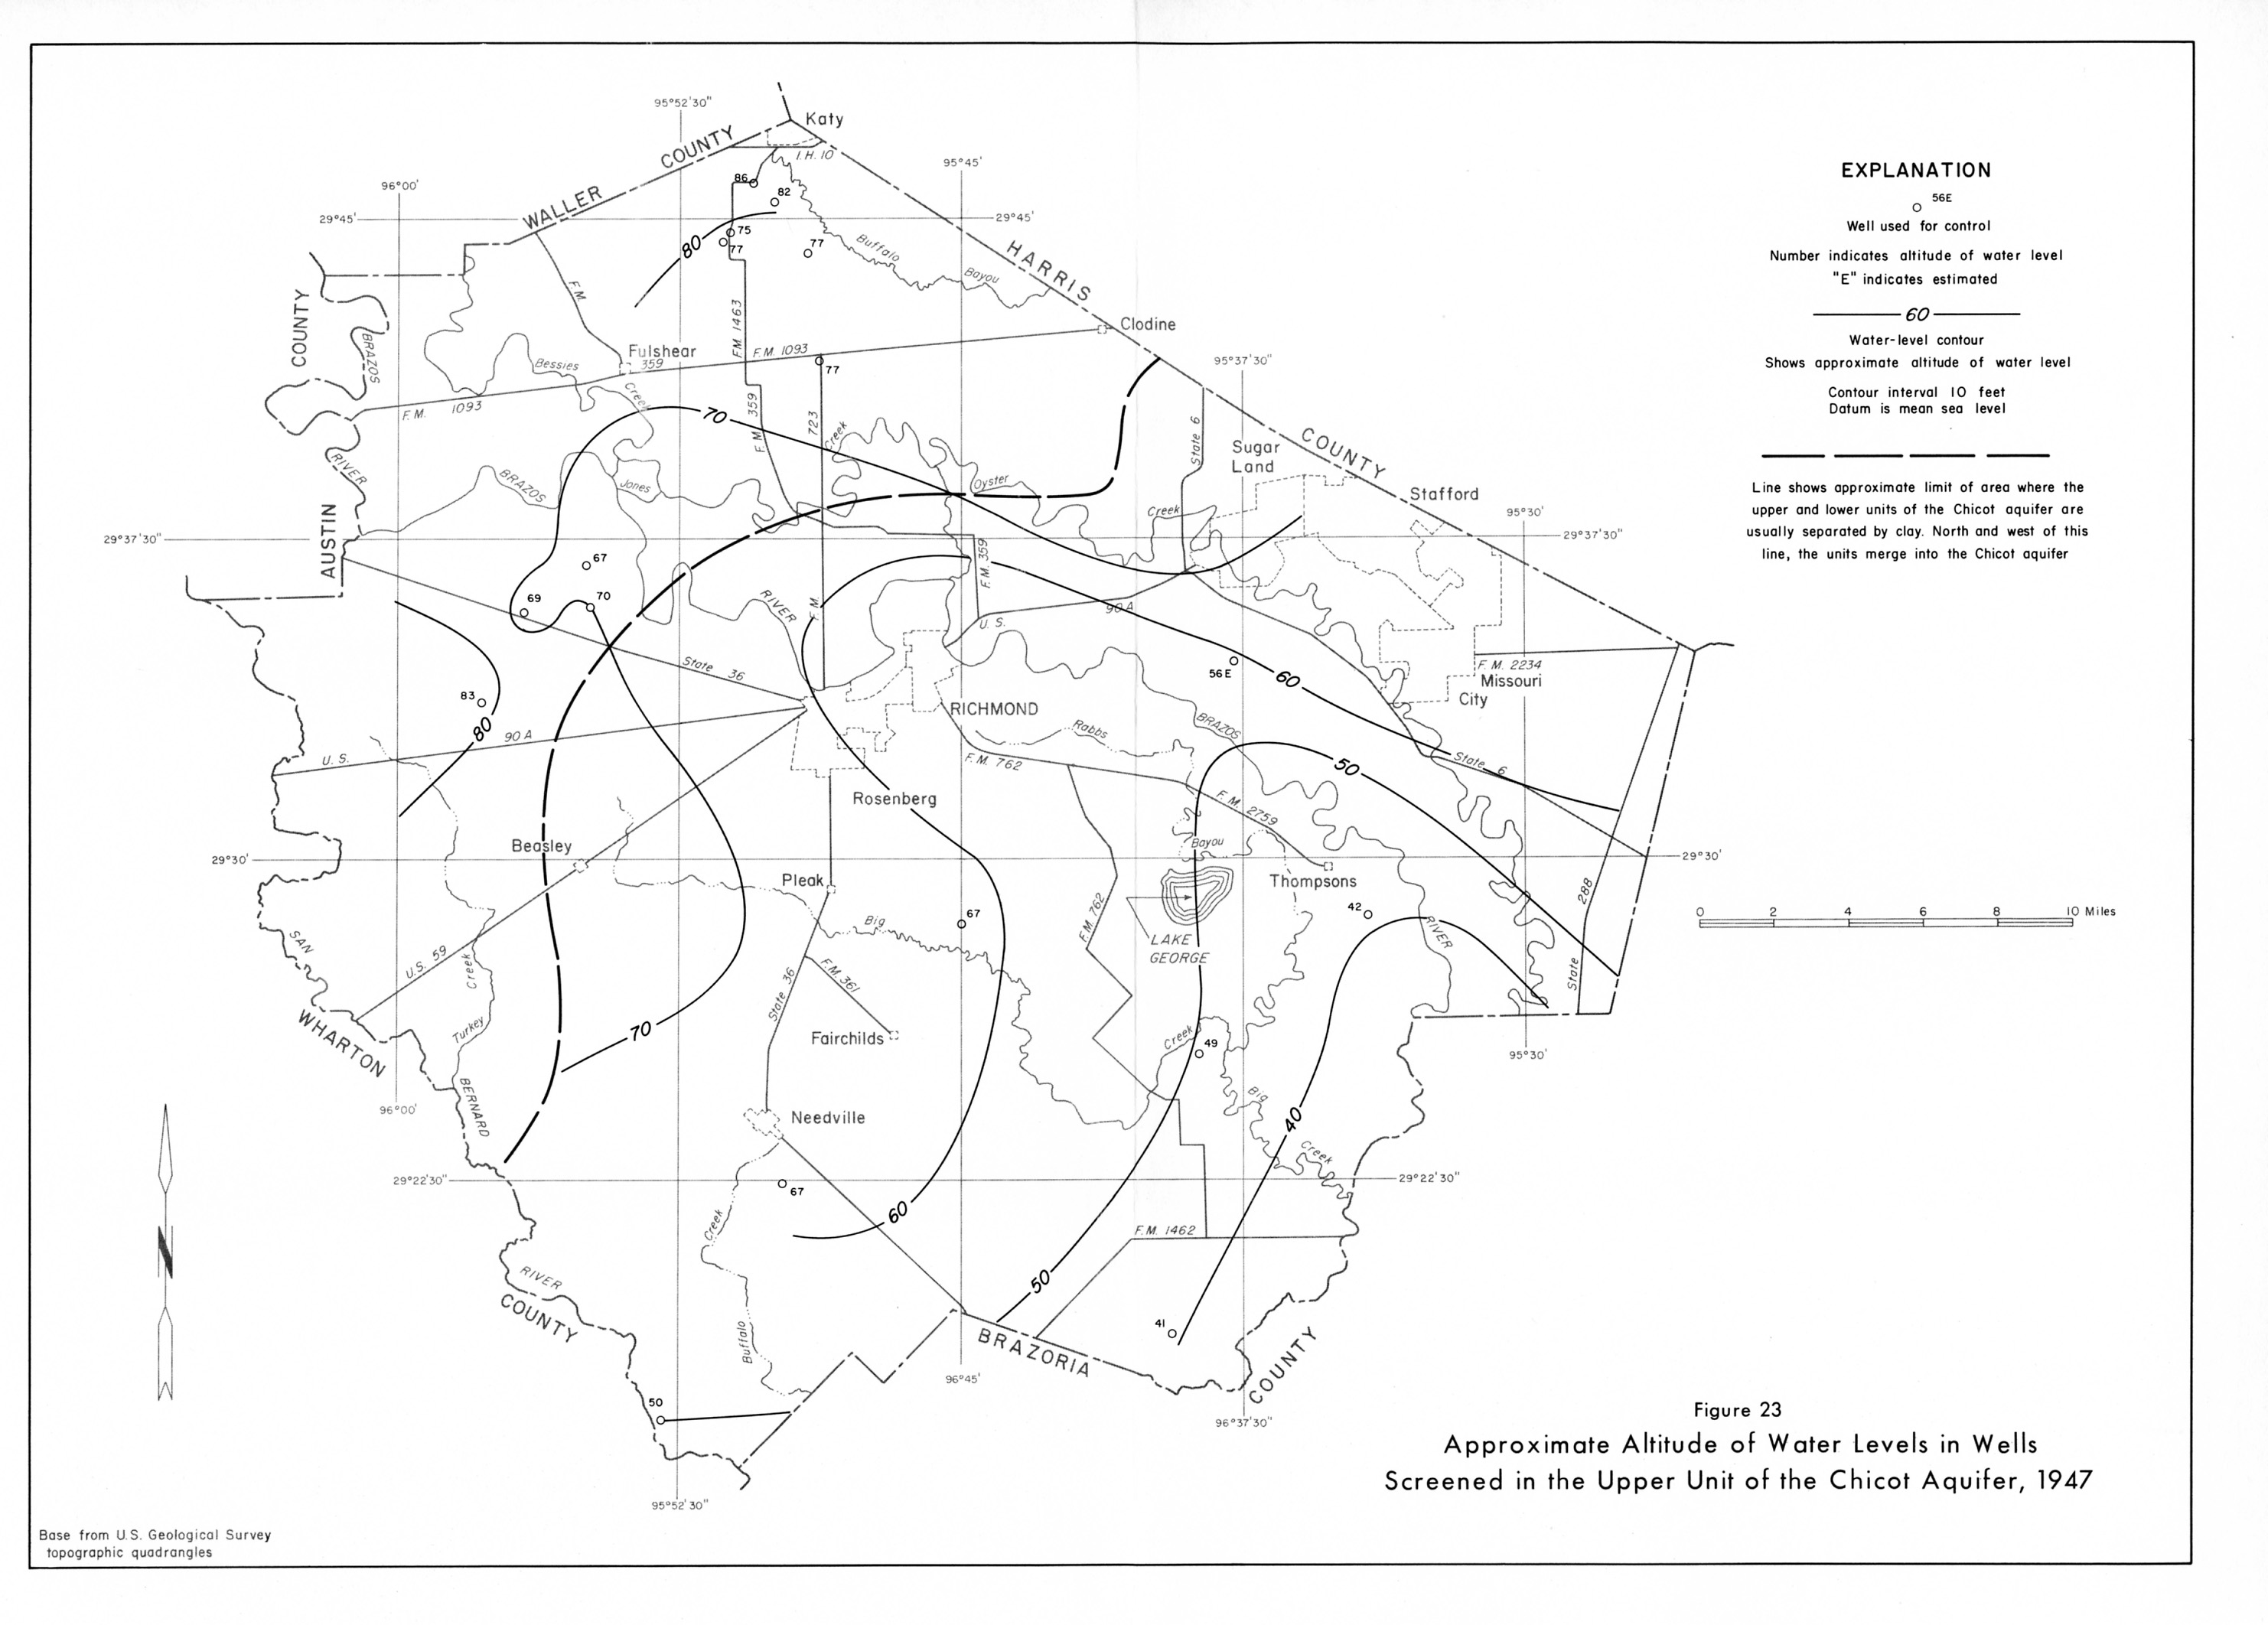
- Figure 23 - Approximate Altitude of Water Levels in Wells Screened in the Upper Unit of the Chicot Aquifer, 1947
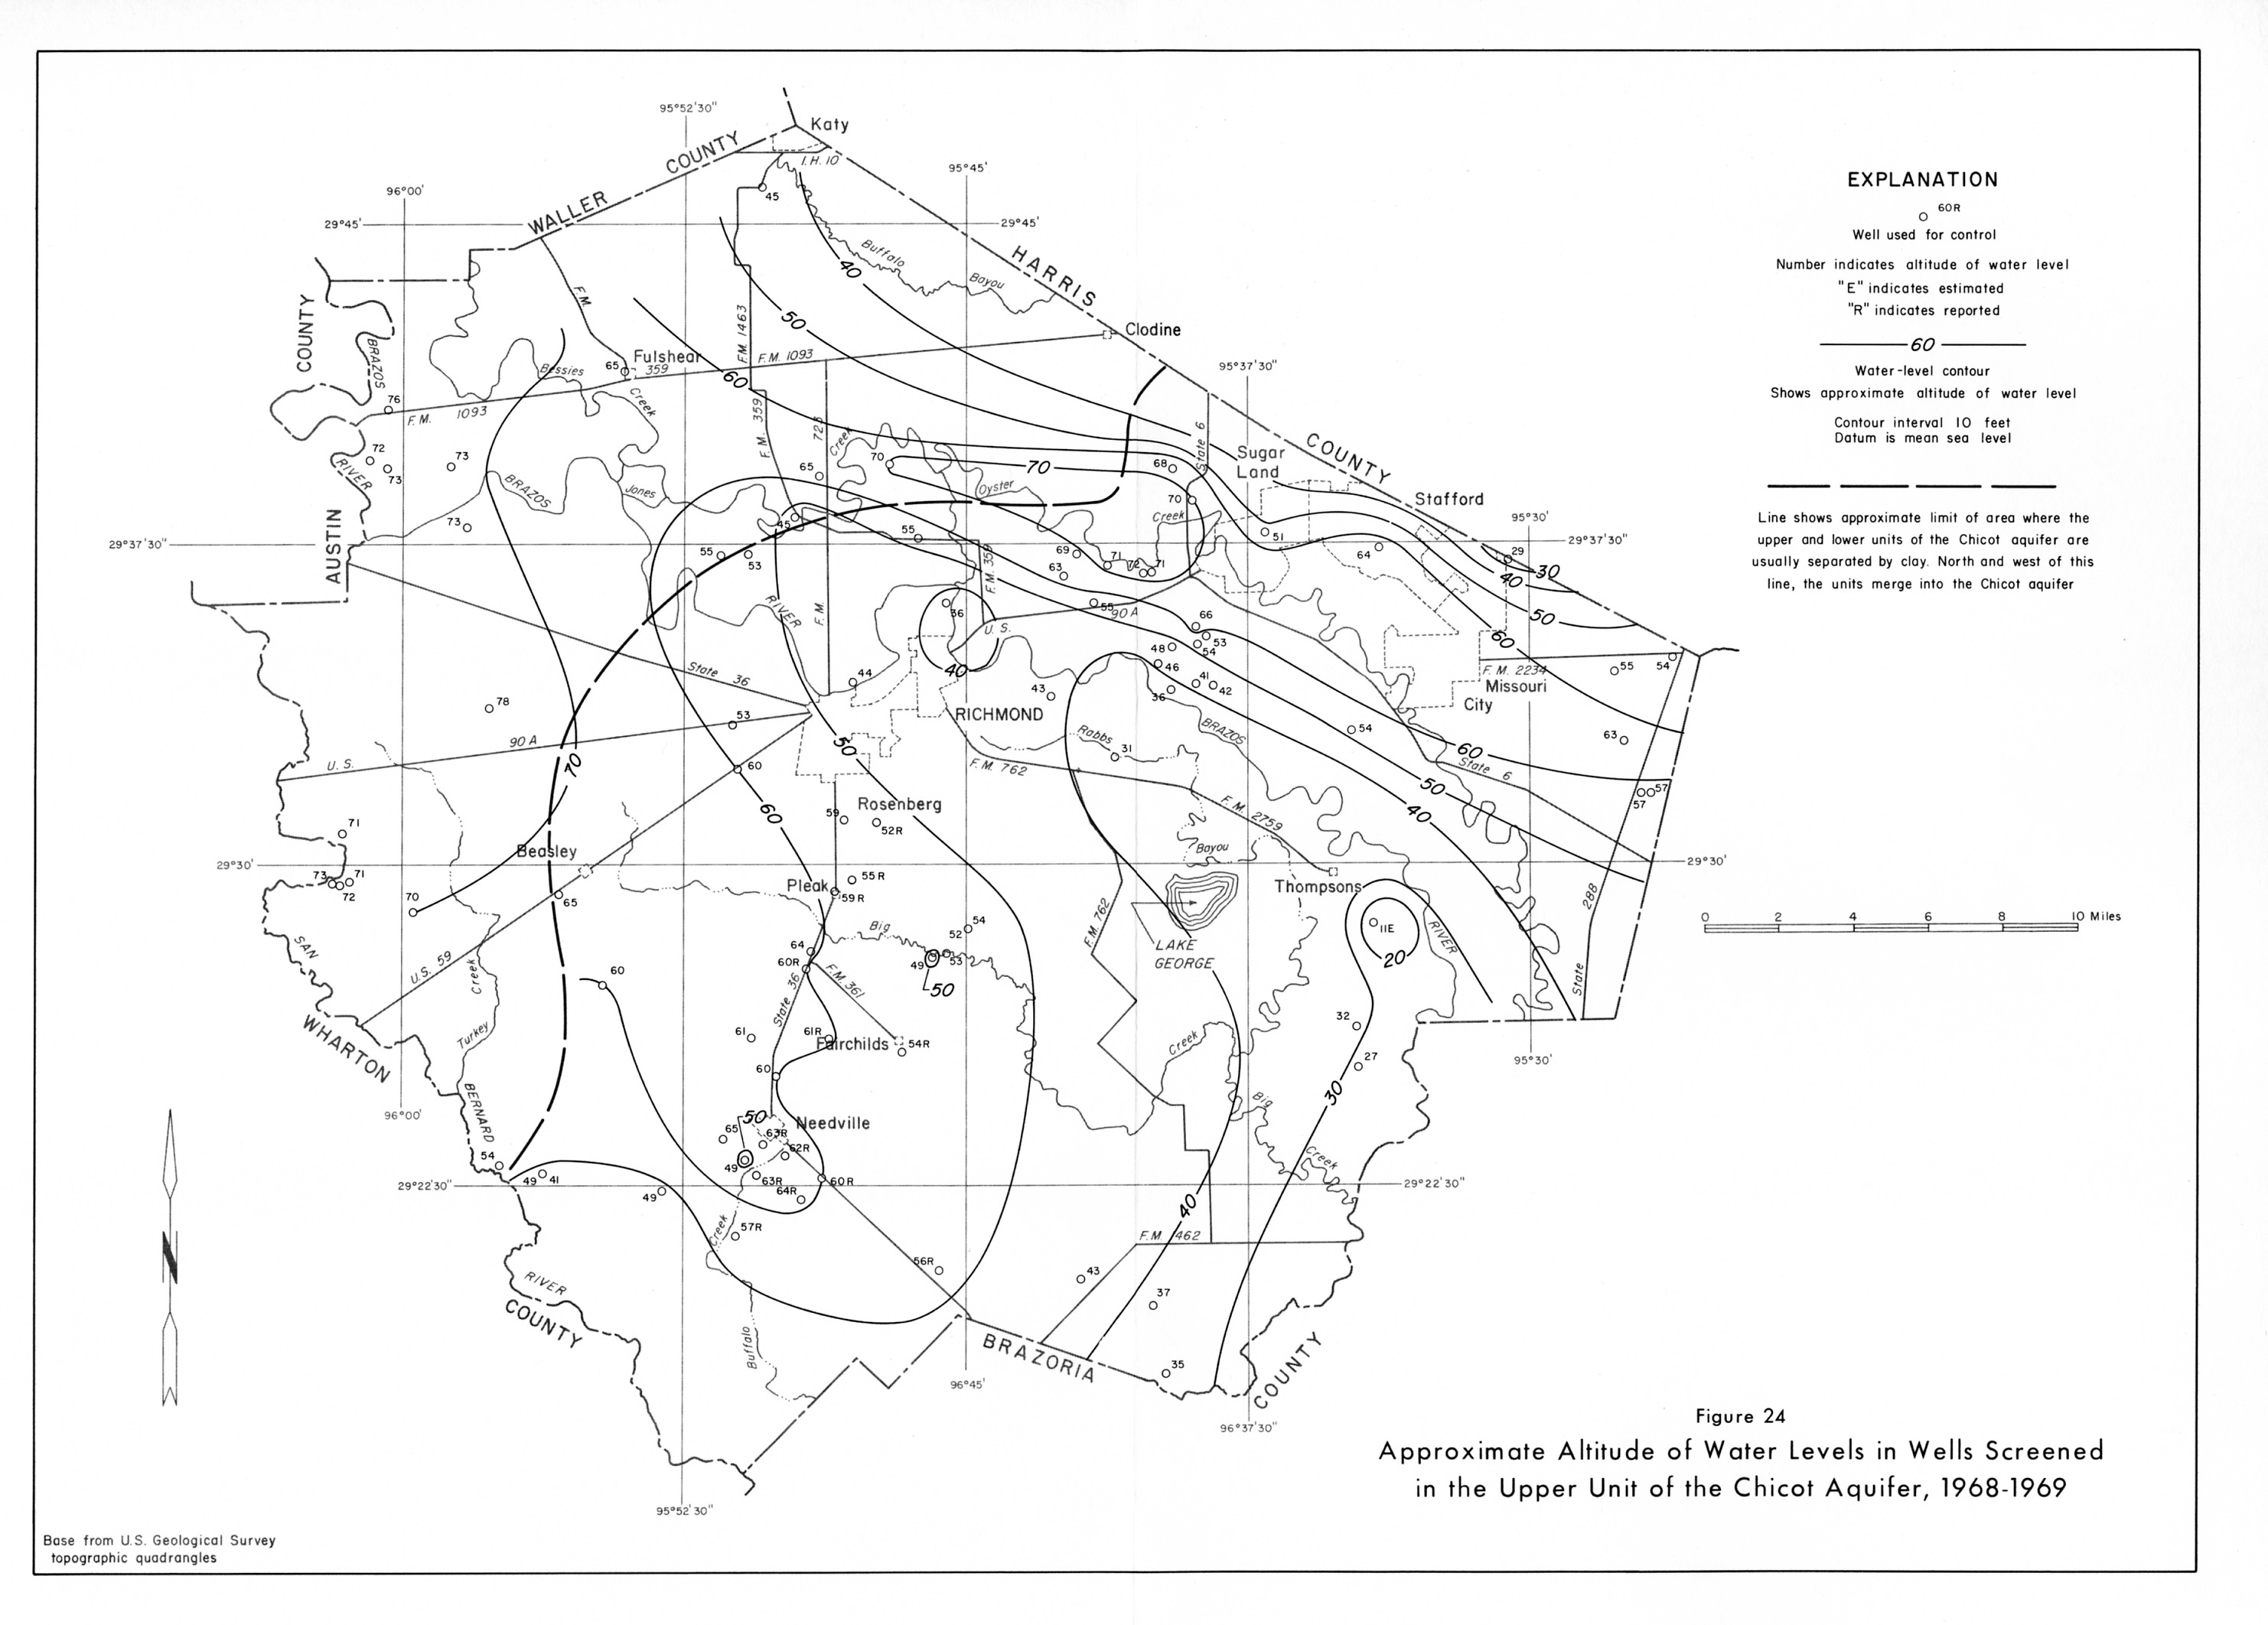
- Figure 24- Approximate Altitude of Water Levels in Wells Screened in the Upper Unit of the Chicot Aquifer, 1968-1969
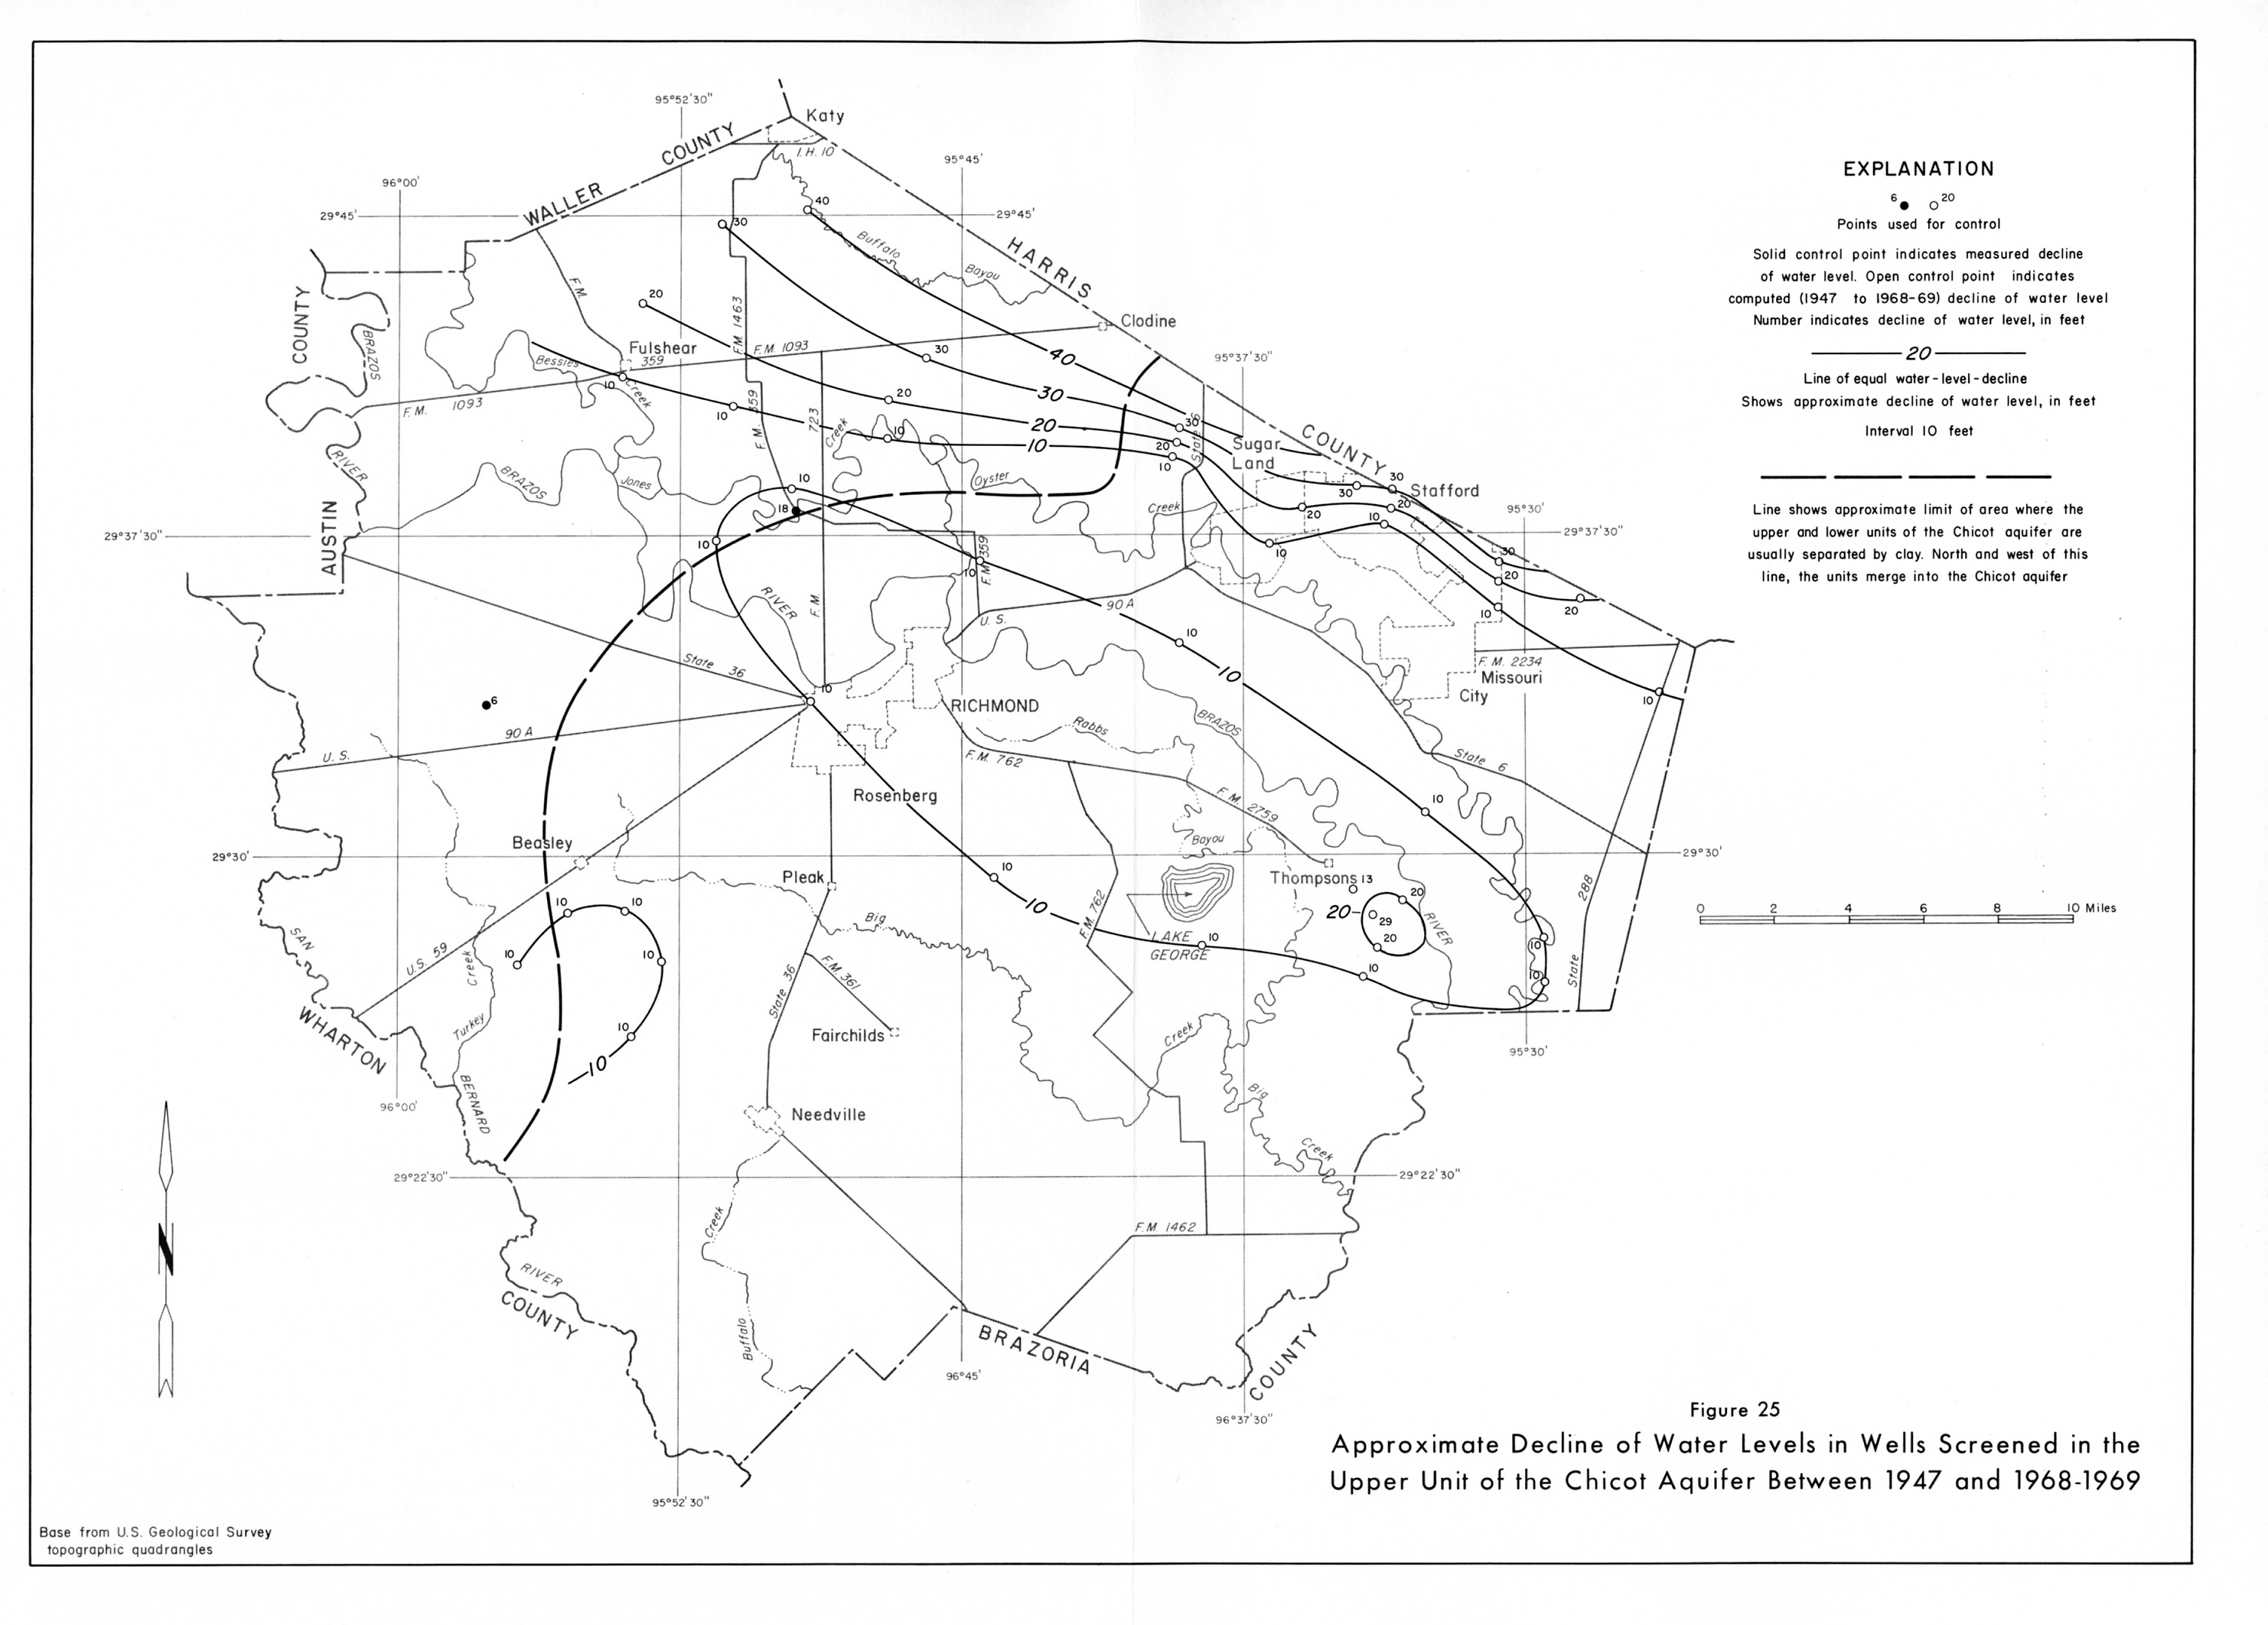
- Figure 25 - Approximate Decline of Water Levels in Wells Screened in the Upper Unit of the Chicot Aquifer Between 1947 and 1968-1969
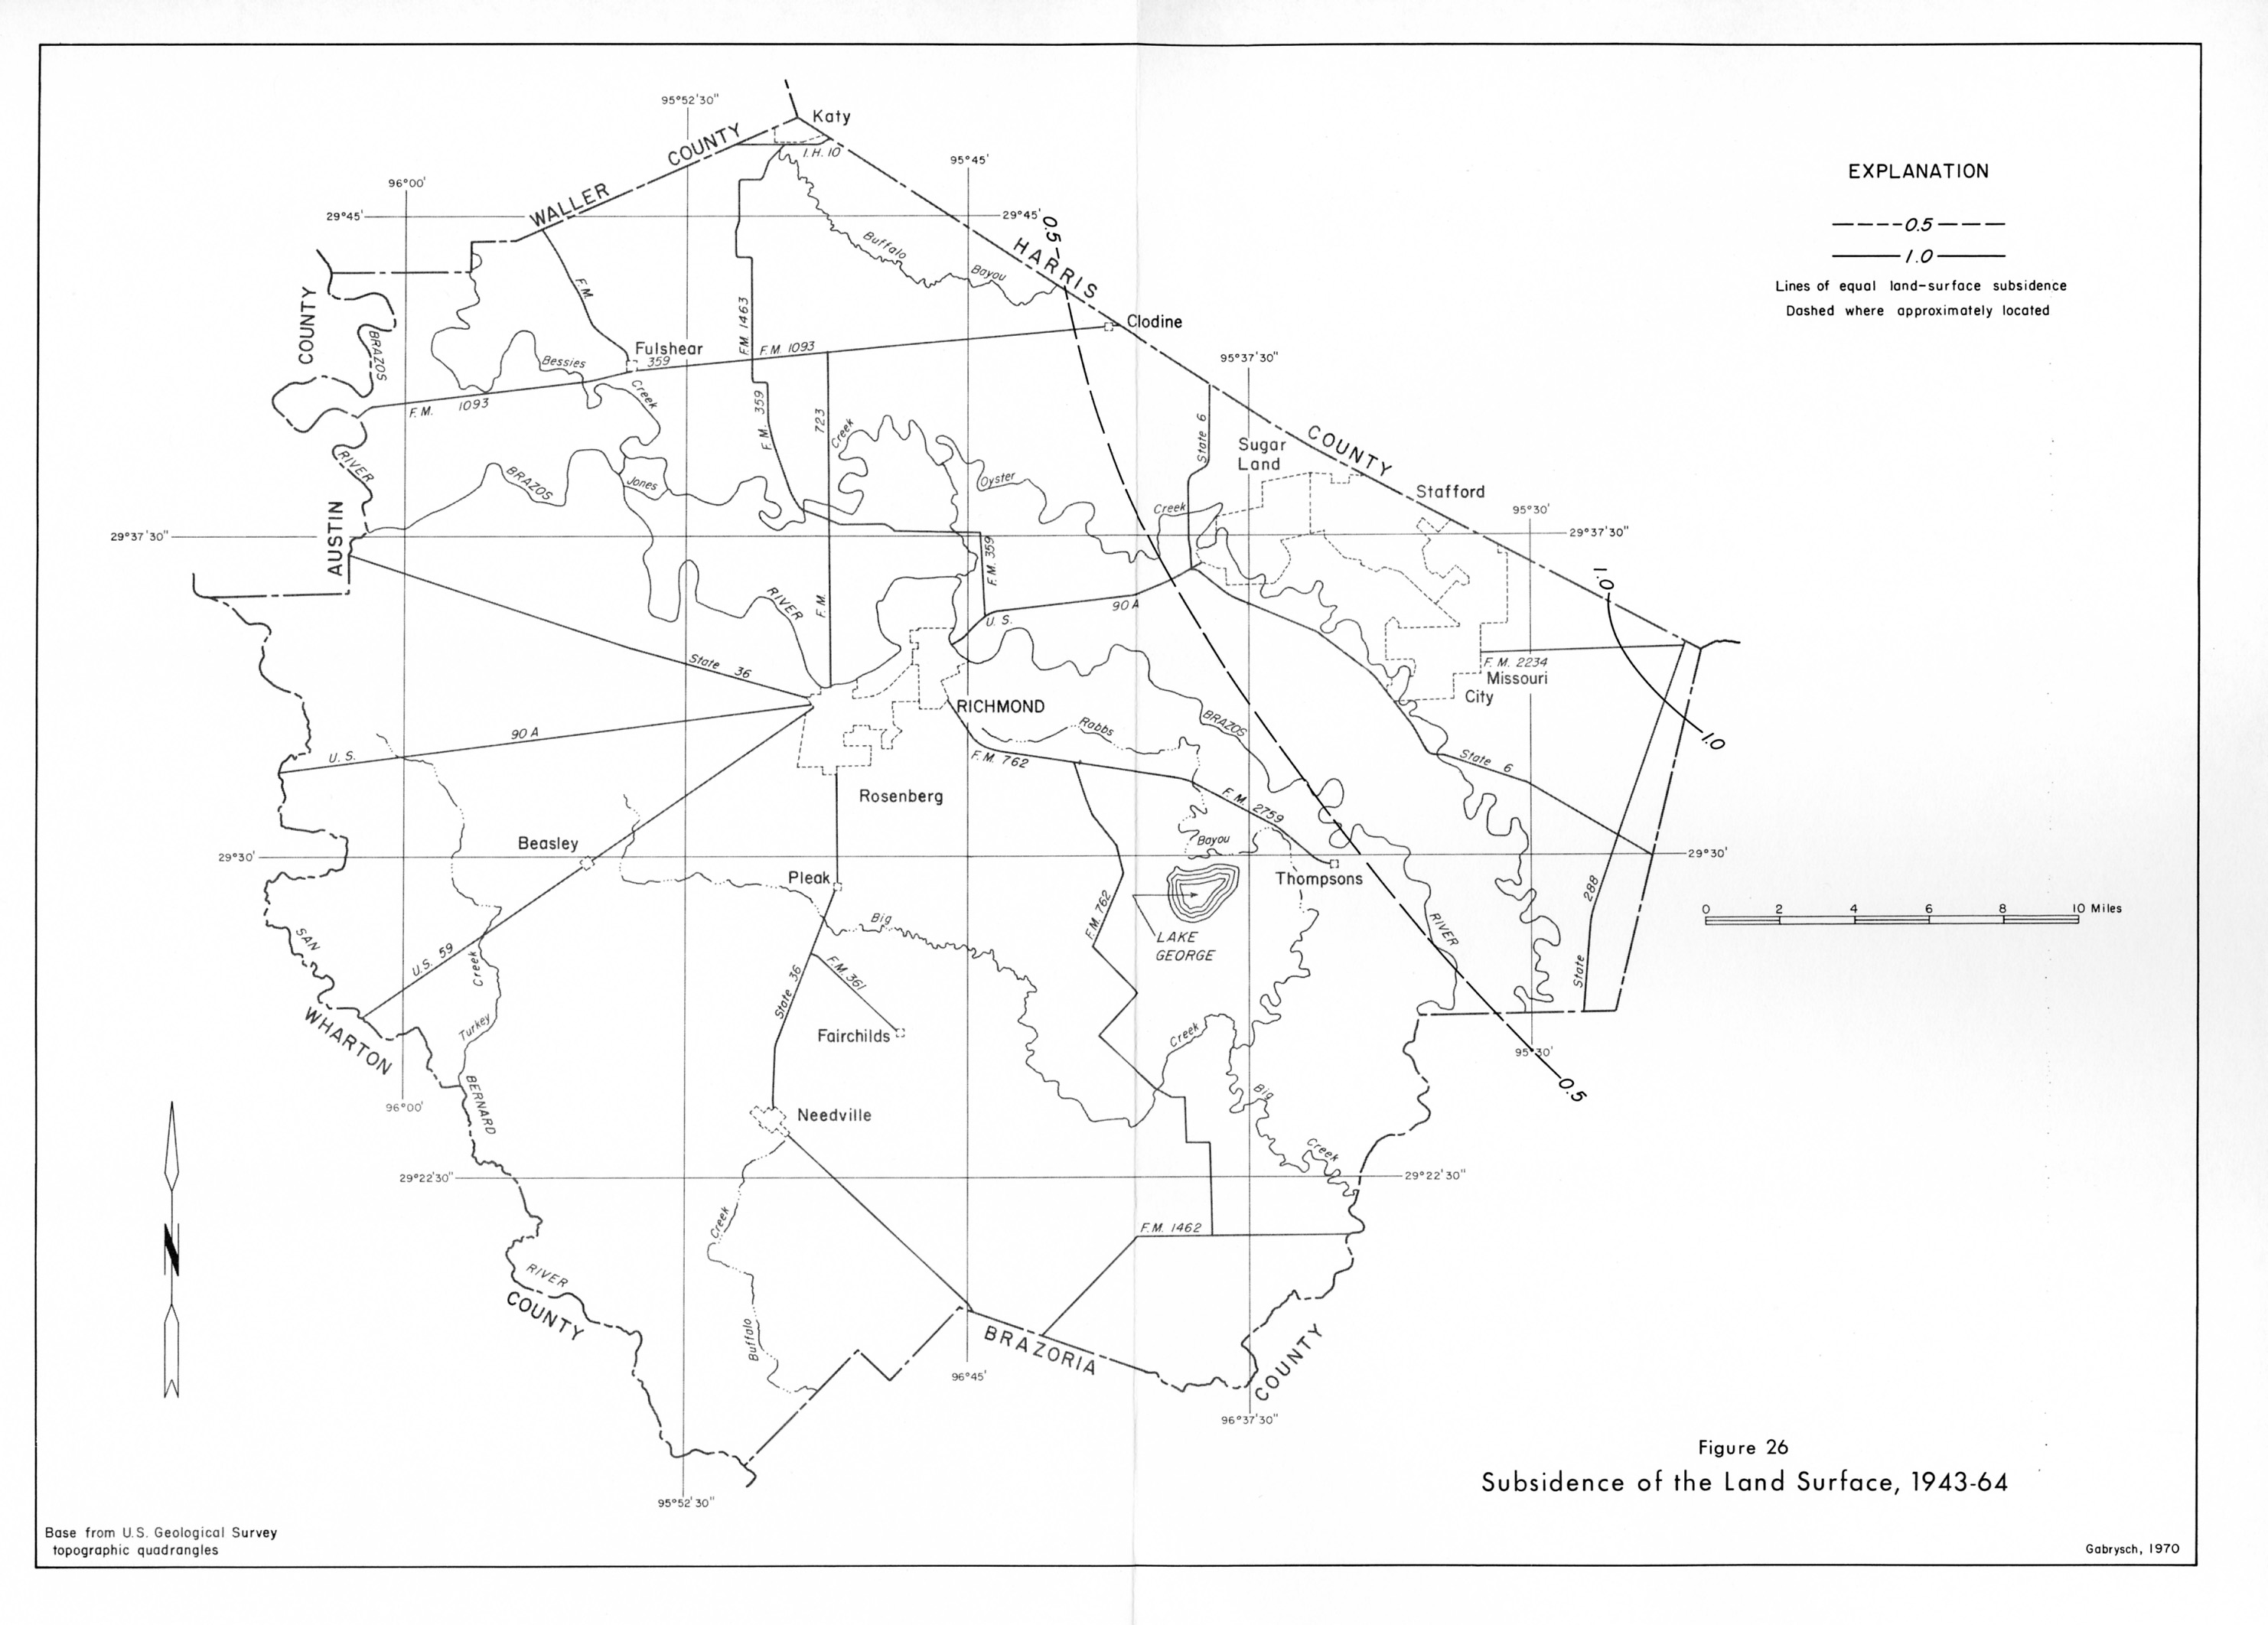
- Figure 26 - Subsidence of the Land Surface, 1943-64
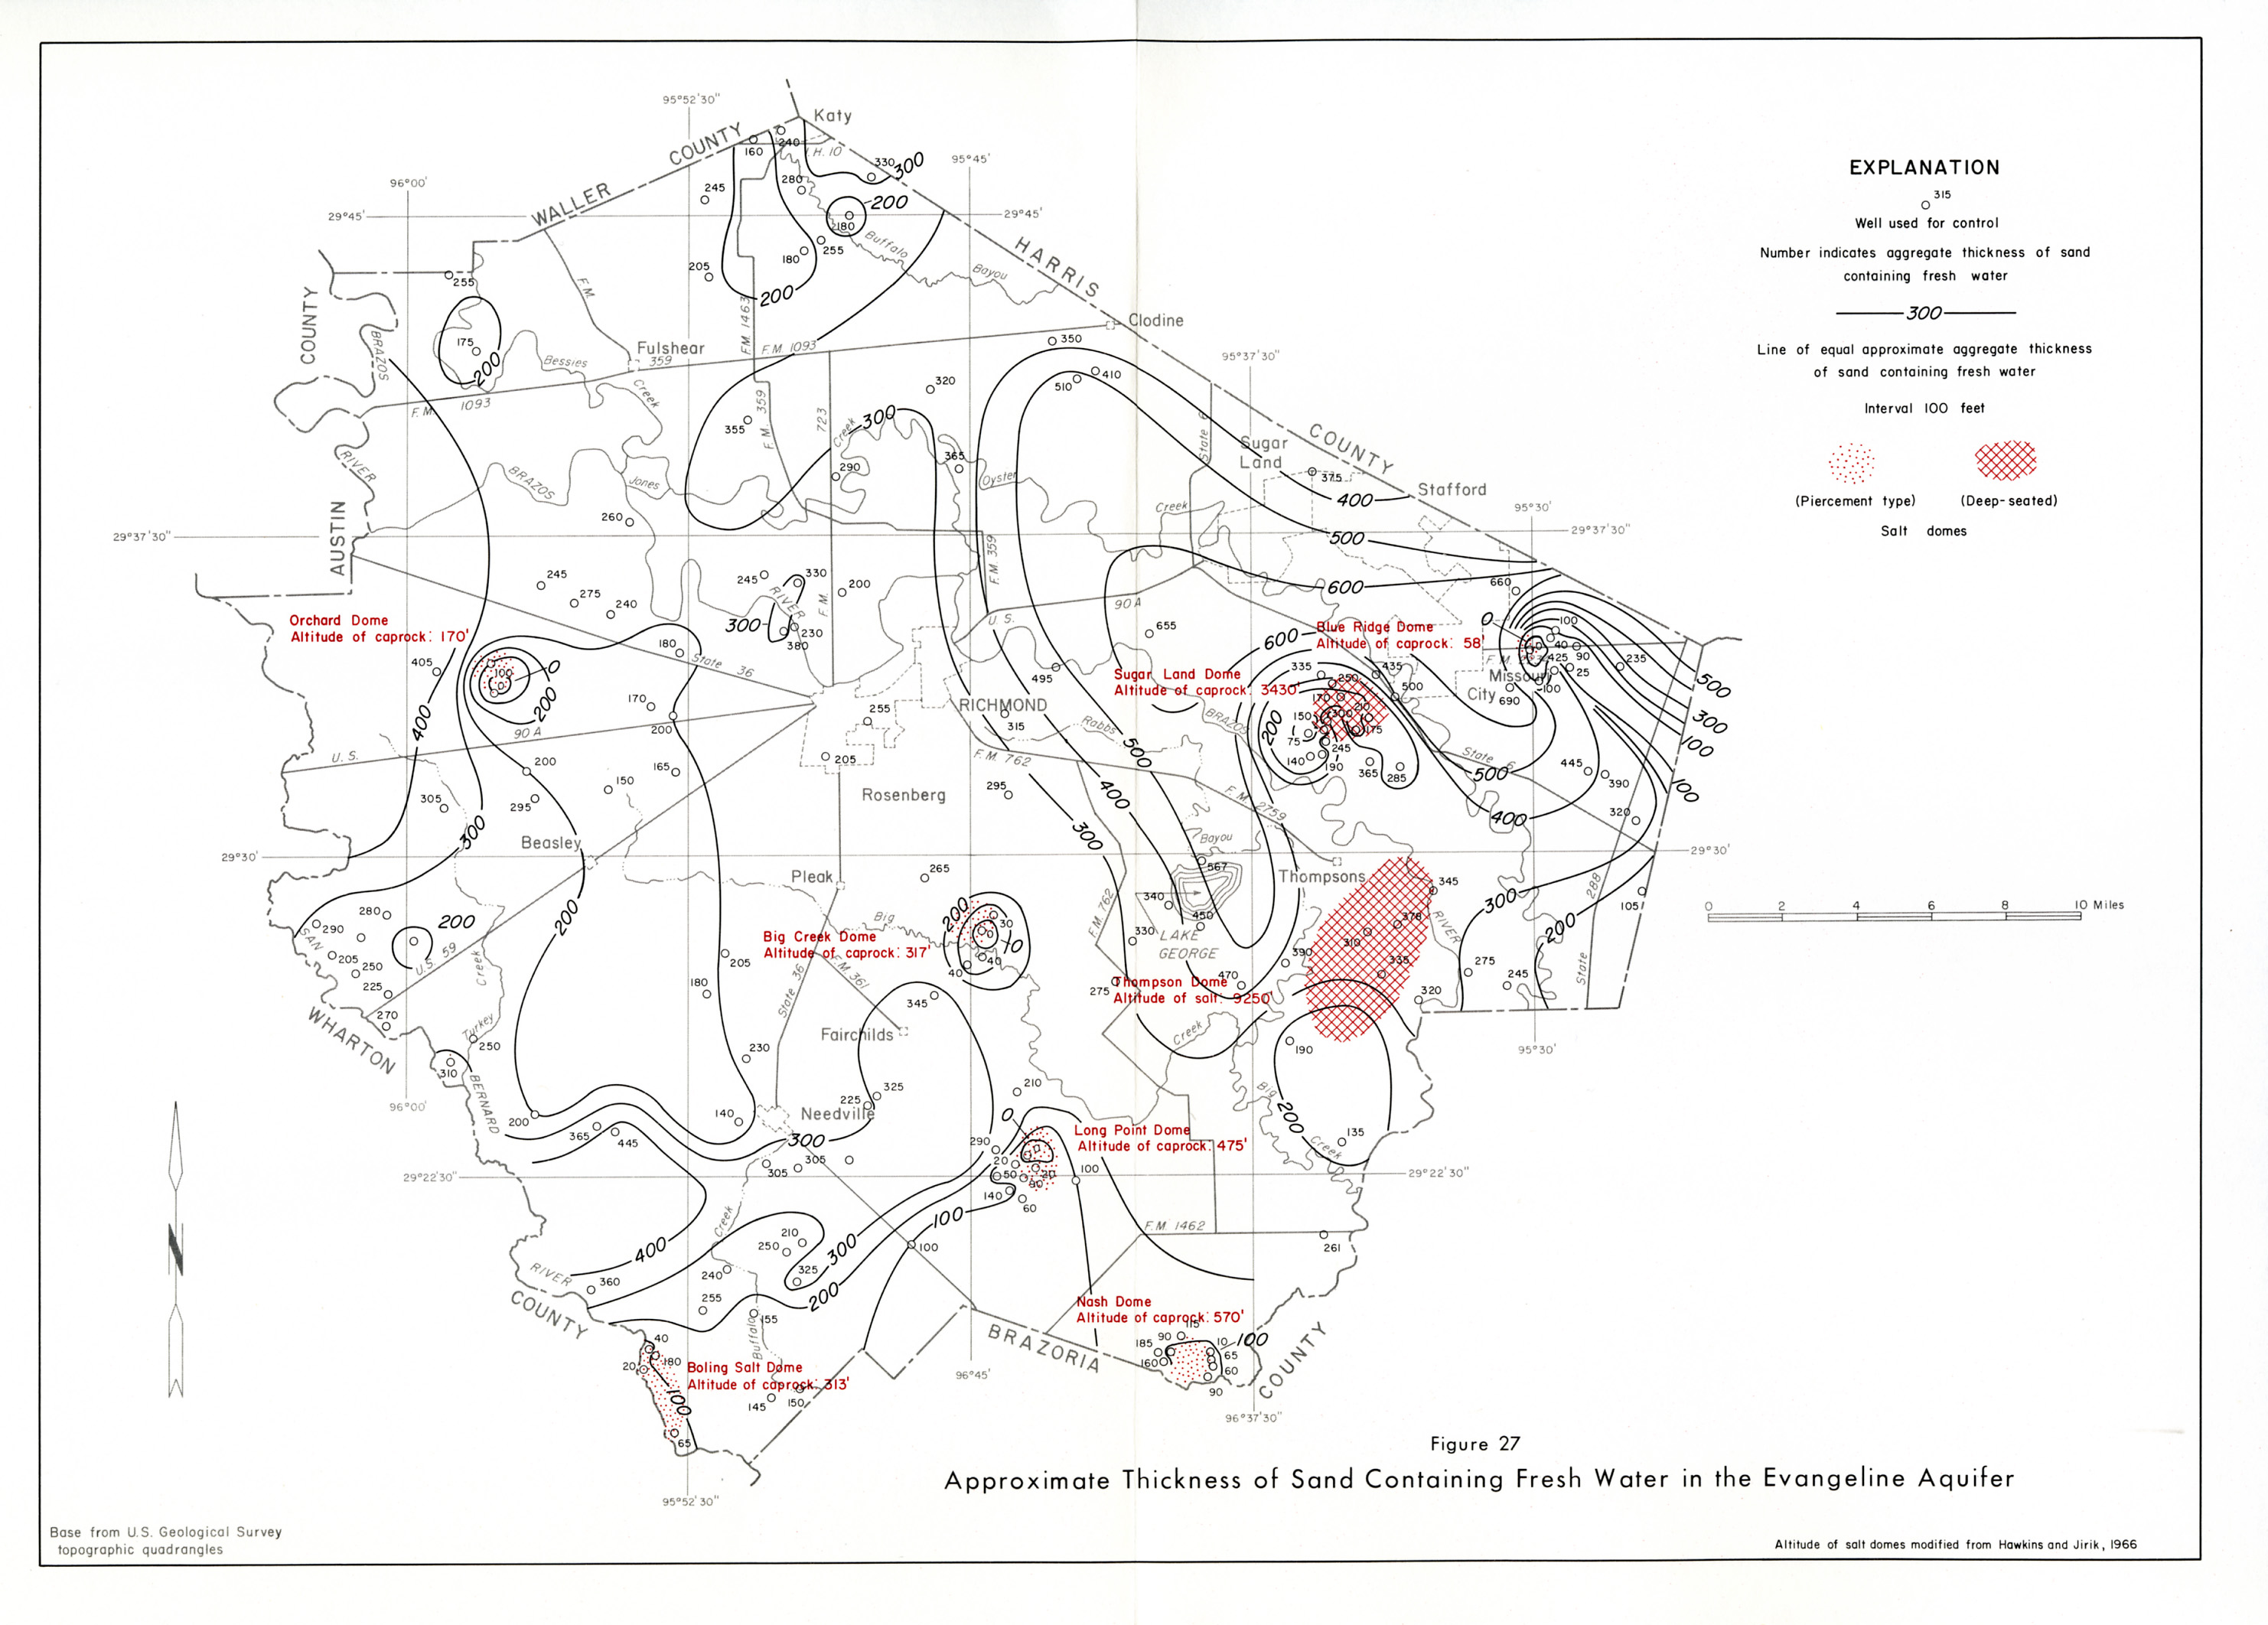
- Figure 27 - Approximate Thickness of Sand Containing Fresh Water in the Evangeline Aquifer
- Figure 28 - Approximate Thickness of Sand Containing Fresh Water in the Chicot Aquifer
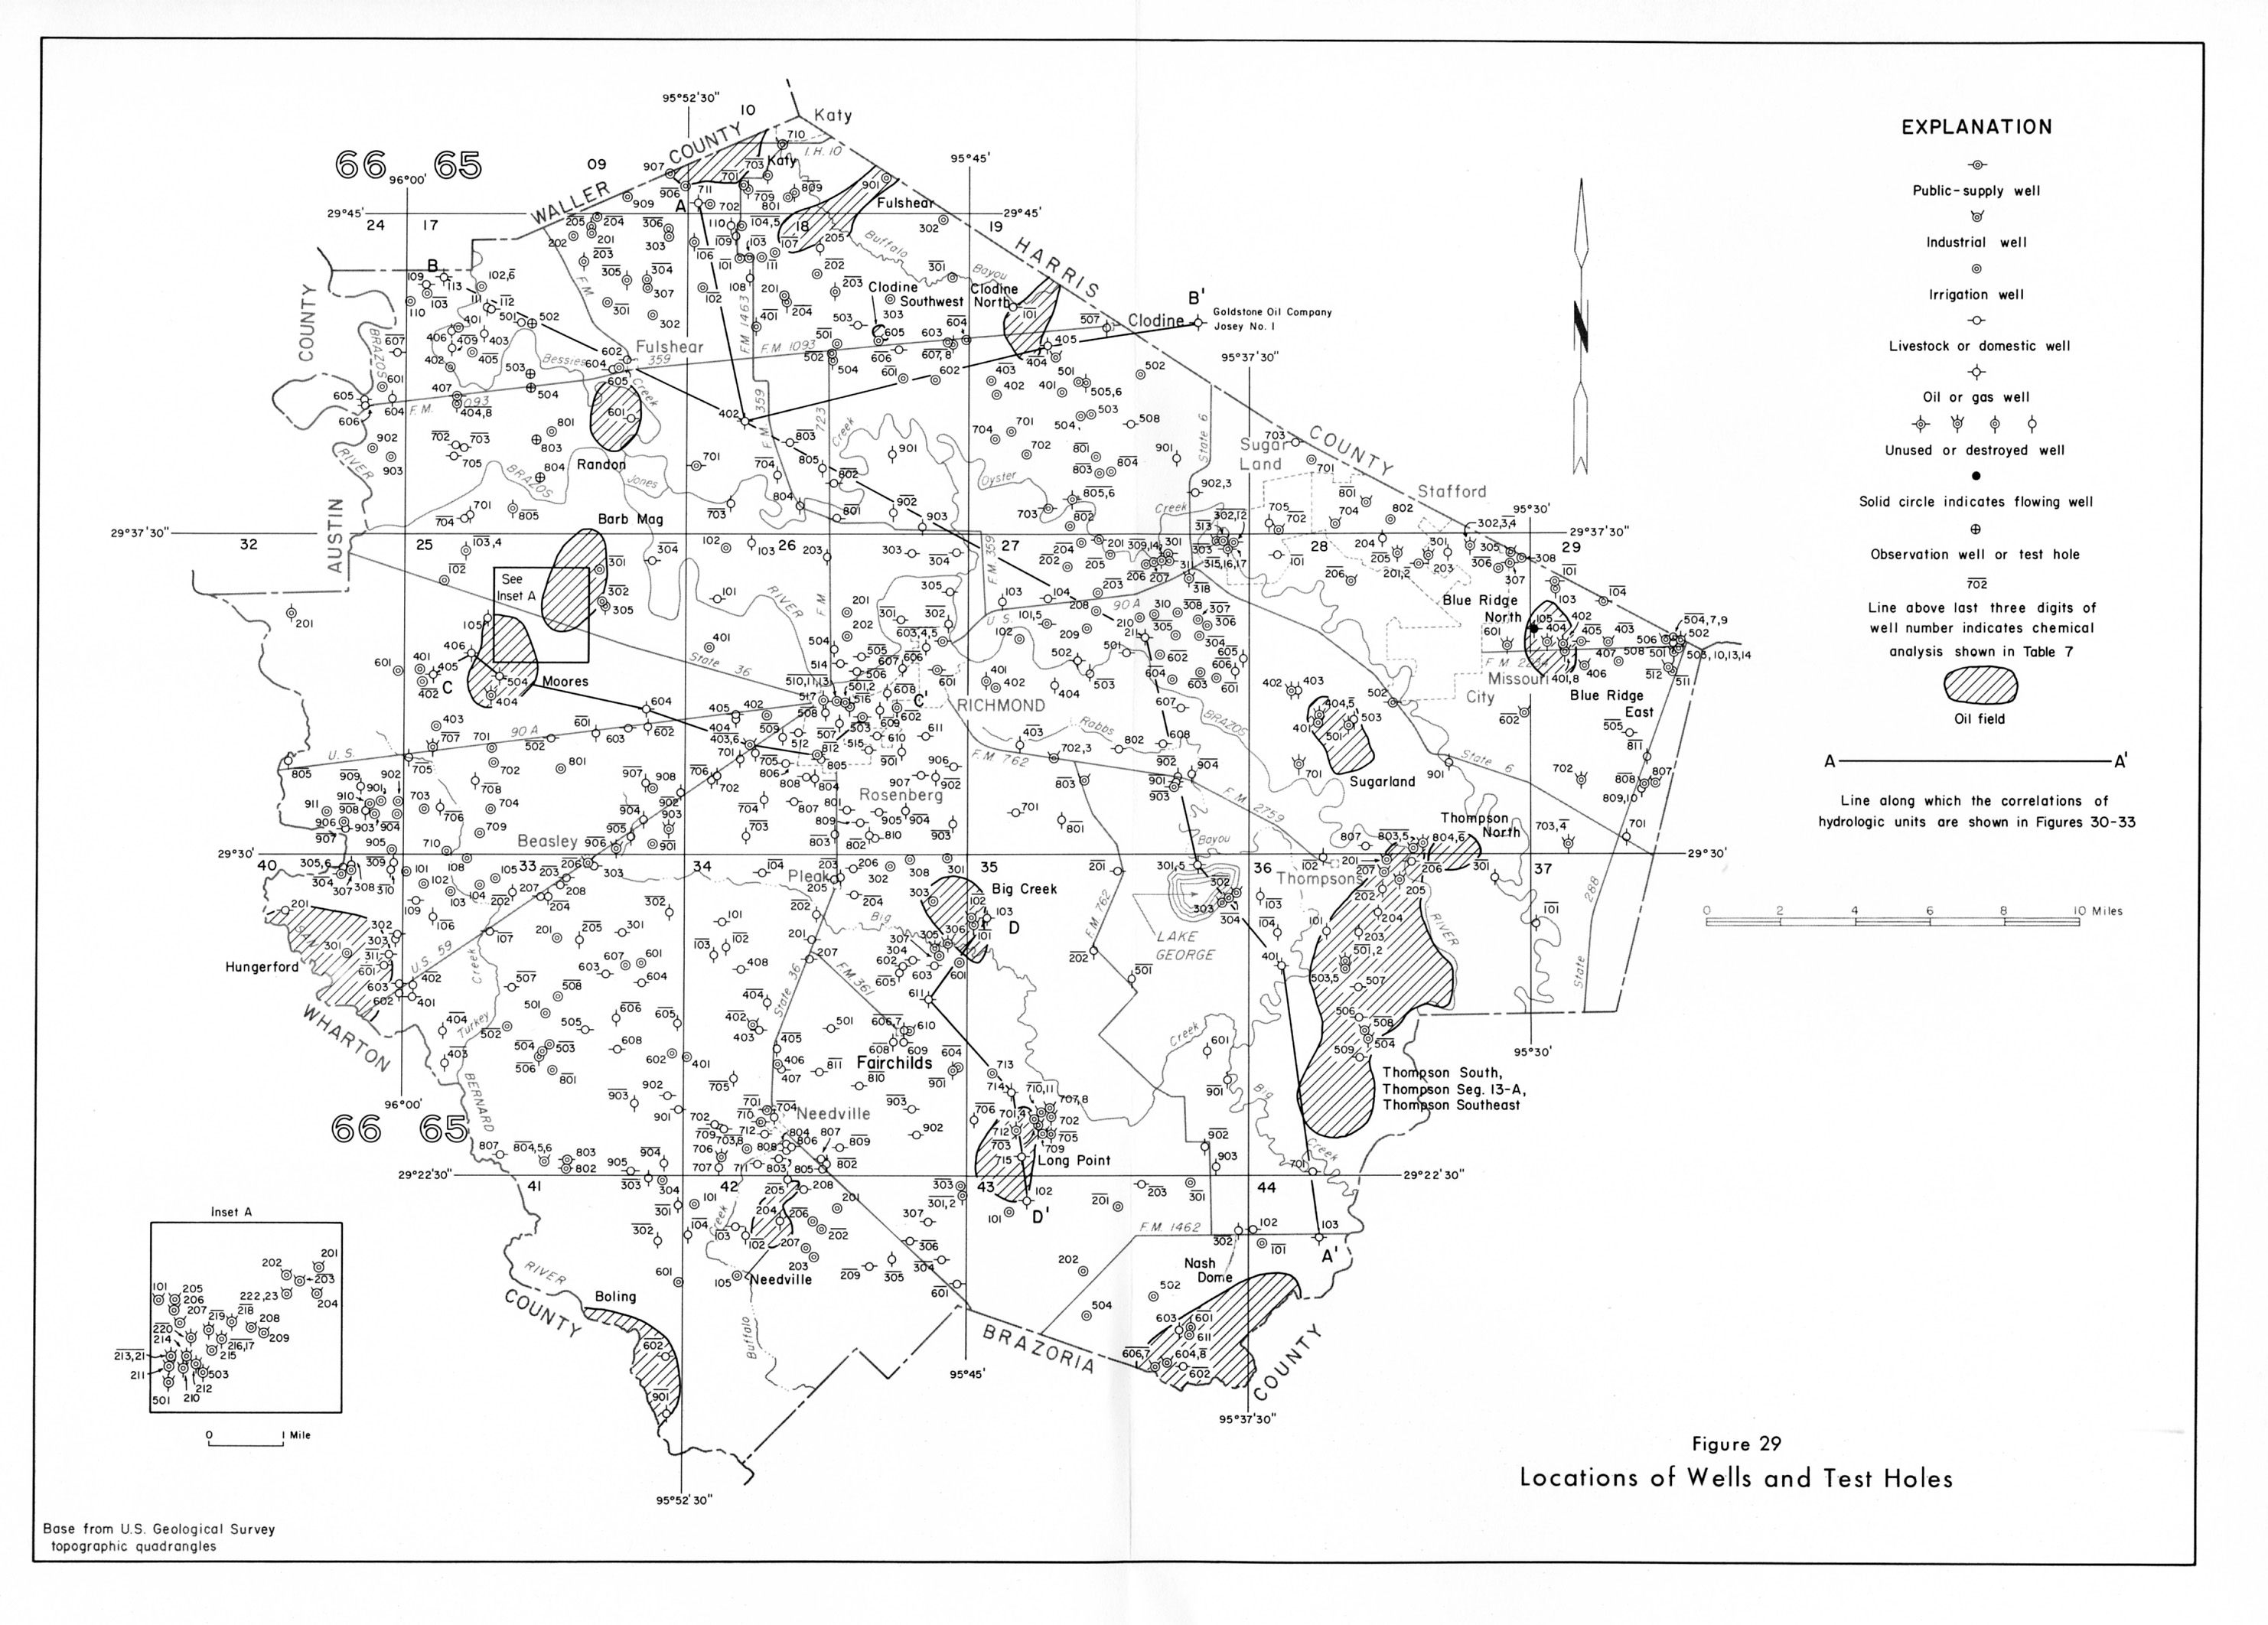
- Figure 29 - Locations of Wells and Test Holes
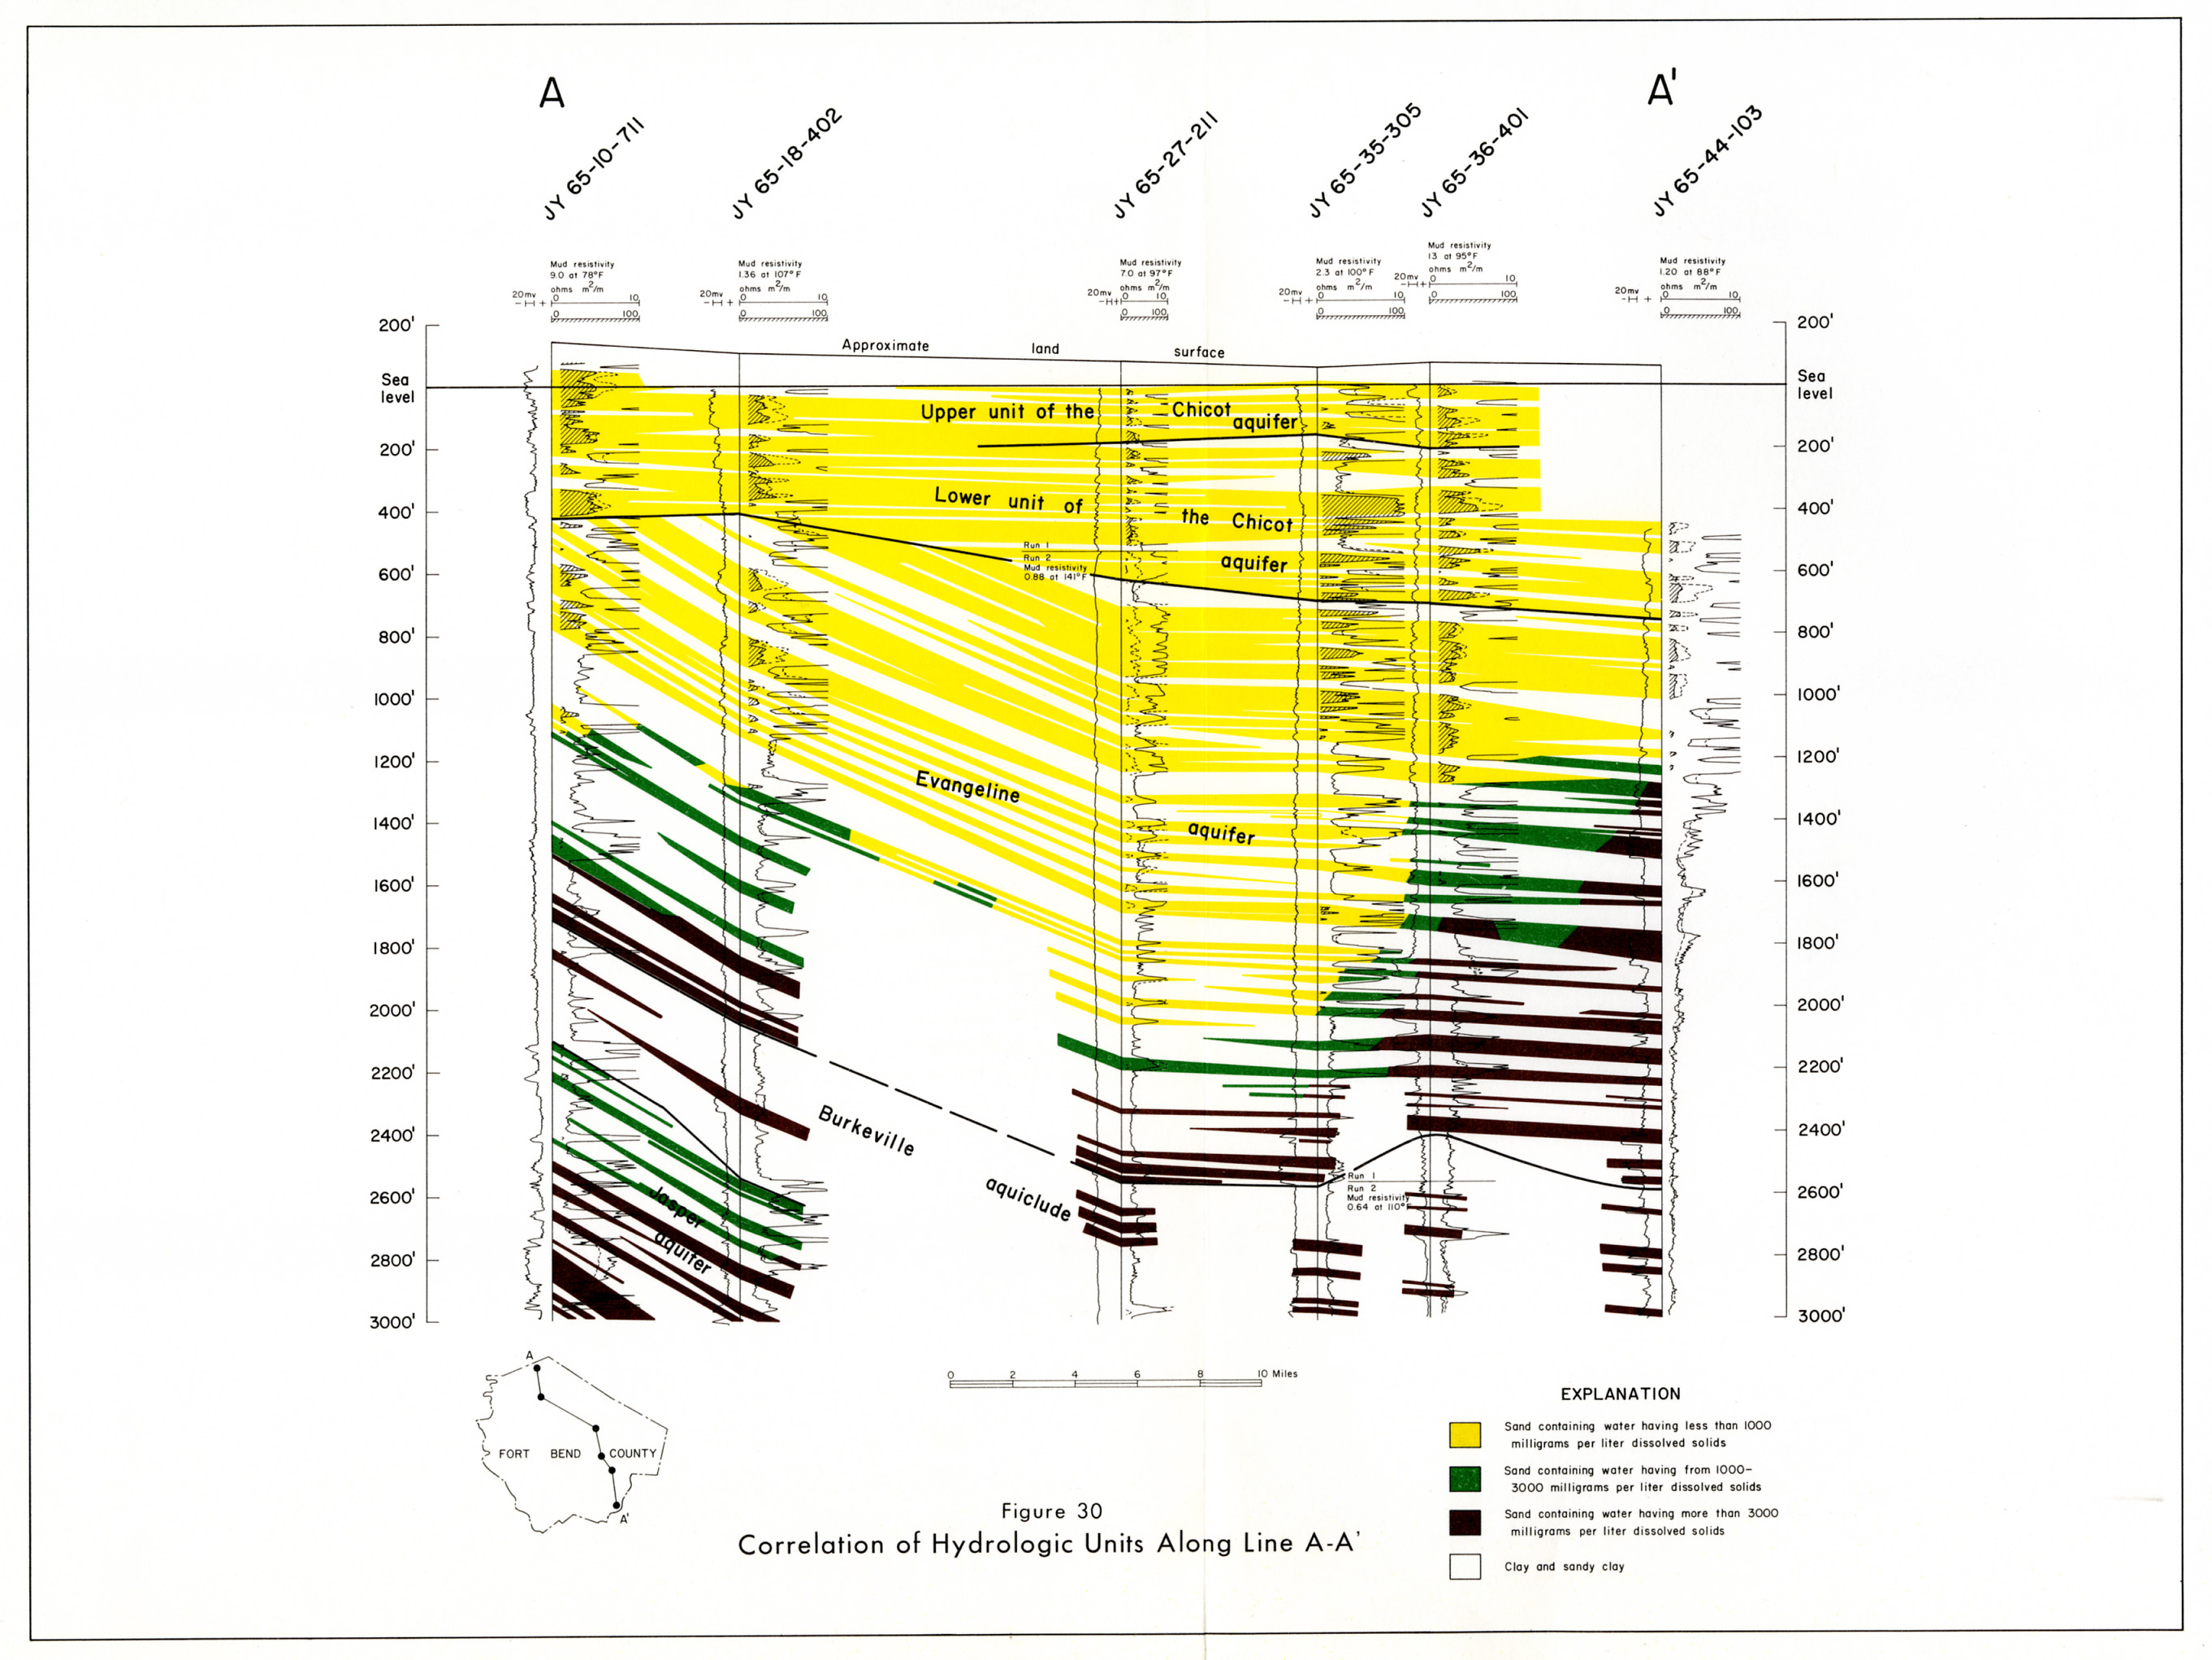
- Figure 30 - Correlation of Hydrologic Units Along Line A-A'
- Figure 31 - Correlation of Hydrologic Units Along Line B-B'
- Figure 32 - Correlation of Hydrologic Units Along Line C-C'
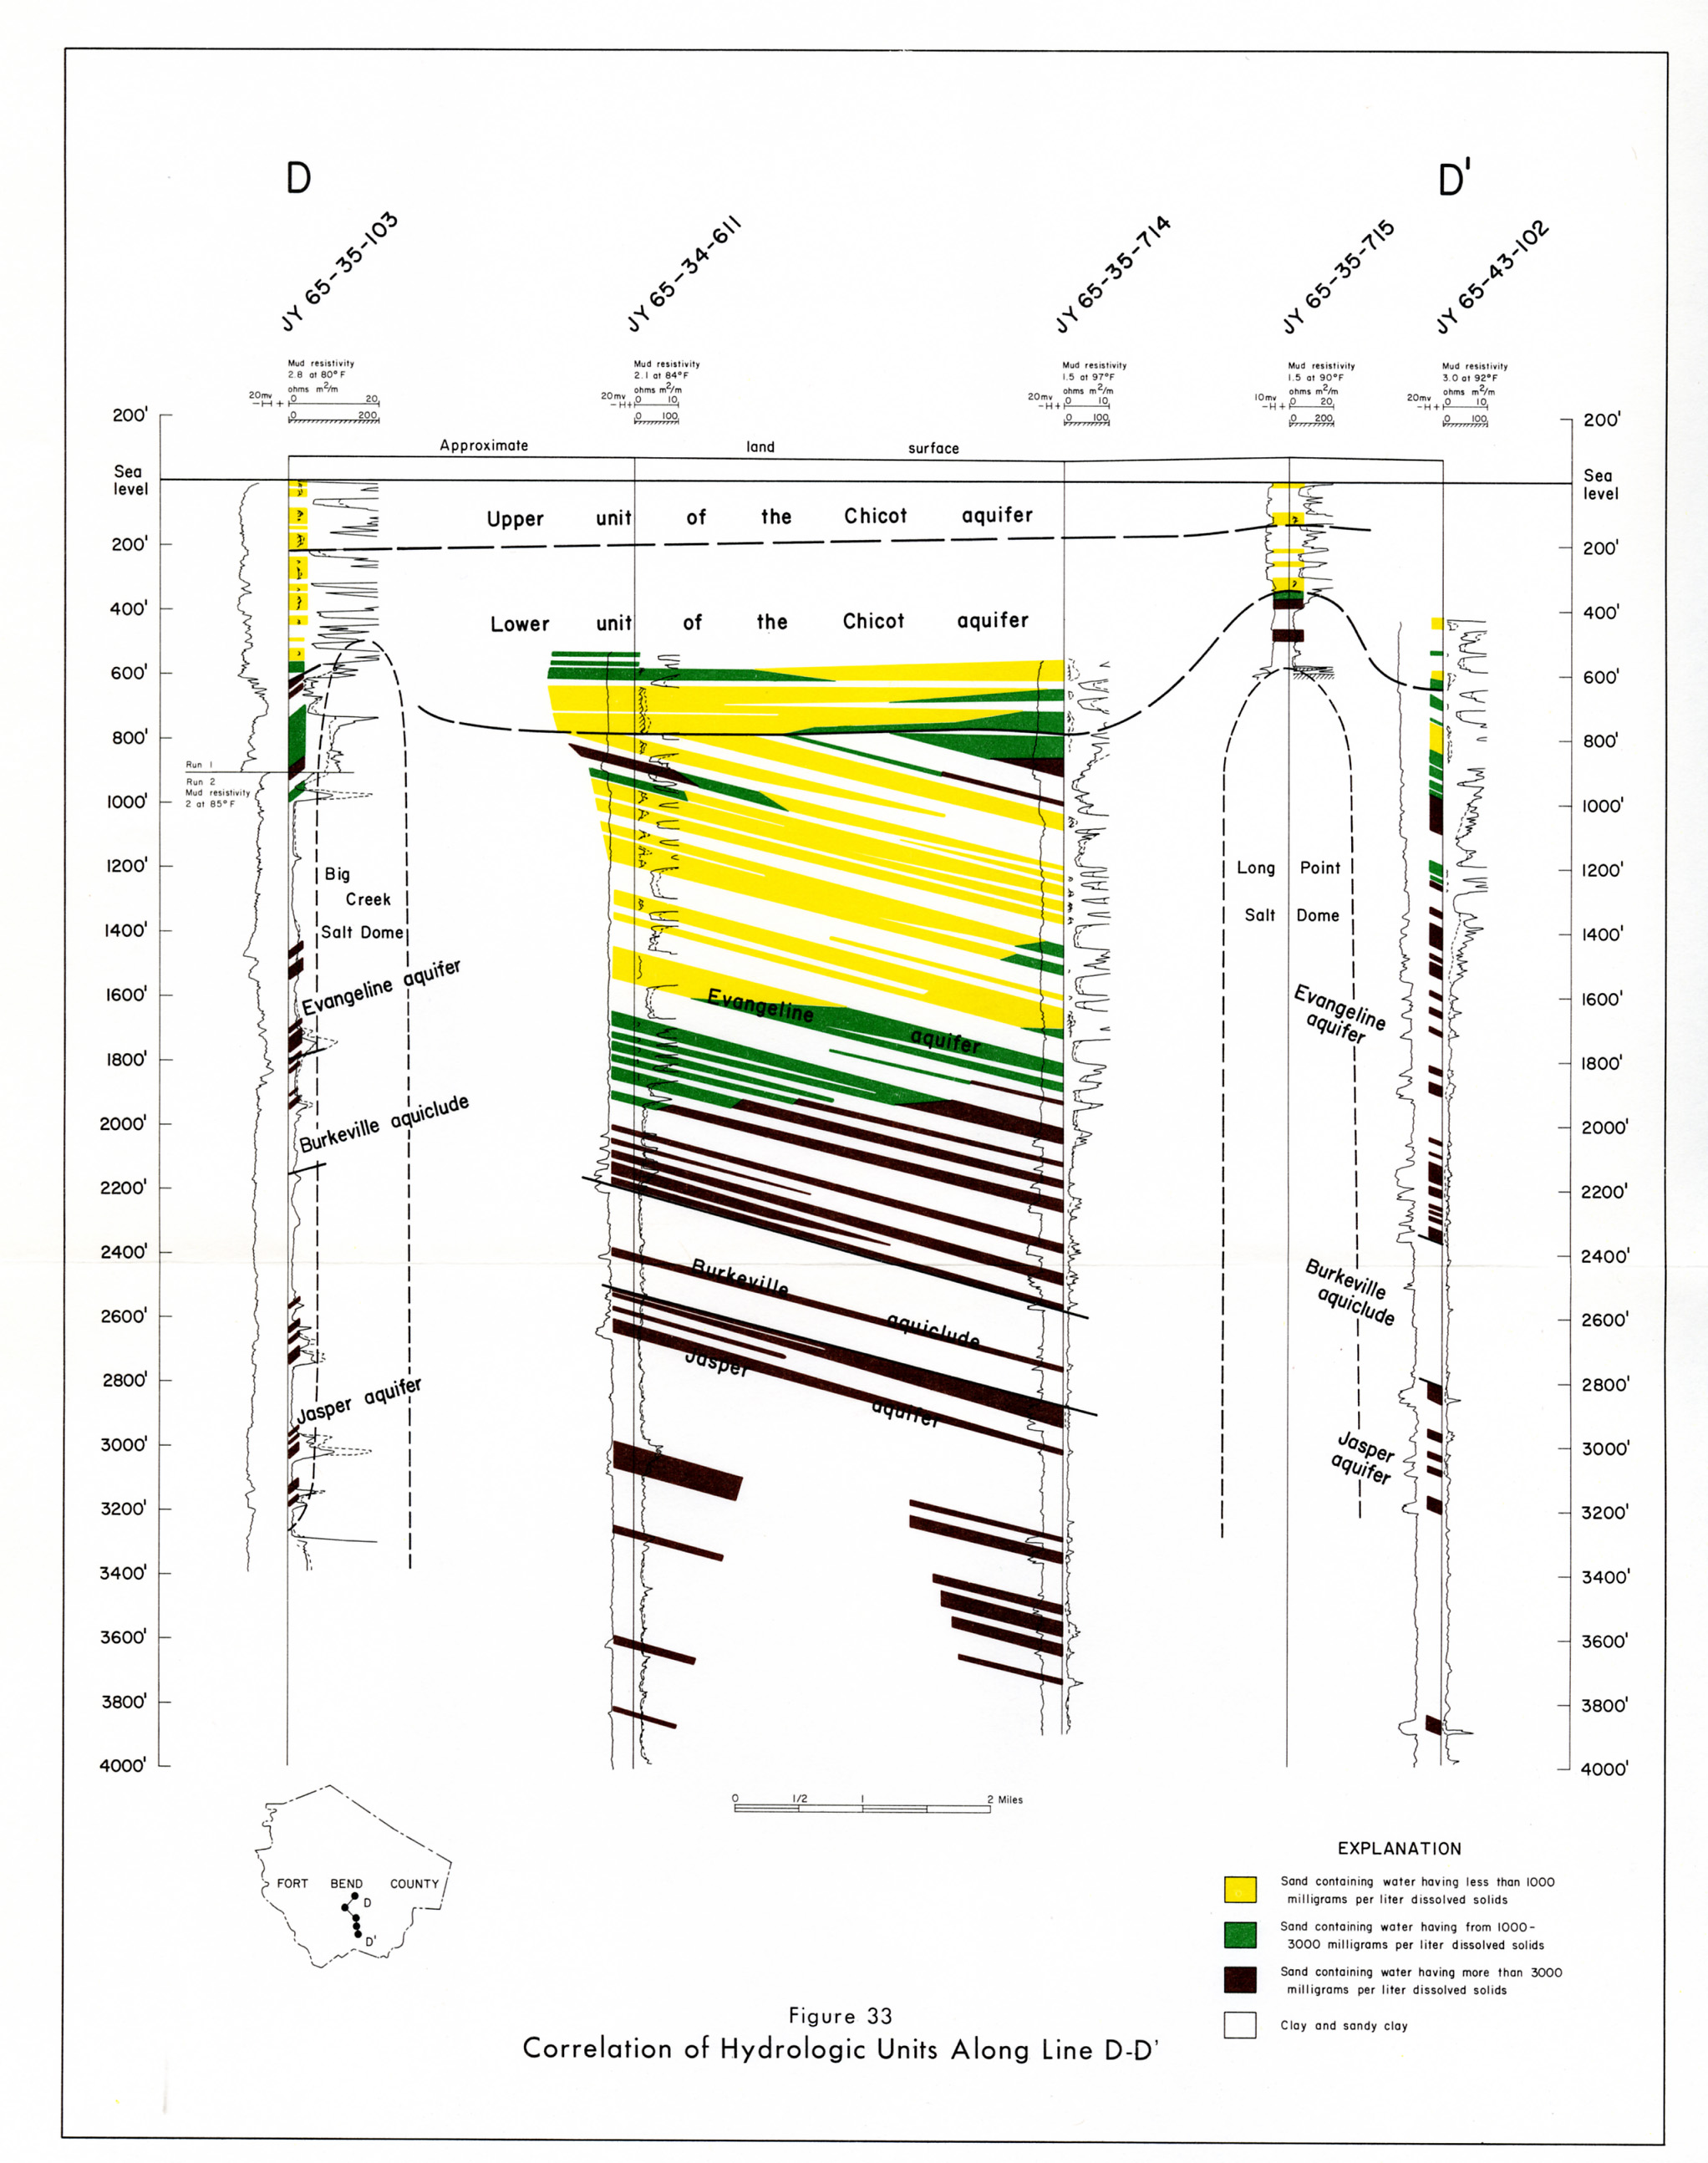
- Figure 33 - Correlation of Hydrologic Units Along Line D-D'