TWDB Home > Water Planning > Planning Data > Socioeconomic Impact Analysis
Socioeconomic Impact Analysis
Insufficient water supplies would negatively impact not only existing businesses and industry, but also ongoing economic development efforts in Texas. An unreliable water supply also disrupts activity in homes, schools, and government and endangers public health and safety. For these reasons, planning groups are required to evaluate the social and economic impacts of not meeting the identified water needs in their regional water plans.
The TWDB assists the Regional Water Planning Groups in evaluating the social and economic impacts of not meeting identified water needs for a single year drought of record. All impact estimates are in year 2023 dollars and were calculated using a variety of data sources and tools, including the use of a region-specific IMPLAN (Impact for Planning Analysis) model. The dashboard below displays water demands and needs, as well as potential social and economic impacts of not meeting water needs in their 2026 Regional Water Plans (RWP).
Please note that in August of 2025, a likely significant overestimation of the 2026 RWP manufacturing sector drought impact estimates was determined to have occurred. Details appear in the following addendum, and users of the results should take note of this overestimation.
To use the interactive dashboard, select a Regional Water Planning Group from the drop-down menu. Click on the red button to view more detailed level data. Then click the back arrow to return to the previous page. Use the drop-down to view data by Water Use Category (irrigation, livestock, manufacturing, mining, municipal, and steam-electric power).
Socioeconomic Dashboard User Guide
Socioeconomic Impact Analysis by Regional Water Planning Group, County, and Water Use Category
Download the Monetary Impacts data: 2026 RWP - Socioeconomic Impact Analysis - Regional Economic Impacts
Download the Social Impacts data: 2026 RWP - Socioeconomic Impact Analysis - Regional Social Impacts
Socioeconomic Impact Analysis for the 2026 Regional Water Plans
Note: projected socioeconomic impacts are regional impacts, not just for the county of interest.
Socioeconomic Impact Analysis for previous Regional Water Plans
2021 Regional Water Plans Socioeconomic Impacts of Water Needs
- (A) Panhandle
- (B) Region B
- (C) Region C
- (D) Region D
- (E) Far West Texas
- (F) Region F
- (G) Brazos G
- (H) Region H
- (I) East Texas
- (J) Plateau
- (K) Lower Colorado
- (L) South Central Texas
- (M) Rio Grande
- (N) Coastal Bend
- (O) Llano Estacado
- (P) Lavaca
2016 Regional Water Plans Socioeconomic Impacts of Water Needs
- (A) Panhandle
- (B) Region B
- (C) Region C
- (D) Region D
- (E) Far West Texas
- (F) Region F
- (G) Brazos G
- (H) Region H
- (I) East Texas
- (J) Plateau
- (K) Lower Colorado
- (L) South Central Texas
- (M) Rio Grande
- (N) Coastal Bend
- (O) Llano Estacado
- (P) Lavaca
2011 Regional Water Plans Socioeconomic Impacts of Water Needs
- (A) Panhandle
- (B) Region B
- (C) Region C
- (D) Region D
- (E) Far West Texas
- (F) Region F
- (G) Brazos G
- (H) Region H
- (I) East Texas
- (J) Plateau
- (K) Lower Colorado
- (L) South Central Texas
- (M) Rio Grande
- (N) Coastal Bend
- (O) Llano Estacado
- (P) Lavaca
2006 Regional Water Plans Socioeconomic Impacts of Water Needs
For questions, please contact the Projections and Socioeconomic Analysis Department at EDA@twdb.texas.gov or navigate to the Water Supply Planning Staff
Methodology Documents
Frequently Asked Questions
Note: References to Impact Analysis within this set of FAQ questions and responses refer to the Texas Water Development Board (TWDB) Socioeconomic Impact Analysis.
Users are encouraged to use the search tool (ctrl F) associated with their web browser or pdf reader to locate the questions related to their topic of interest or a facet of the analysis requiring additional explanation.
Questions may be submitted to the Projections and Socioeconomic Analysis staff at: EDA@twdb.texas.gov
Acronyms
- EIA: U.S. Energy Information Administration
- ERCOT: Electrical Reliability Council of Texas
- IMPLAN: Impact Planning Model
- NAICS: North American Industry Classification System
- RWP: Regional Water Plan
- RWPA: Regional Water Planning Area
- RWPG: Regional Water Planning Group
- SWP: State Water Plan
- TML: Texas Municipal League
- TWDB: Texas Water Development Board
- USDA: United States Department of Agriculture
- WUG: Water User Group
- WUS: Water Use Survey
Click on the Question to see the Answer
- What is the purpose and scope of the Impact Analysis?
- What impact measures are included in the Impact Analysis?
- What are major facets of economic impacts not addressed by the Impact Assessment?
- What is IMPLAN, and what role did it play in the Impact Analysis?
- What data sources provided the water use values used in the Impact Analysis?
- What were the primary datasets incorporated into the Impact Assessment?
- What water uses were considered to be water-intensive within the municipal-commercial water use category?
- How were the final impact estimates for income, job, and tax losses determined?
- What area of geographic influence is accounted for in the Impact Analysis, and are spillover impacts to other planning regions considered?
- What is consumer surplus, and how is it used in the Impact Analysis?
- Are impacts in the forward linked sectors for a drought impacted production sector also considered in the Impact Analysis?
- Why do some counties and water use categories have a water supply need, yet no economic impact?
- Why do impact estimates possibly differ for counties with similar volume of needs?
- How were utility revenue losses calculated?
- Why are the final impact estimates considered to be conservative?
- Should lost consumer surplus estimates from the residential water use impact measures be added to other monetary impact measures to obtain a total monetary impact?
- What are water trucking (water hauling) costs?
- How were adverse economic impacts phased in for varying degrees of water shortages?
Answers to Socioeconomic Impact Analysis Questions
1. What is the purpose and scope of the Impact Analysis?
The analysis estimates the social and economic costs of not meeting water needs identified in the regional water plans. Ten impact estimates are developed to provide a measure of the impacts of a single year repeat of the drought of record if no water management strategies are implemented to offset the projected needs.
2. What impact measures are included in the Impact Analysis?
Ten measures, within three major categories, are estimated for the Regional Water Plan (RWP) Impact Analysis.
- Income losses* (analogous to Gross Domestic Product and also known as Value-Added),
- Electrical power purchases,
- At risk job losses*,
- Taxes*,
- Water hauling costs
- Utility revenue losses
- Utility tax losses,
- Consumer surplus losses (residential),
- Population at-risk of out-migration,
- At risk school enrollment losses
The primary measures of interest are the income and job loss estimates (measures 1 and 3). Three of the measures, marked with an asterisk (*), rely heavily on output from a Regional Water Planning Area (RWPA) specific IMPLAN model.
3. What are major facets of economic impacts not addressed by the Impact Assessment?
The Impact Assessment attempts to determine estimates of lost income and jobs (among other measures) to the planning region accompanying a one-year repeat of the drought of record. The analysis does not attempt to address the more specific tasks below:
- Perform a benefit-cost analysis of potential mitigation strategies,
- Explore the impacts of building moratoriums for cities with limited water supplies, nor
- Reflect impacts in the forward linked sectors.
Benefit-cost analyses require extensive cost and benefit estimation efforts (across numerous time periods). Similar efforts to estimate the impact of a building moratorium, coupled with the possible lifting of the moratorium, also require a complex effort with multiple assumptions concerning both the timing and magnitude of positive and negative impacts. The Impact Analysis does provide baseline data which might be used in such efforts, but the listed tasks would require a great deal more effort and a large array of key assumptions, especially when considering the fifty year time horizon, complexity of the various regional economies, continuing growth of regional populations, and approximately 2,800 individual WUGs within the 16 RWPAs. Building moratorium impacts as well as consideration of impacts in forwardly linked sectors (downstream in the production process) were also deemed too complex for the analysis context of the Impact Analysis.
4. What is IMPLAN, and what role did it play in the Impact Analysis?
IMPLAN, or the Impact Planning Model, is an economic impact assessment software system, originally developed by the U.S. Forest Service, and now maintained by the IMPLAN Group (IMPLAN.com). IMPLAN reflects economic activity by sector, and detailed economic data for all 254 counties within the state was used to develop 16 different regional planning area-based impact assessment models. IMPLAN output related to value-added, job losses and taxes (on production and imports) was used as baseline data within the Impact Analysis. Value-added is the dollar value of total production within an economic sector minus all costs of producing that output.
In addition, IMPLAN output allows converting initial estimates of impacts (value-added, jobs, taxes) to regional level impact estimates reflecting additional impacts within the economy. Note that value-added estimates from IMPLAN serve as the basis for the income estimates. Three types of effects may be incorporated into the final regional level impact estimates:
- Direct effects representing the initial change in the industry analyzed;
- Indirect effects that are changes in inter-industry transactions as supplying industries respond to reduced demands from the directly affected industries; and,
- Induced effects that reflect changes in local spending that result from reduced household income among employees in the directly and indirectly affected industry sectors.
Total estimates are calculated using IMPLAN based multipliers to adjust the baseline estimates of value-added, jobs, and taxes to their regional level impact estimates. Water use categories for which IMPLAN data was employed include livestock, mining, manufacturing, irrigated agriculture, and commercial: water-intensive.
5. What historical water use data sources provided the water use values used in the Impact Analysis?
Three key data sources were utilized for the baseline water use data:
- The TWDB annual Water Use Survey (WUS) estimates,
- The TWDB Water Science and Conservation (WSC) annual irrigation water use estimates, plus
- The TWDB Projections & Socioeconomic Analysis staff annual population estimates and livestock and mining water use.
Combining the three sources resulted in estimates for 6 major water use categories:
- Livestock,
- Irrigated Agriculture,
- Steam Electric Power,
- Mining,
- Manufacturing, and
- Municipal
Summary results for the three combined efforts by year are available at the website: Water Use Survey
6. What were the primary datasets incorporated into the Impact Assessment?
- IMPLAN data and models (IMPLAN),
- Historical water use estimates,
- RWP projected water demands and needs,
- Residential / commercial water use and prices, demand function and lost consumer surplus and lost utility revenue estimates,
- Historical agriculture product prices, yields, water use and acreages (USDA, TWDB-WSC),
- kWh/acre-foot estimates by county for steam electric power generation (EIA),
- Miscellaneous gross receipts tax rate (Office of the Texas Comptroller of Public Accounts),
- Kindergarten through high school proportion of total population.
7. What water uses were considered to be water-intensive within the municipal-commercial water use category?
Eight general categories were considered to be water-intensive as shown in the table below. These sectors were included in the water-intensive classification based on the value of water and their susceptibility to larger drought induced adverse impacts. Estimates of the lost income, jobs, and taxes were made for each of the eight sectors listed and appear as an aggregated total within the impact estimates.
- Car washes,
- Education,
- Health care,
- Hospitality,
- Laundries,
- Meetings and recreation,
- Food stores, and
- Warehousing
8. How were the final impact estimates for income, job, and tax losses determined?
The initial regional level impact estimates for lost income, jobs, and taxes were possibly adjusted for the number of firms (i.e., within the mining and manufacturing water use categories), and were also adjusted for the degree of water shortage within the water use category. These calculations were made for each IMPLAN sector in the water use category within each county. Values/acre-foot were multiplied by the number of acre-feet short and summed across all IMPLAN sectors in the water use category for each county or WUG. This process implicitly takes into account the proportion of water used in each IMPLAN sector. The resulting impact estimates therefore reflected the variability of economic activity within each WUG. For example, a county with large mining water use for oil and gas exploration would have a higher impact estimate than one which focused on the less profitable sand and gravel quarrying, even if the two counties had the same degree of water shortage.
9. What area of geographic influence is accounted for in the Impact Analysis, and are spillover impacts to other planning regions considered?
Water needs are estimated at the WUG-level, by region, for municipal water uses and at the county-level for the remaining water use categories. Regional level multipliers from IMPLAN were used to adjust the initial estimates of income, jobs, and taxes to reflect impacts on other sectors in the planning region only. Potential spillover effects to other planning regions do exist, but are not accounted for in the Impact Analysis. The Impact Analysis assumes that the drought occurs in Region X only. Backward linkages to input sectors in other regions are not accounted for. Similarly, forward linkages to relevant sectors which use Region X outputs are also not accounted for.
10. What is consumer surplus, and how is it used in the Impact Analysis?
Consumer surplus is a welfare economics measure of well-being, and is a useful tool to assess the damages or benefits accruing to consumers when economic or resource availability conditions change. In the context of a drought, reduced water supplies adversely affect consumers as they cannot consume as much water as they desire, and lost consumer surplus is a measure of how much homeowners would be willing to spend to be able to consume water at those normal levels of use.
Impact analysis estimates of lost consumer surplus were made using household level, municipal WUG specific, water demand functions (both outdoor and indoor water use) based on average price and quantity of water used data from the Texas Municipal League annual survey data effort. These estimates varied with the degree of shortage, up to shortages of 80%. Consumer surplus estimates for shortages greater than that value were not estimated, primarily due to estimation issues associated with the demand functions for very small quantities of water.
11. Are impacts in the forward linked sectors for a drought impacted production sector also considered in the Impact Analysis?
Traditional use of input-output analysis via IMPLAN only captures impacts on backwardly linked sectors (i.e., wheat sales as an input to pasta production). Potential adverse impacts in the forward linked sectors, such as the reduced retail beef sales accompanying fewer marketable cattle following a drought, are not accounted for in the Impact Analysis. This is a shortcoming of the current approach, and is a facet which the IMPLAN model is not readily suited for, especially when dealing with numerous impacted sectors and 254 counties.
12. Why do some counties and water use categories have a water supply need, yet no economic impact?
Positive needs may exist for a given decade, yet use of the impact elasticity functions may result in no estimated economic damages. For example, if water shortages are less than 5%, the Impact Analysis assumes there is enough flexibility in the water supply system or production unit to result in no damage assessment.
13. Why do impact estimates possibly differ for counties with similar volume of needs?
The variety of goods and services produced varies from one county to another, and the procedures used for determining the impact estimates reflect that variability as well as the differing value of water in various economic sectors and water use categories. For example, counties with large irrigated agricultural production will have smaller adverse impact estimates when compared to counties with a similar degree of need in manufacturing due to the higher value of water within manufacturing.
14. How were utility revenue losses calculated?
Data from the Texas Municipal League (TML) annual survey concerning average monthly water prices paid and quantity used was employed to estimate lost utility revenue for both residential and commercial use. Price data is available for both residential and commercial use, and average prices from the TML data were multiplied by the acre-feet of needs to estimate the value of lost utility sales. The TML data for various years is available at the TML Survey Results Website
15. Why are the final impact estimates considered to be conservative?
Impact estimates within the analysis are likely conservative (too small) for several reasons, with a partial list appearing below:
- The analysis focuses on those sectors with adequate water use data;
- consideration of only 1 year of drought;
- no consideration of impacts on the forwardly linked sectors (both within the region of interest as well as impacts on adjoining regions);
- no consideration of backward linked impacts on other planning regions;
- does not consider the possible impacts of building moratoriums for those WUGs with significant long term water shortages; and
- a lack of considering the increasing scarcity of water throughout the region, and the resulting impact on the use of technology, on the true value of water.
16. Should lost consumer surplus estimates from the residential water use impact measures be added to other monetary impact measures to obtain a total monetary impact?
Lost consumer surplus is not an out-of-pocket cost or foregone income measure similar to the lost income estimated for the remaining water use categories. Although lost consumer surplus values are estimated monetary losses, they are a different type of monetary impact, and ideally should not be added to other monetary estimates of loss.
17. What are water trucking (water hauling) costs?
Water hauling, or trucking costs, are the estimated cost to bring potable water into a municipal water system. These costs could vary significantly depending on the length of trip and the source of the trucked in water. All municipal water needs (shortages) exceeding the 80% acre-foot level of the projected demand were assumed to be trucked to the WUG to meet minimum sanitary and consumptive needs.
18. How were adverse economic impacts phased in for varying degrees of water shortages?
Additional adjustments, varying with the intensity of the drought, were applied to the lost income/acre-foot estimates, as well as the lost jobs and tax measures. An impact elasticity function was used to phase in the degree of damage based upon the initial impact/acre-foot and the degree of water shortage. Water users were assumed to have a degree of flexibility in managing water use for small shortages. The figure below depicts a sample impact elasticity function where no damages are assumed to accrue for all shortages below a lower threshold (say a 5% shortage), and subsequent damage estimates/acre-foot increase linearly up to the initial estimate of lost income/acre-foot ($1,000/acre-foot in the figure). A second threshold (40% in the figure) serves as the level of shortage for which all damages are assigned the baseline lost income/acre-foot value. Lost income values for percent needs between the two thresholds were obtained by linear interpolation between zero and the baseline income/acre-foot estimate (i.e., $1,000/acre-foot in the figure).
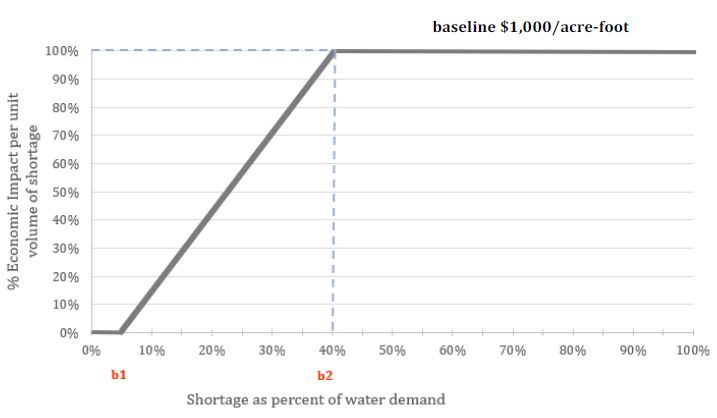
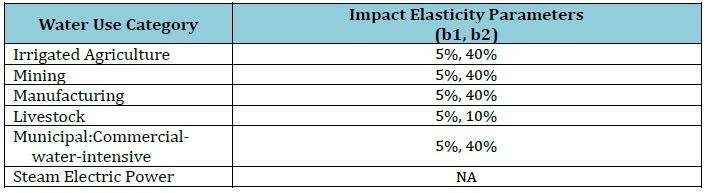
Lower and upper thresholds (b1 and b2, respectively) were specified for each water use category as shown below, and this methodology was used for the final impact estimates for lost income, jobs, and taxes. Note that the impact elasticity methodology was not used for the steam electric power water use category. Supplemental power purchases from the electric power grid would have to be made at the full expected price of electricity, with no phase-in of adverse impacts.
Navigate to the TWDB Planning Data Homepage