Report 326 By Gail Duffin and Steven P. Musick | January 1991
Note that the oversize fold out maps were pulled from the report and scanned separately (and not collated back into the digital report). They account for "missing pages" in the report as follows:
- pages 3-4 = figure 1
- pgs 9-19 = figs 2, 3, 4, 5, 6, 7
- pgs 21-28 = figs 8, 9, 10, 11
- pgs 33-40 = figs 12, 13, 14, 15
- pgs 47-48 = fig 16
- pgs 51-54 = figs 17, 18
- pgs 57-58 = fig 19
- pgs 63-65 = figs 20, 21
- pgs 67-68 = fig 22
- pgs 71-72 = fig 23
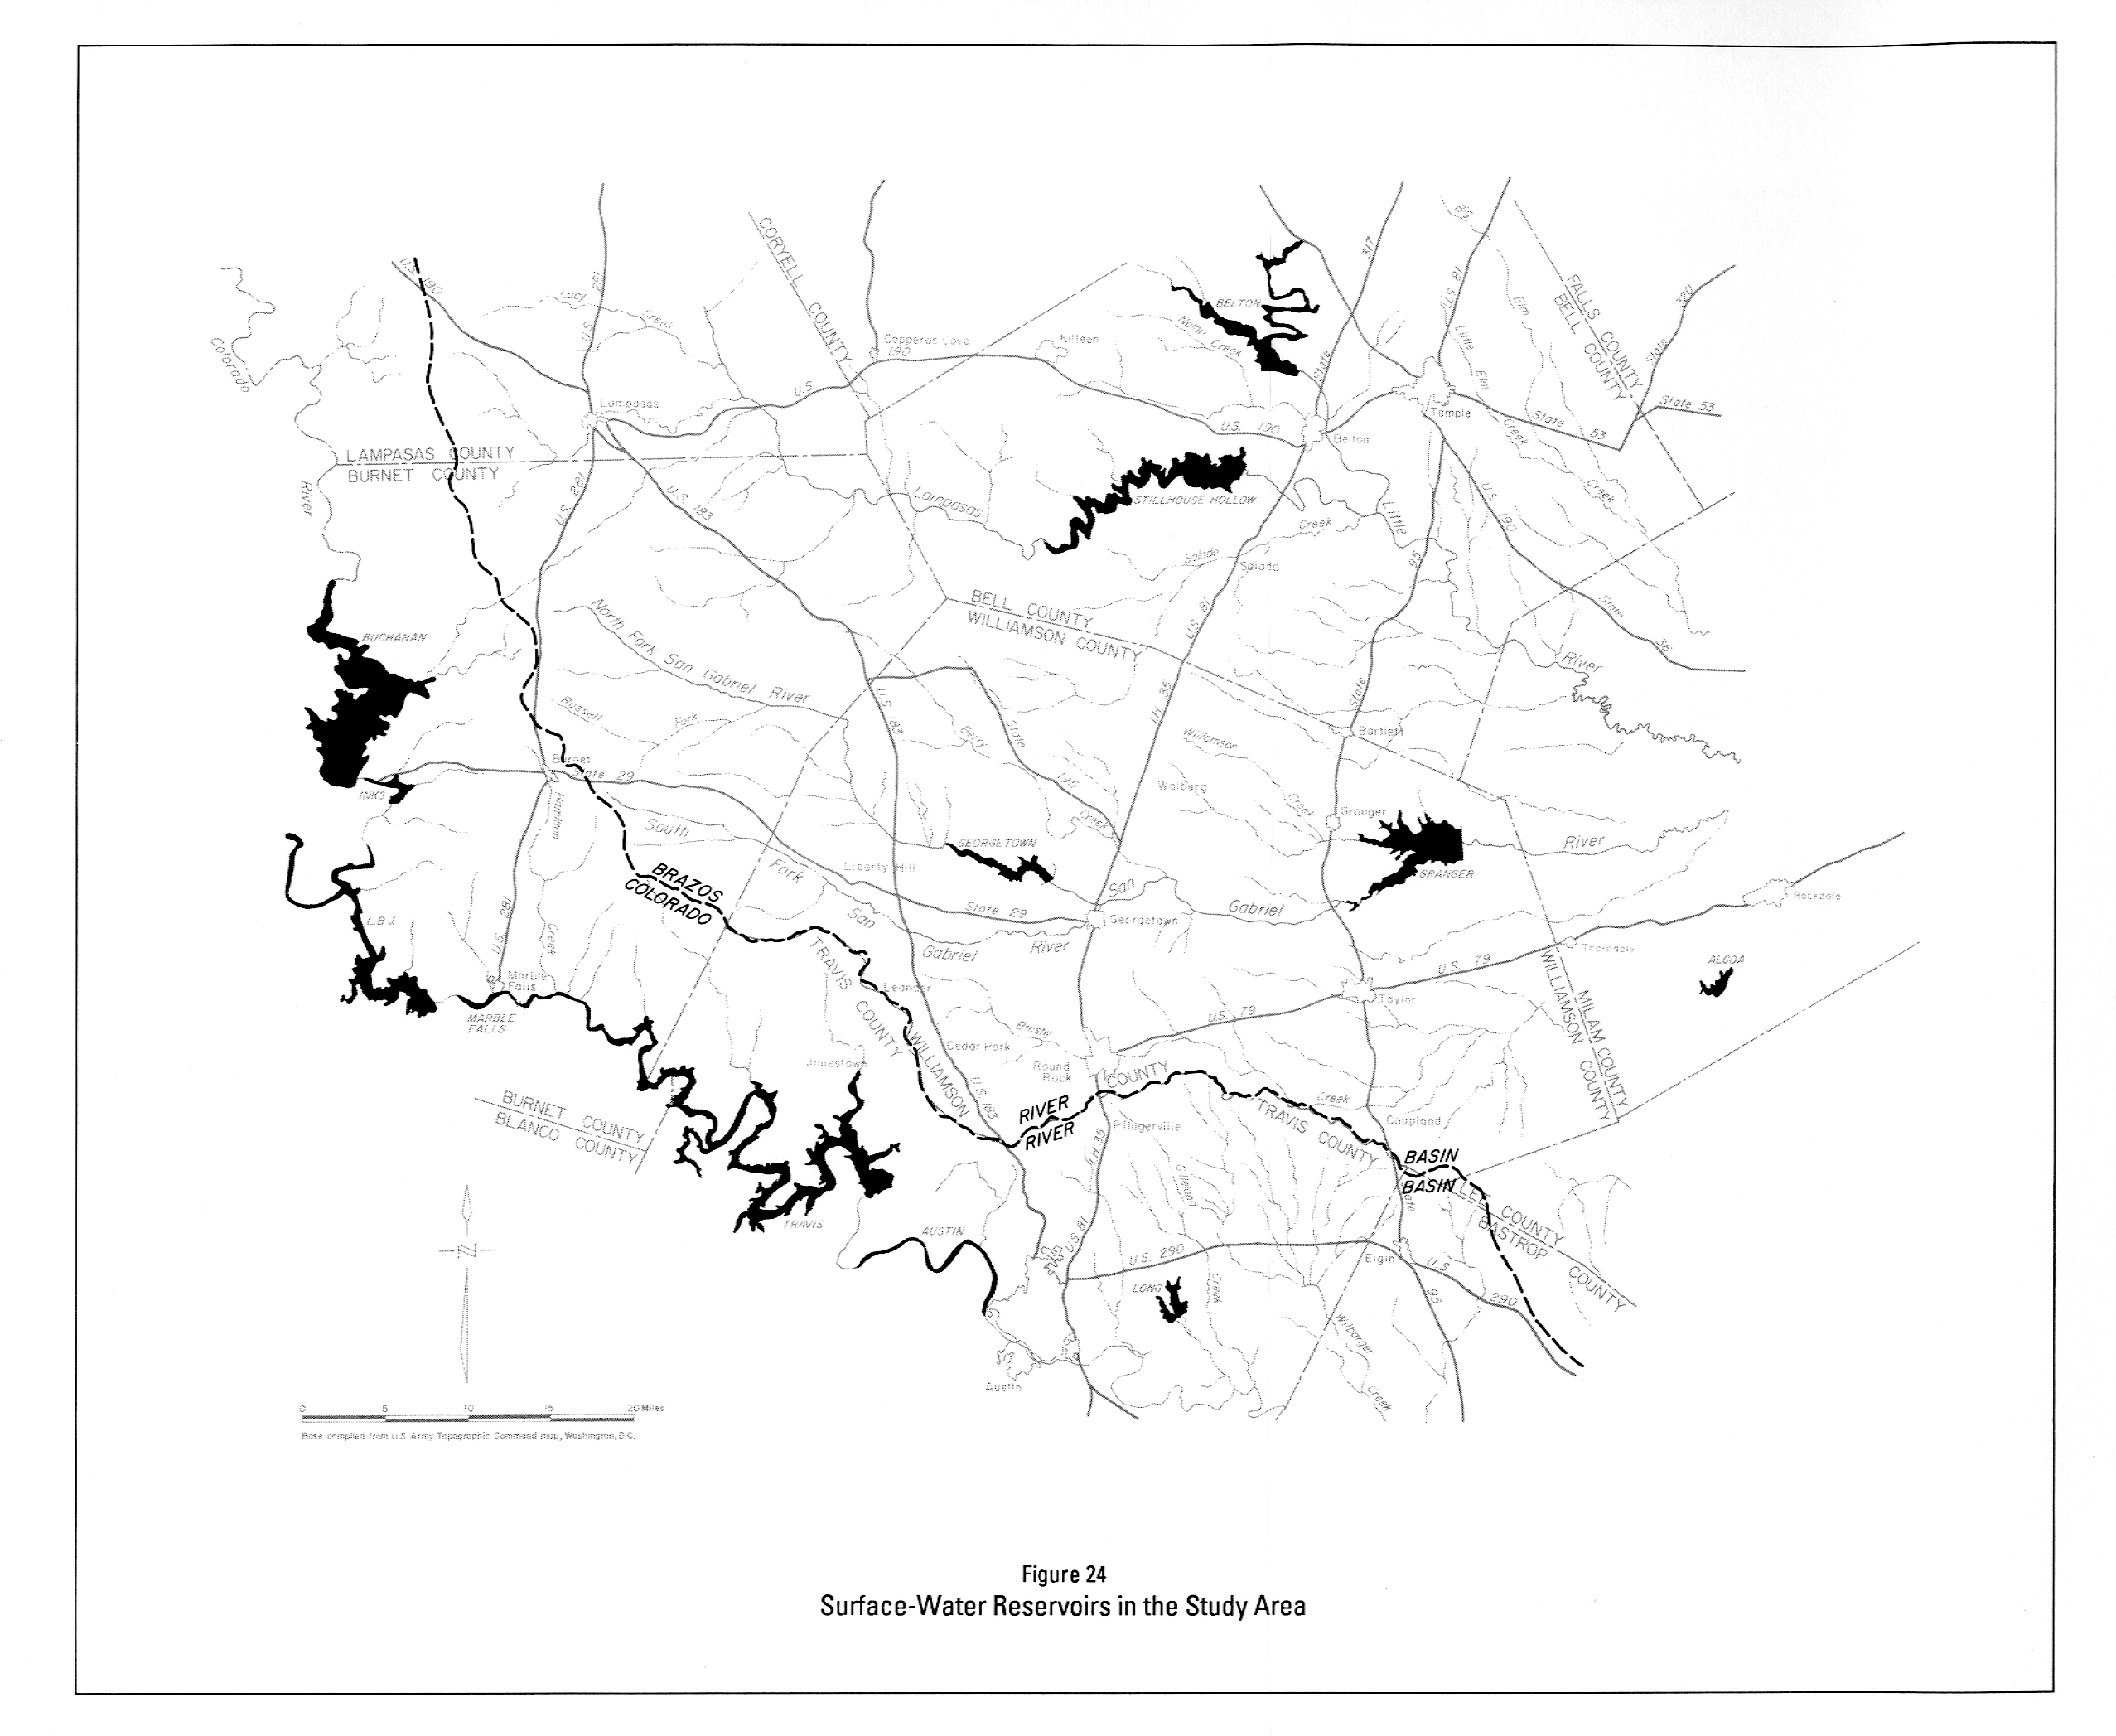
- pgs 89-90 = fig 24
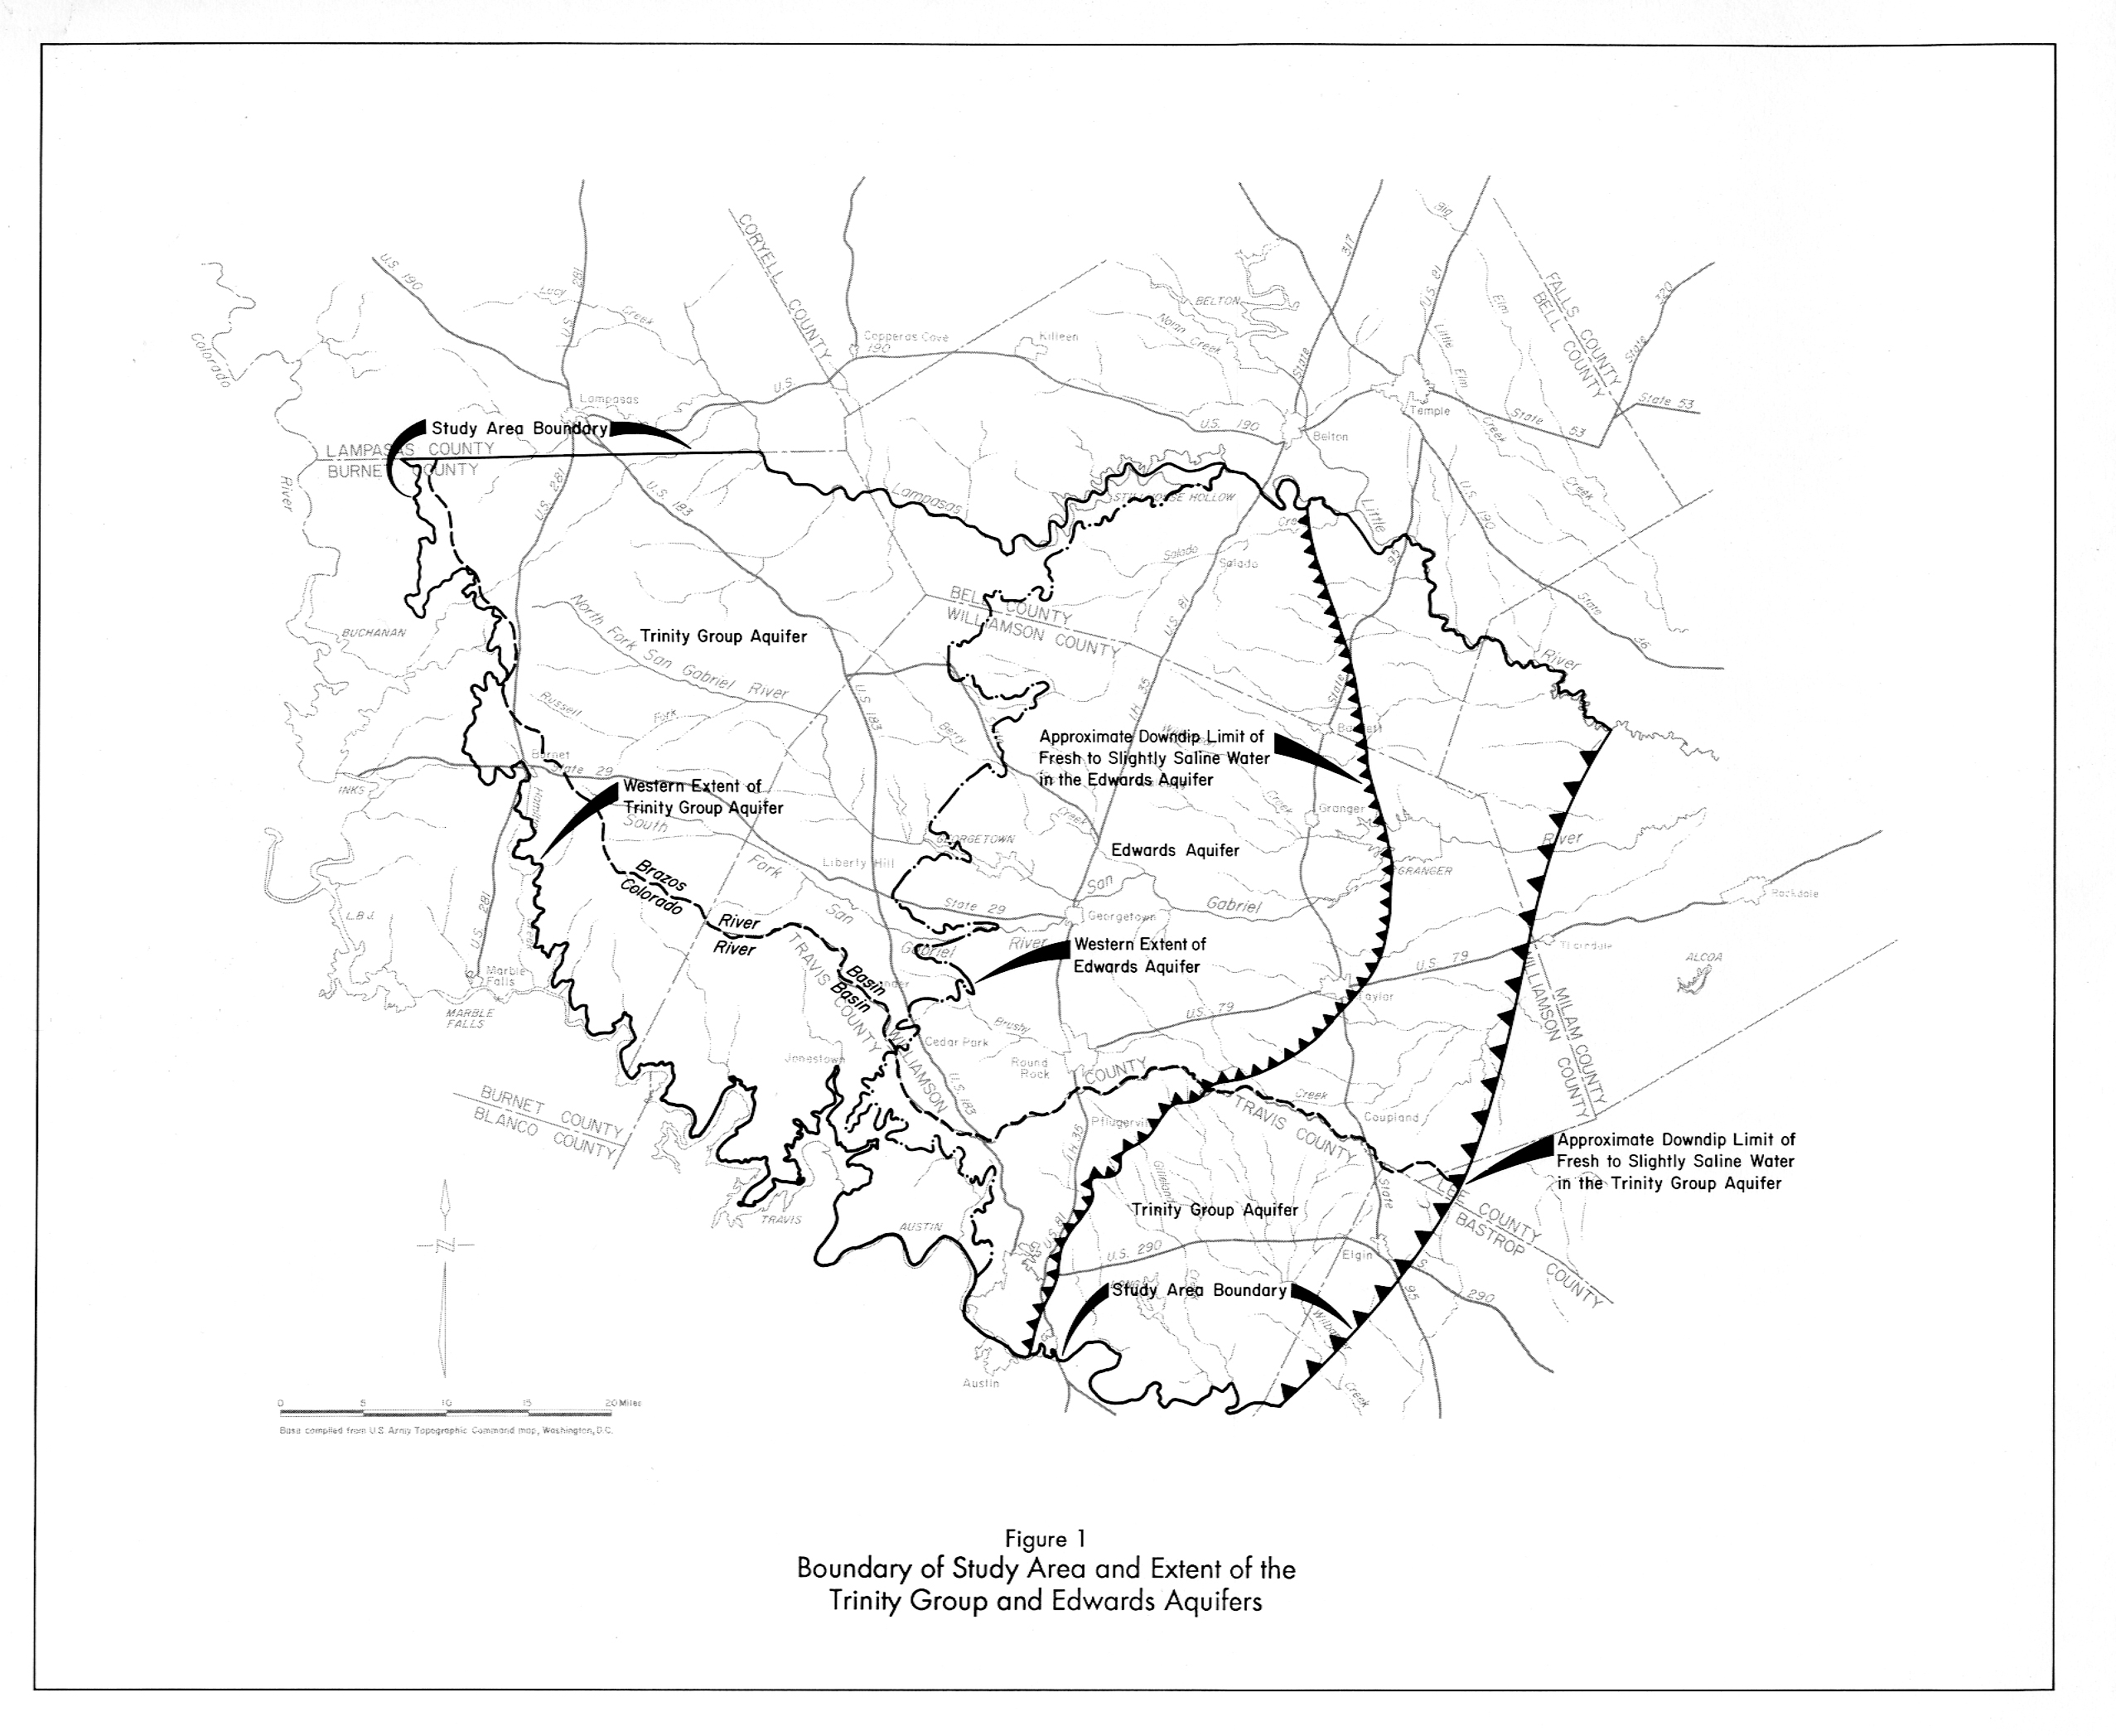
- Report 326 - Evaluation of Water Resources in Bell, Burnet, Travis, Williamson and Parts of Adjacent Counties, Texas
- Figure 1 - Boundary of Study Area and Extent of the Trinity Group and Edwards Aquifers
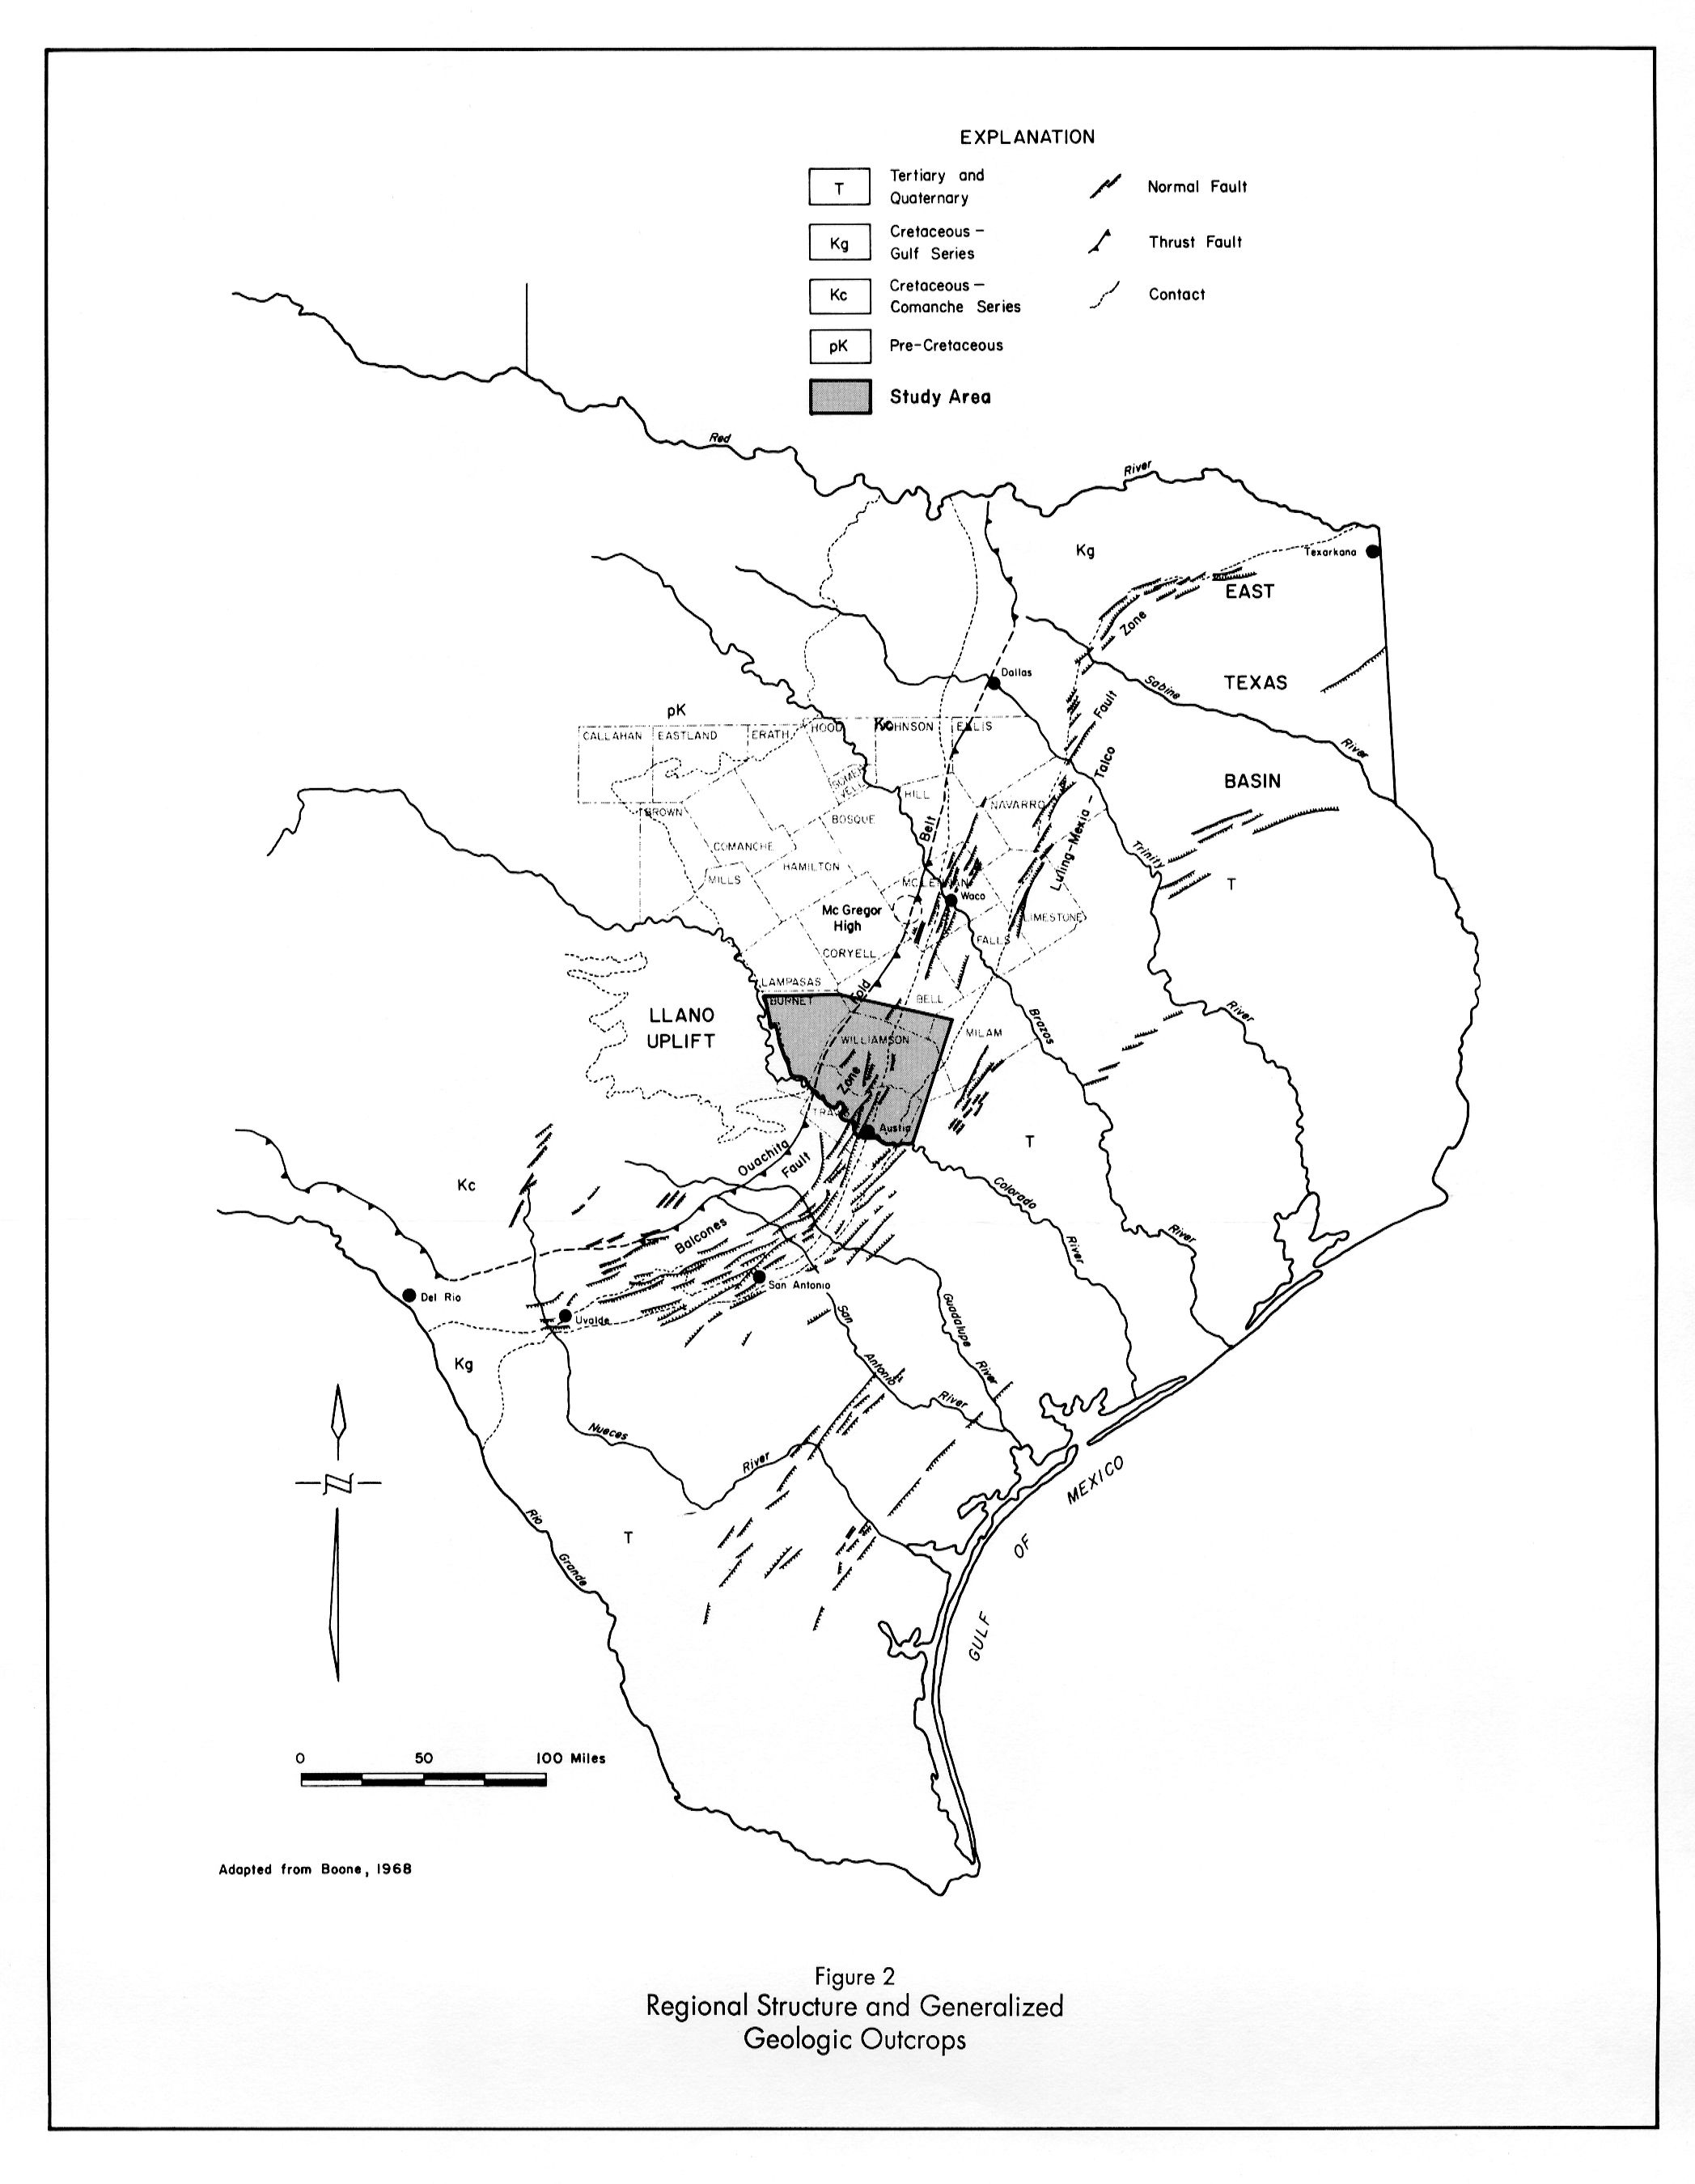
- Figure 2 - Regional Structure and Generalized Geologic Outcrops
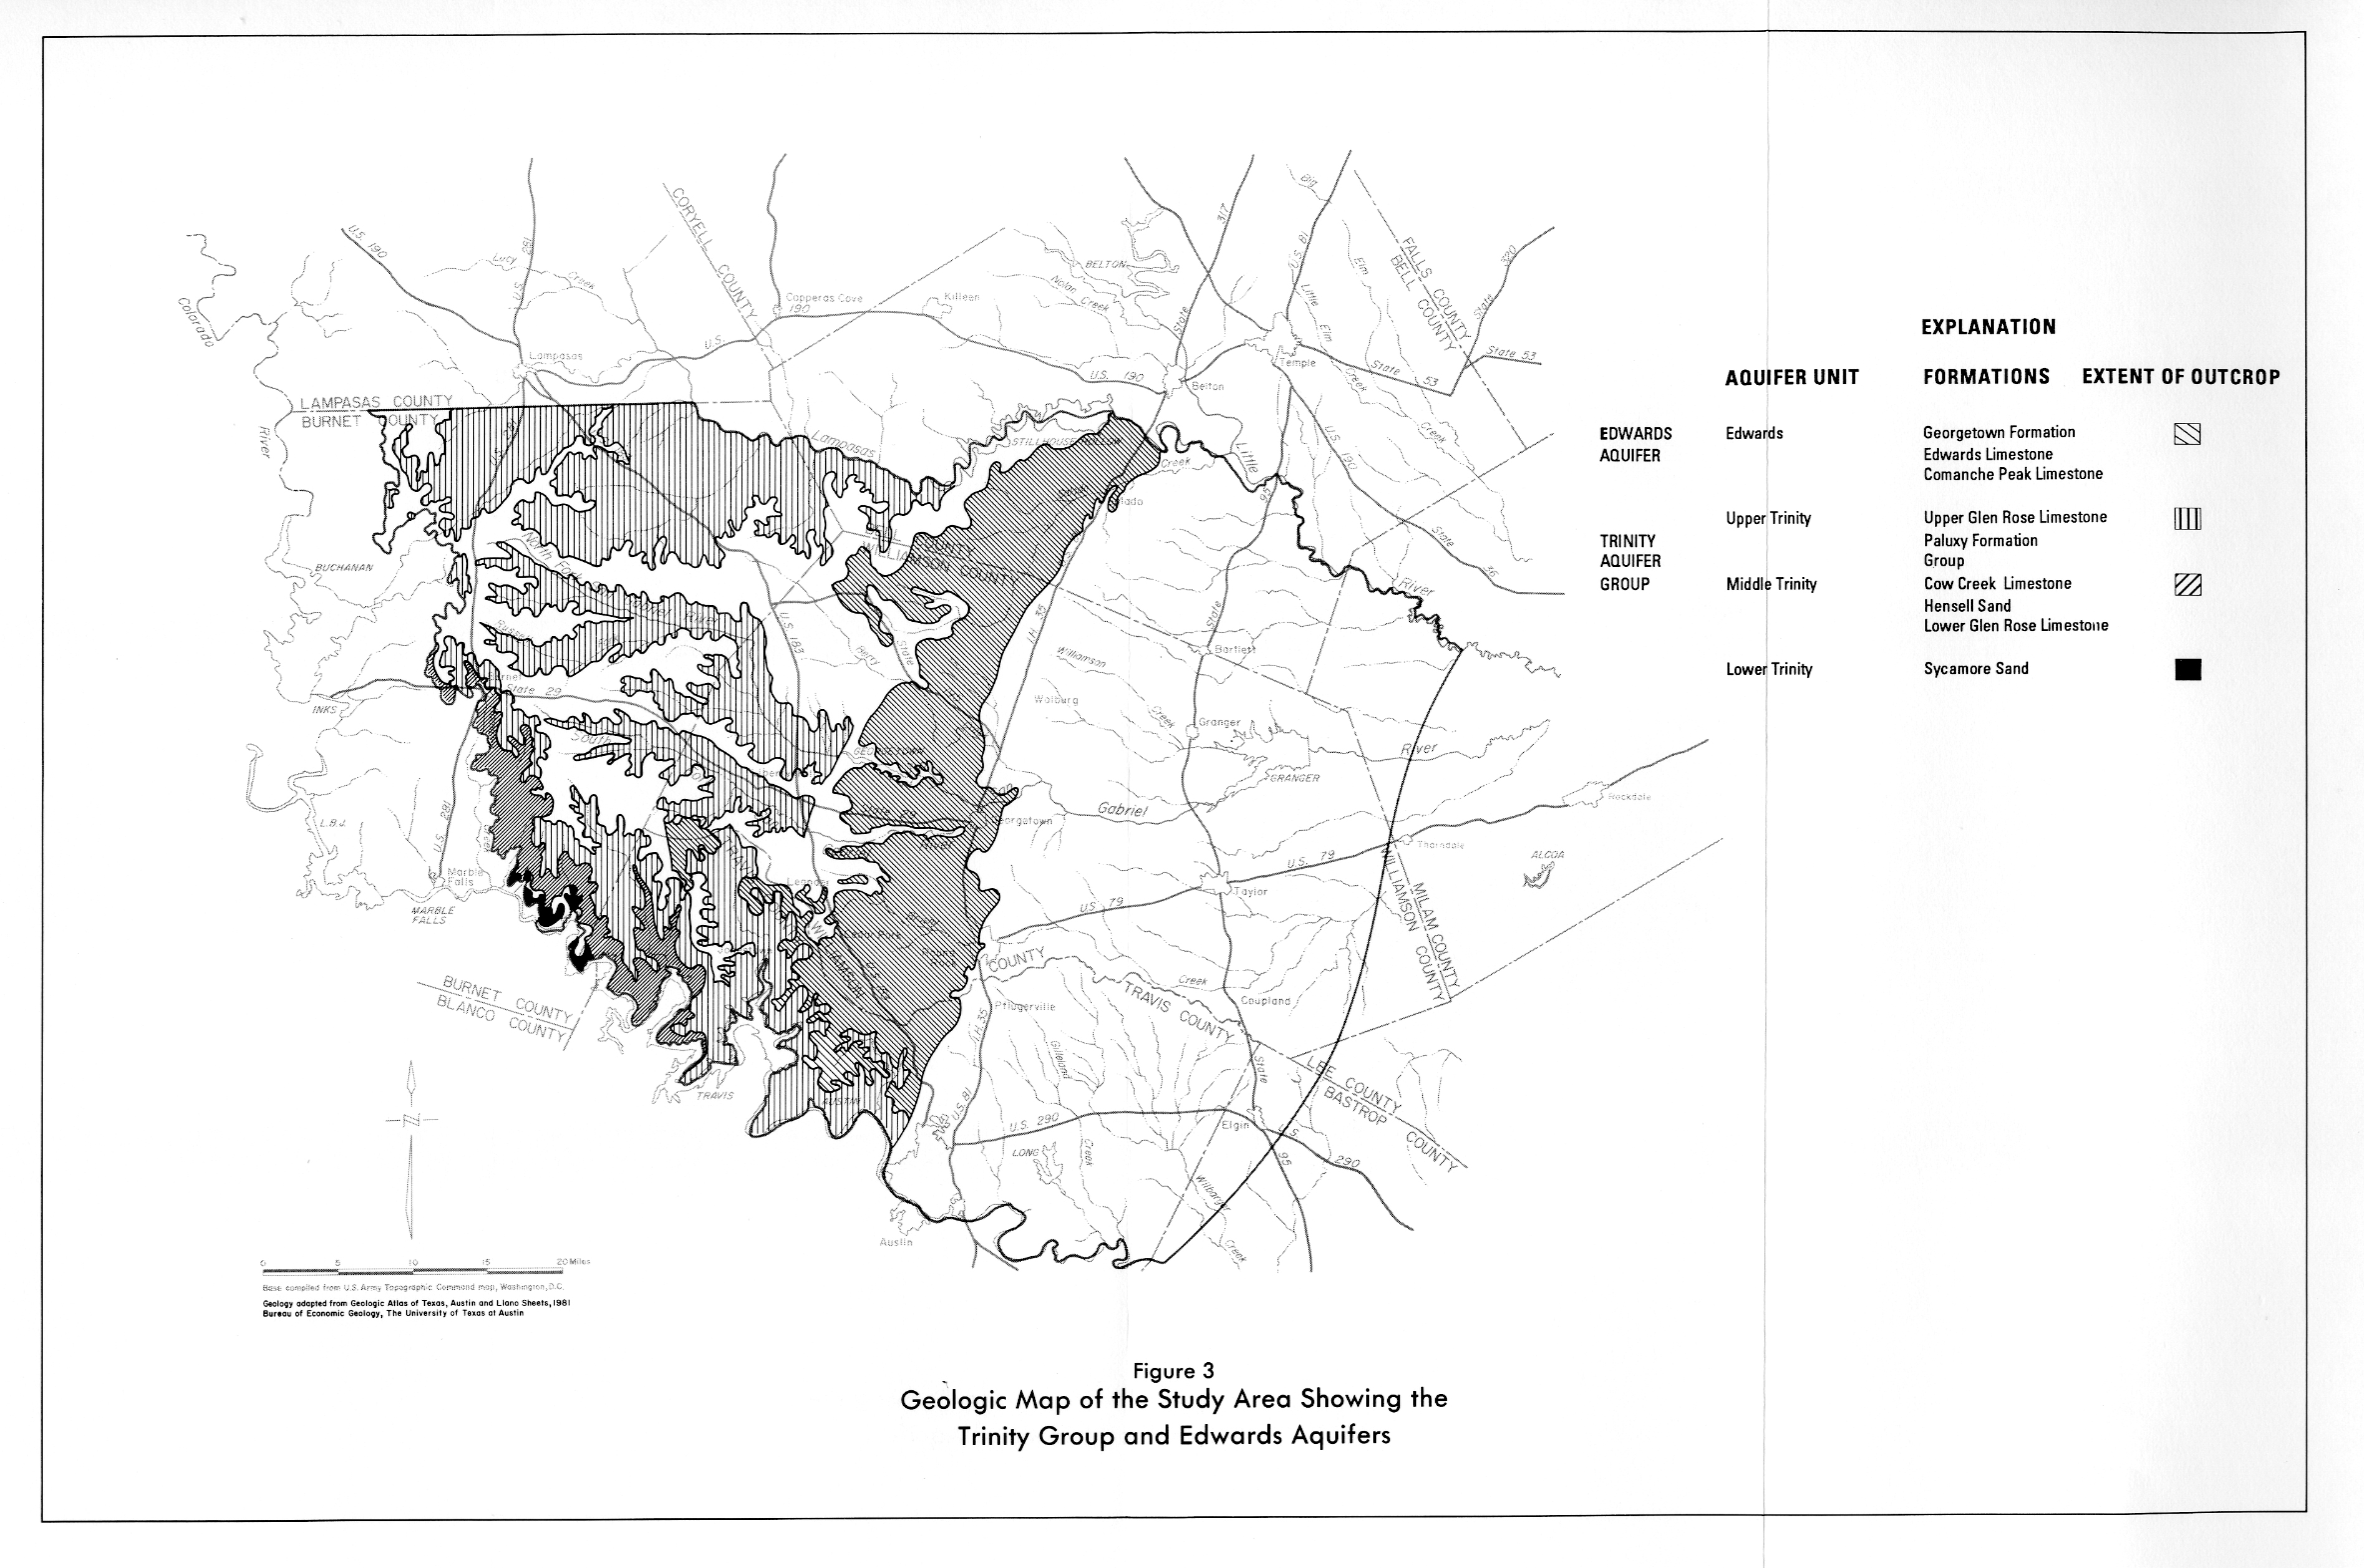
- Figure 3 - Geologic Map of the Study Area Showing the Trinity Group and Edwards Aquifers
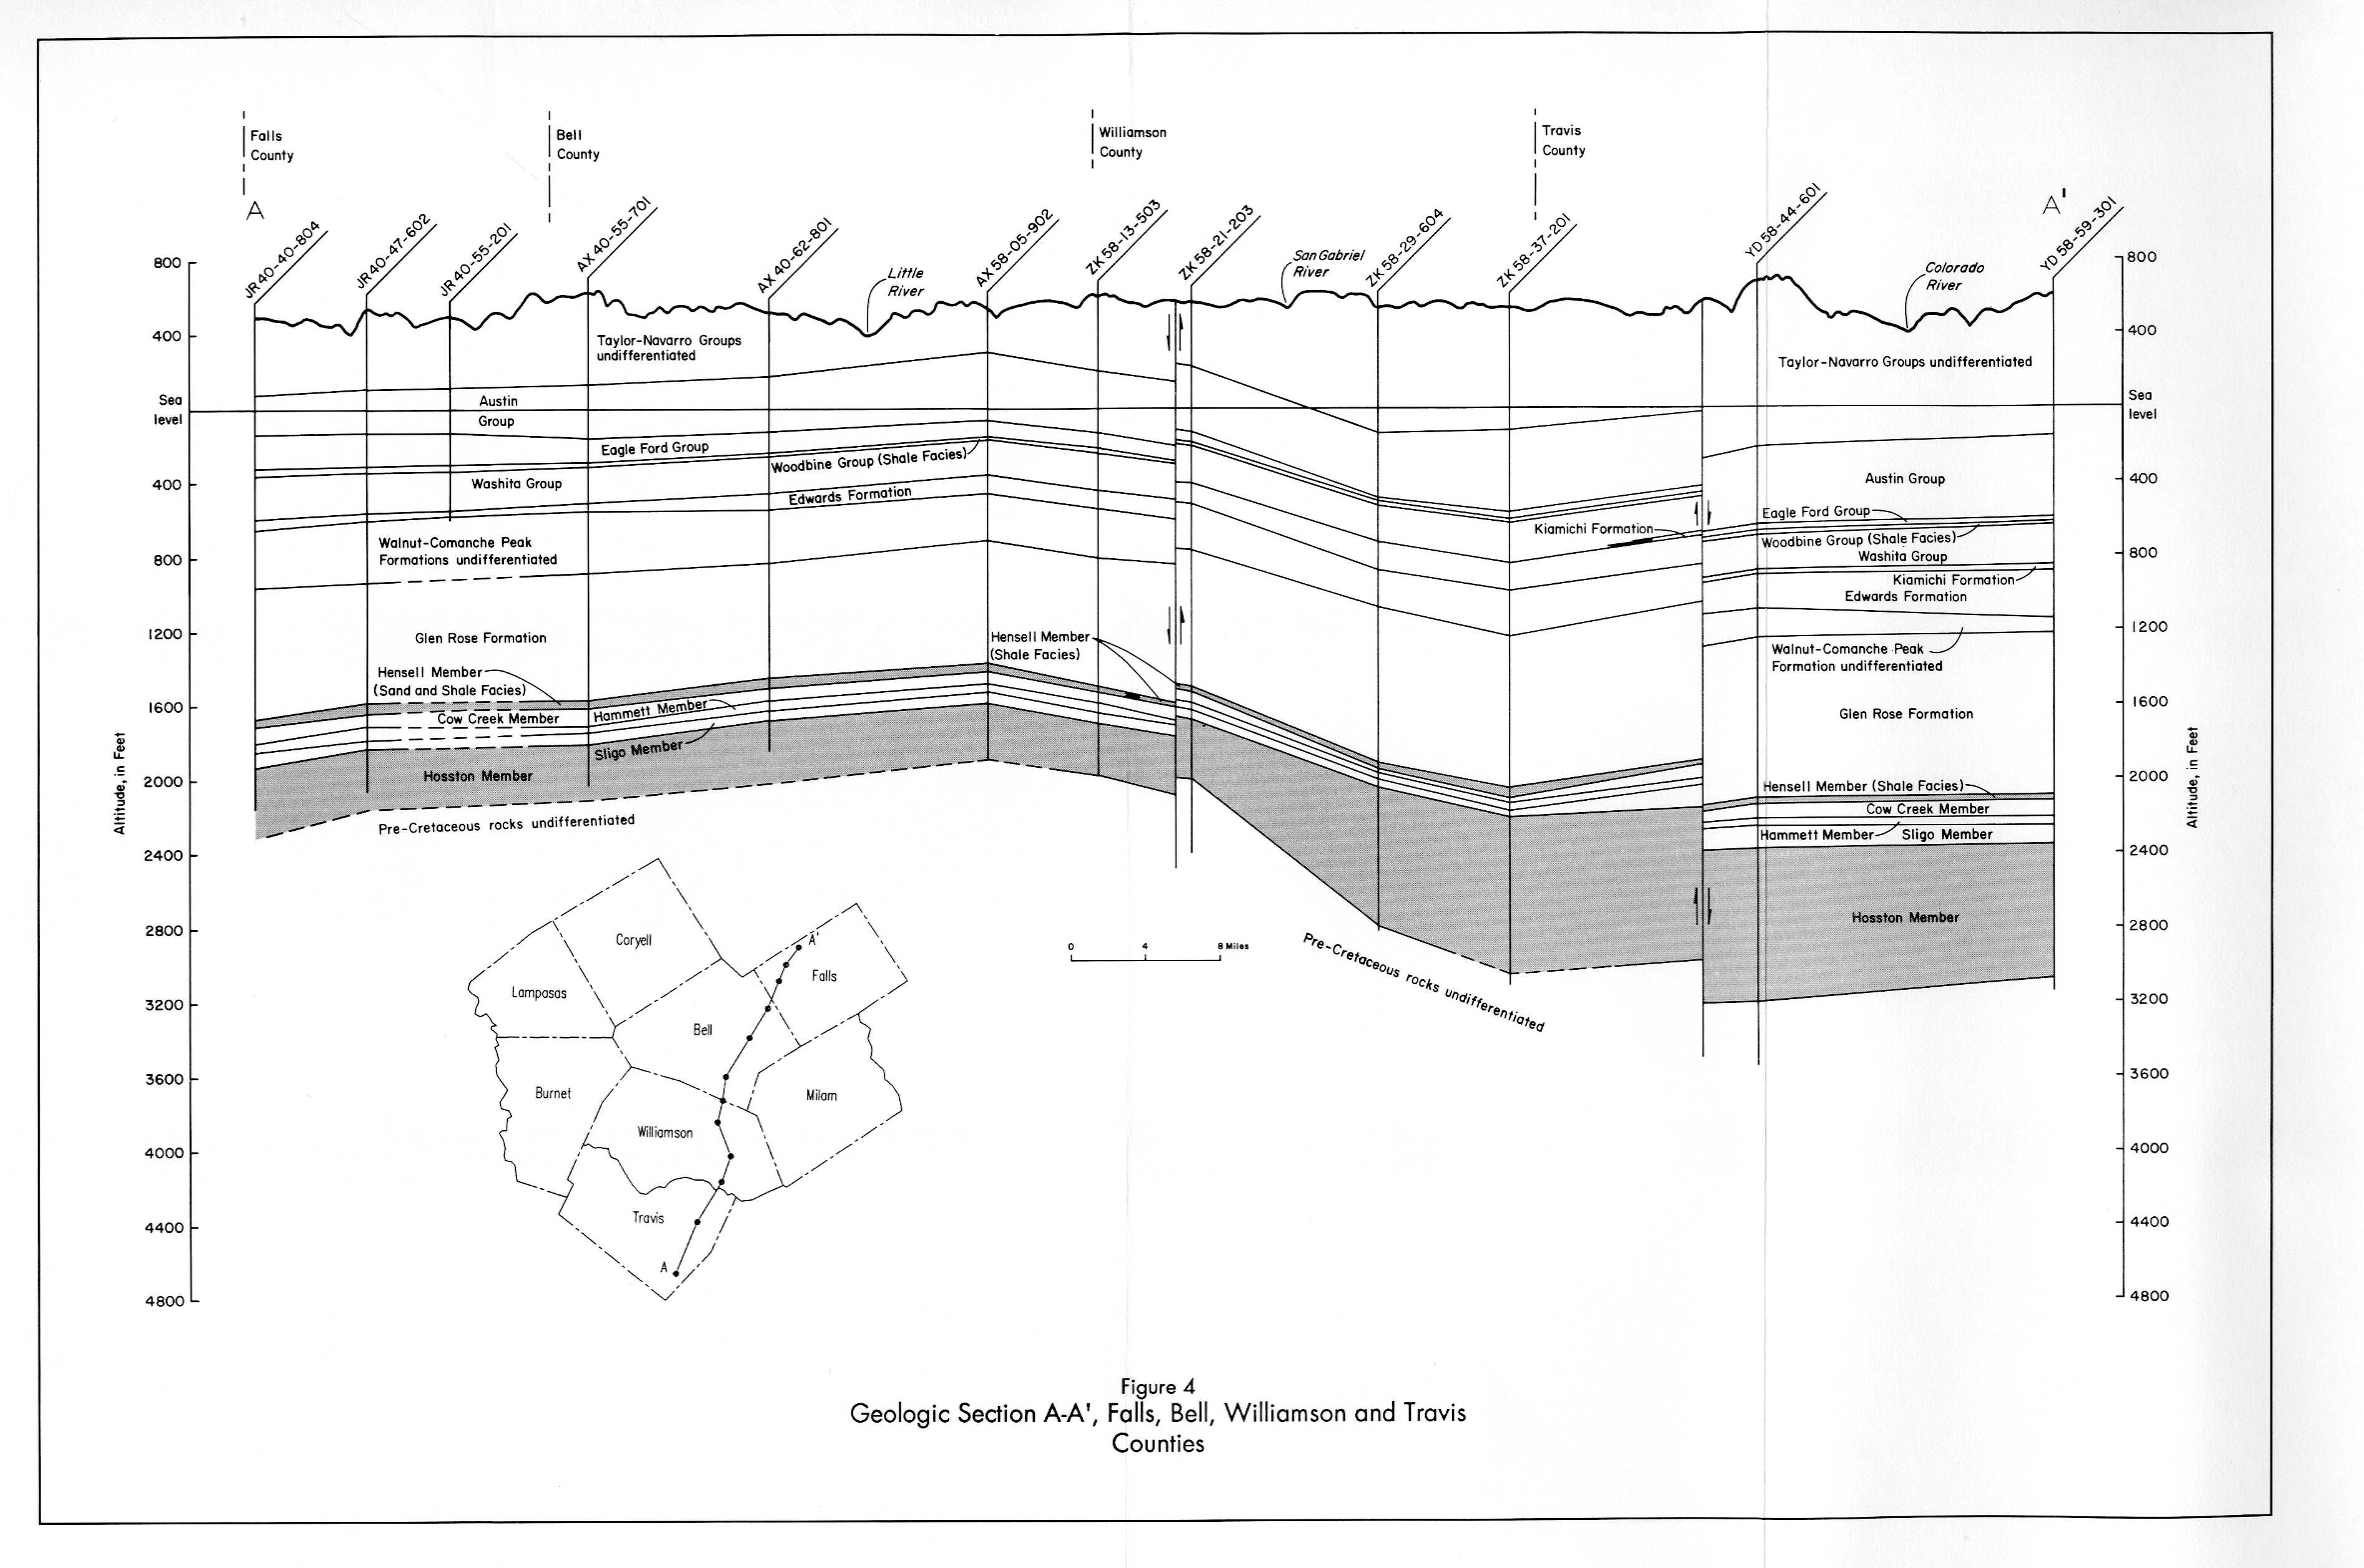
- Figure 4 - Geologic Section A-A', Falls, Bell, Williamson and Travis Counties
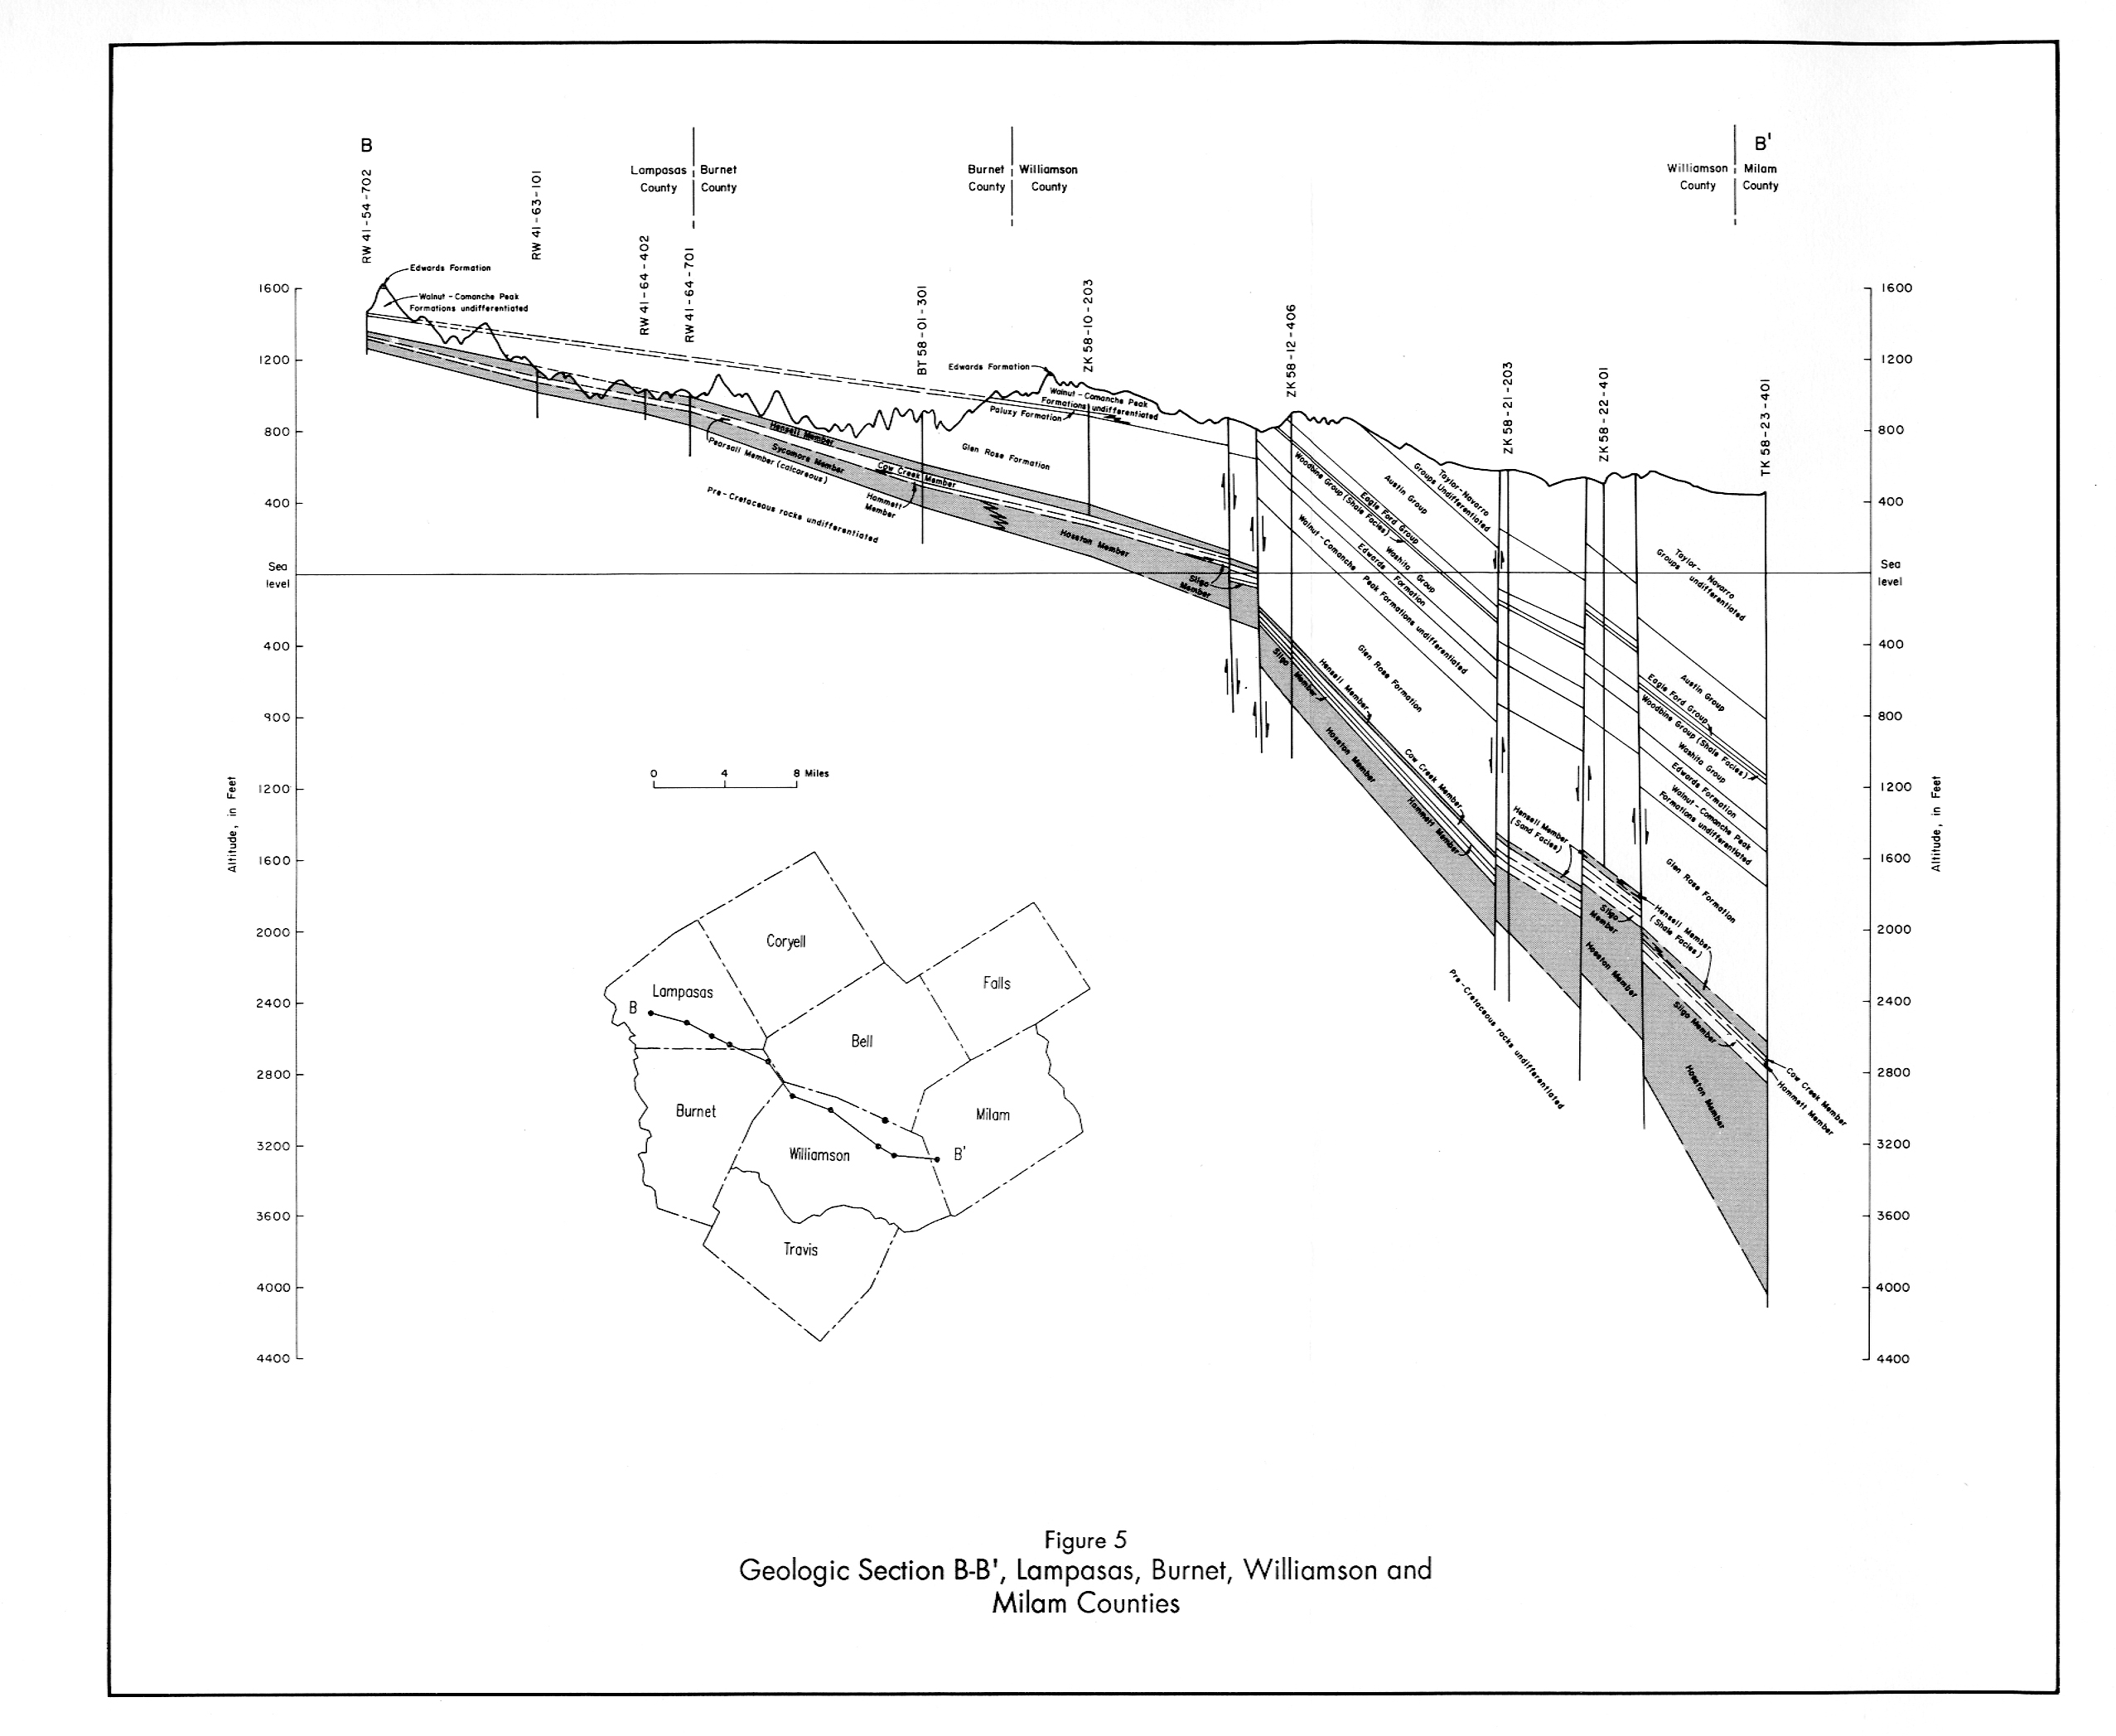
- Figure 5 - Geologic Section B-B', Lampasas, Burnet, Williamson, and Milam Counties
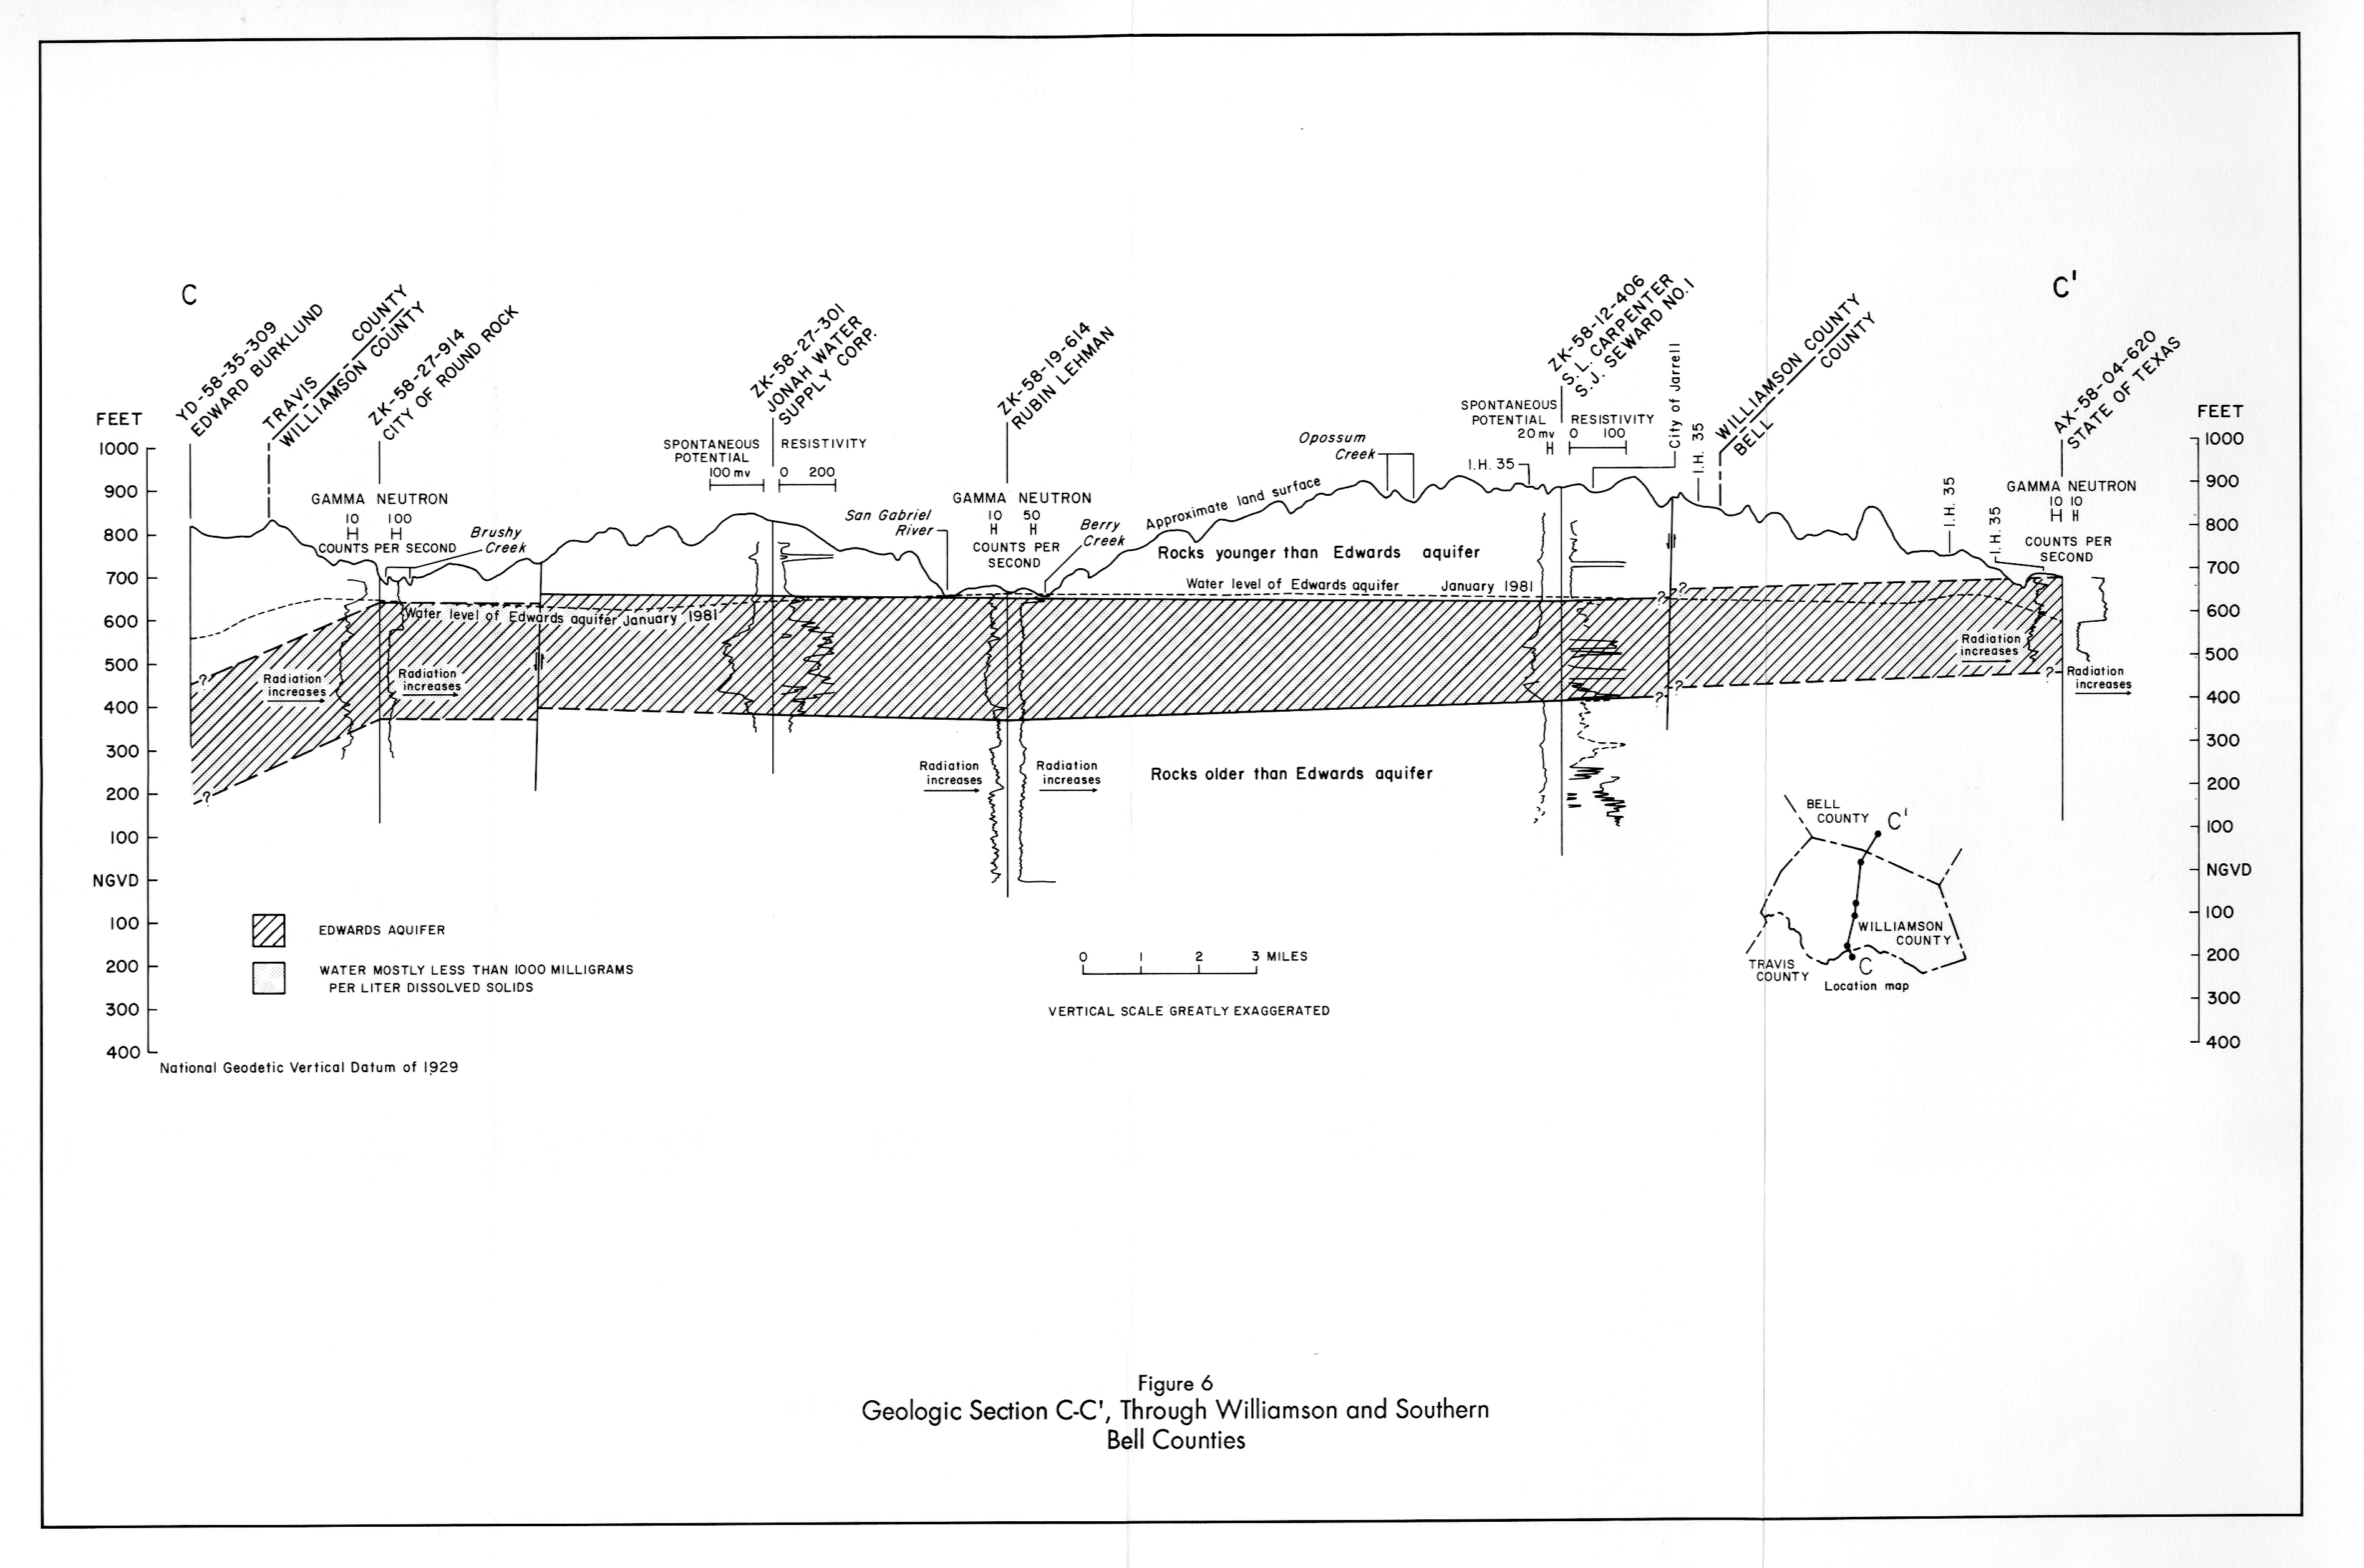
- Figure 6 - Geologic Section C-C', Through Williamson and Southern Bell Counties
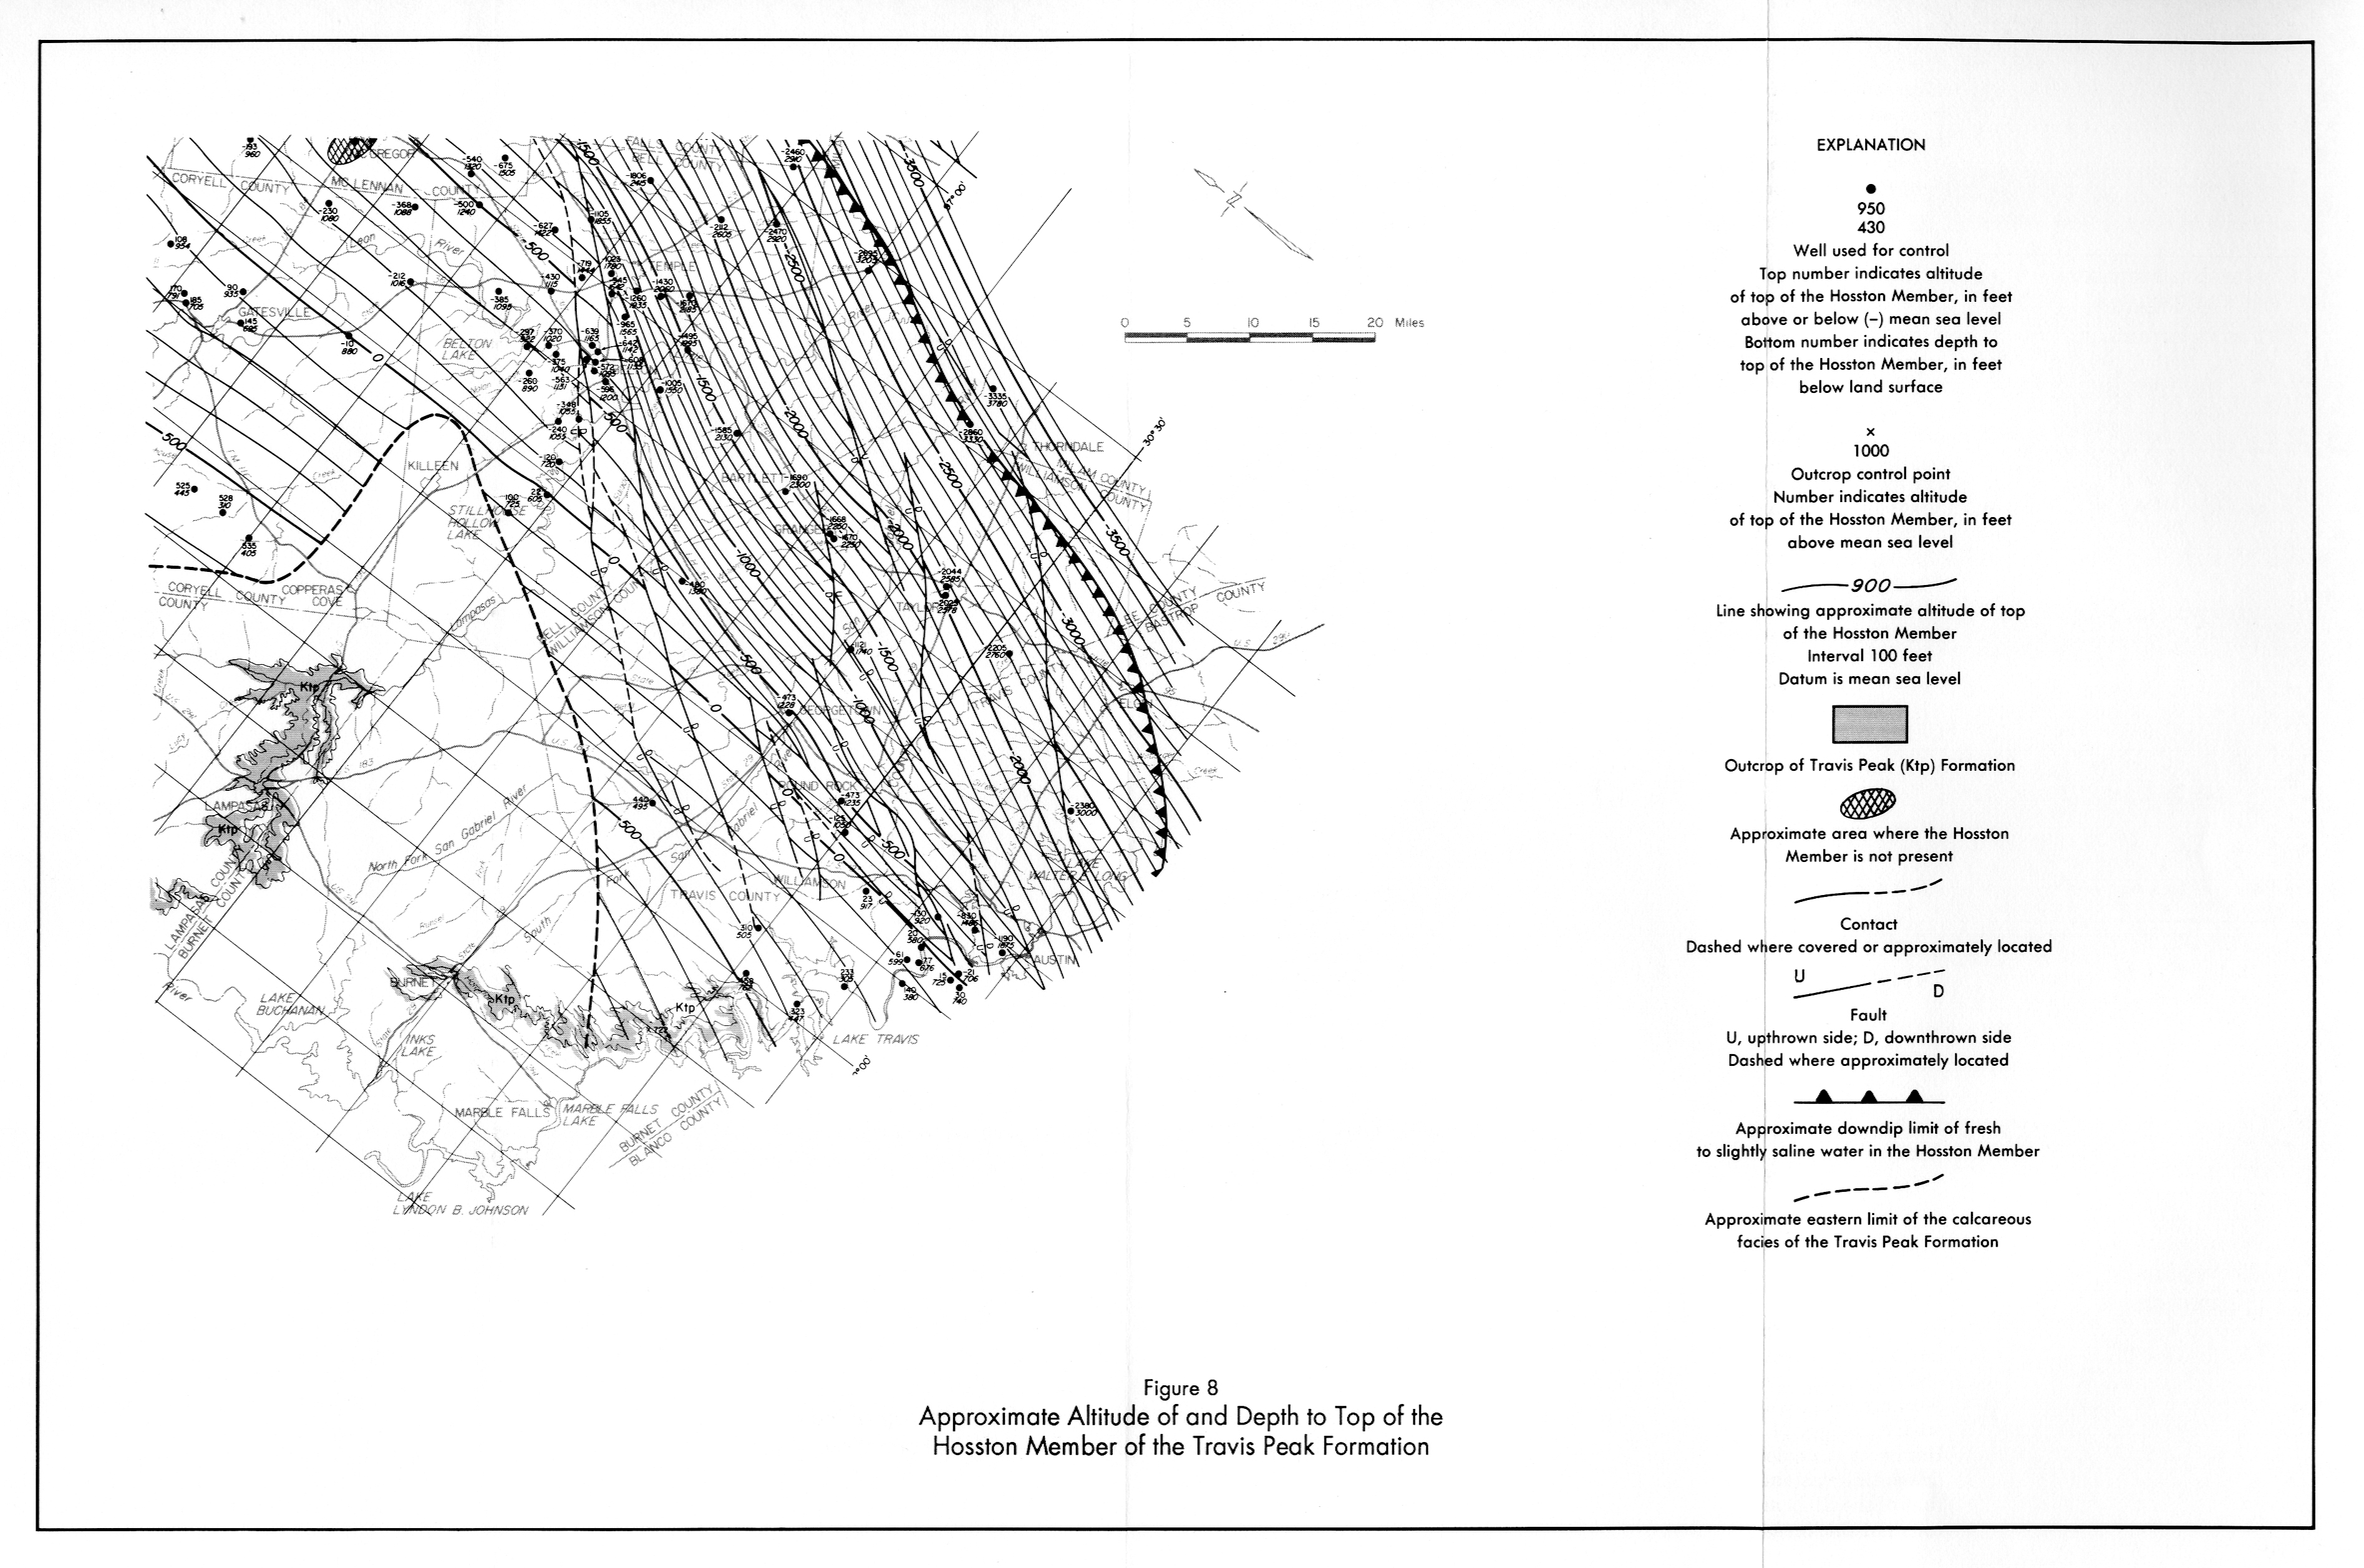
- Figure 8 - Approximate Altitude of and Depth to Top of the Hosston member of the Travis Peak Formation
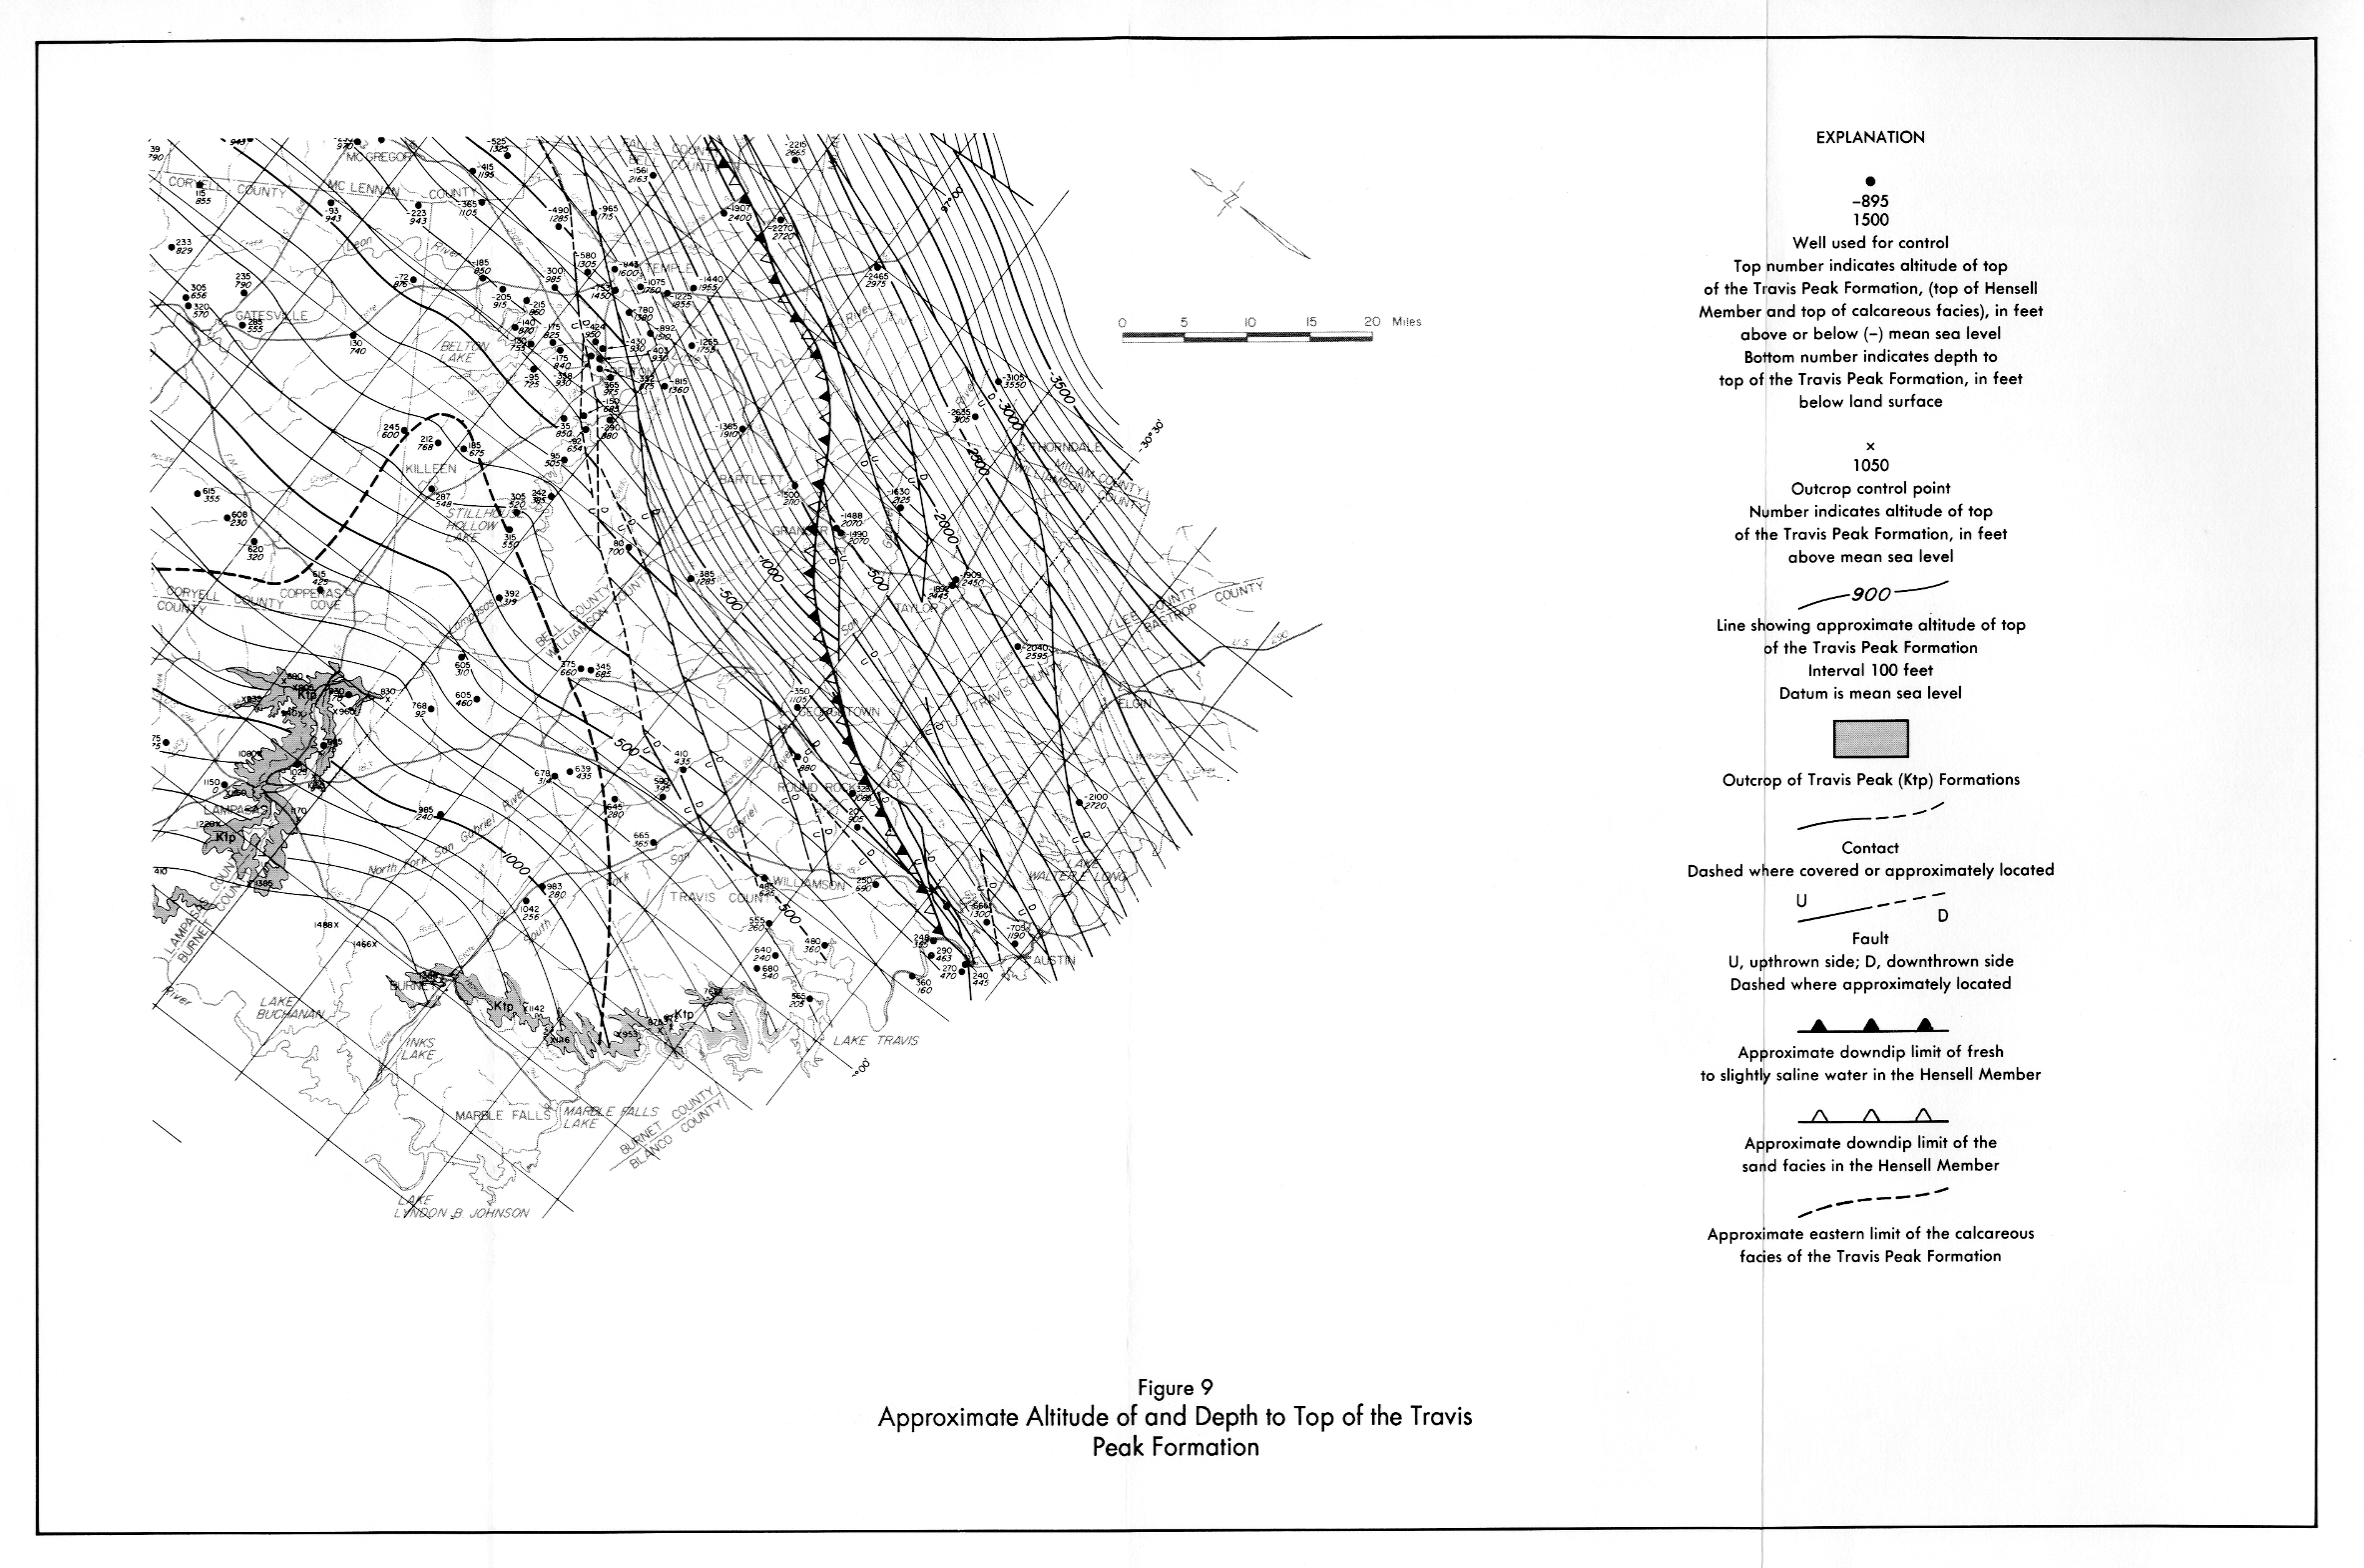
- Figure 9 - Approximate Altitude of and Depth to Top of the Travis Peak Formation
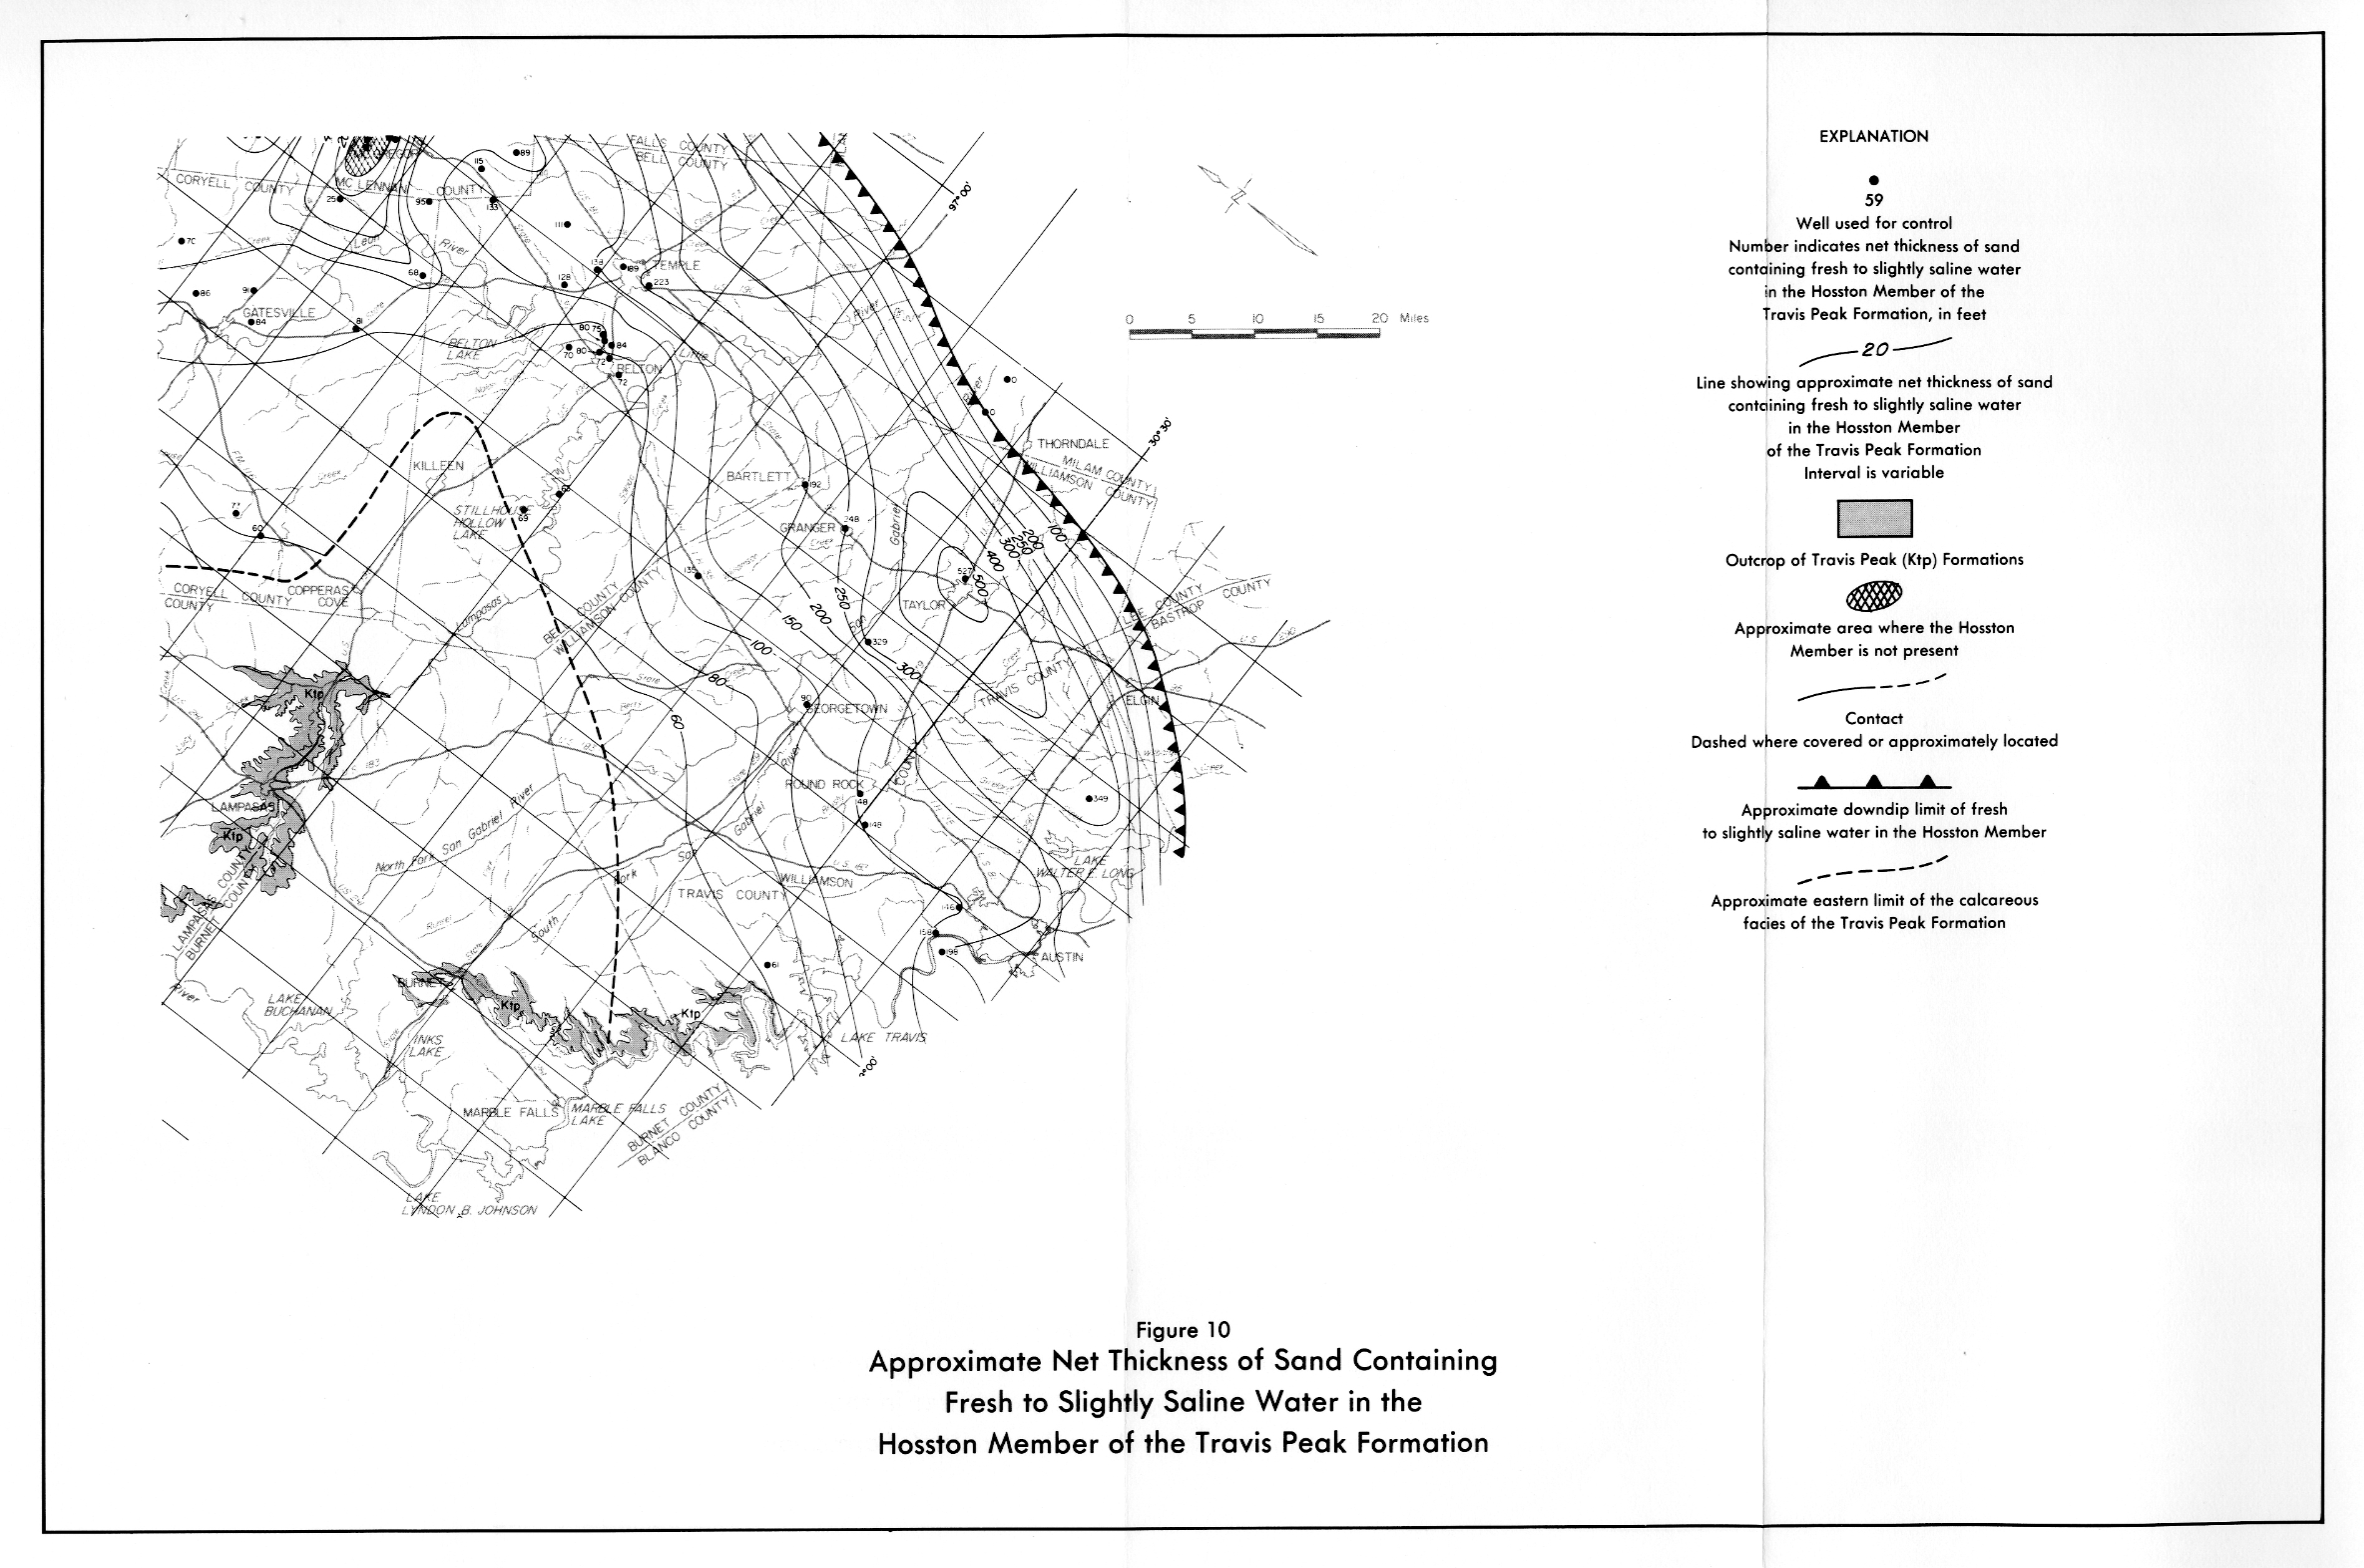
- Figure 10 - Approximate Net Thickness of Sand Containing Fresh to Slightly Saline Water in the Hosston Member of the Travis Peak Formation
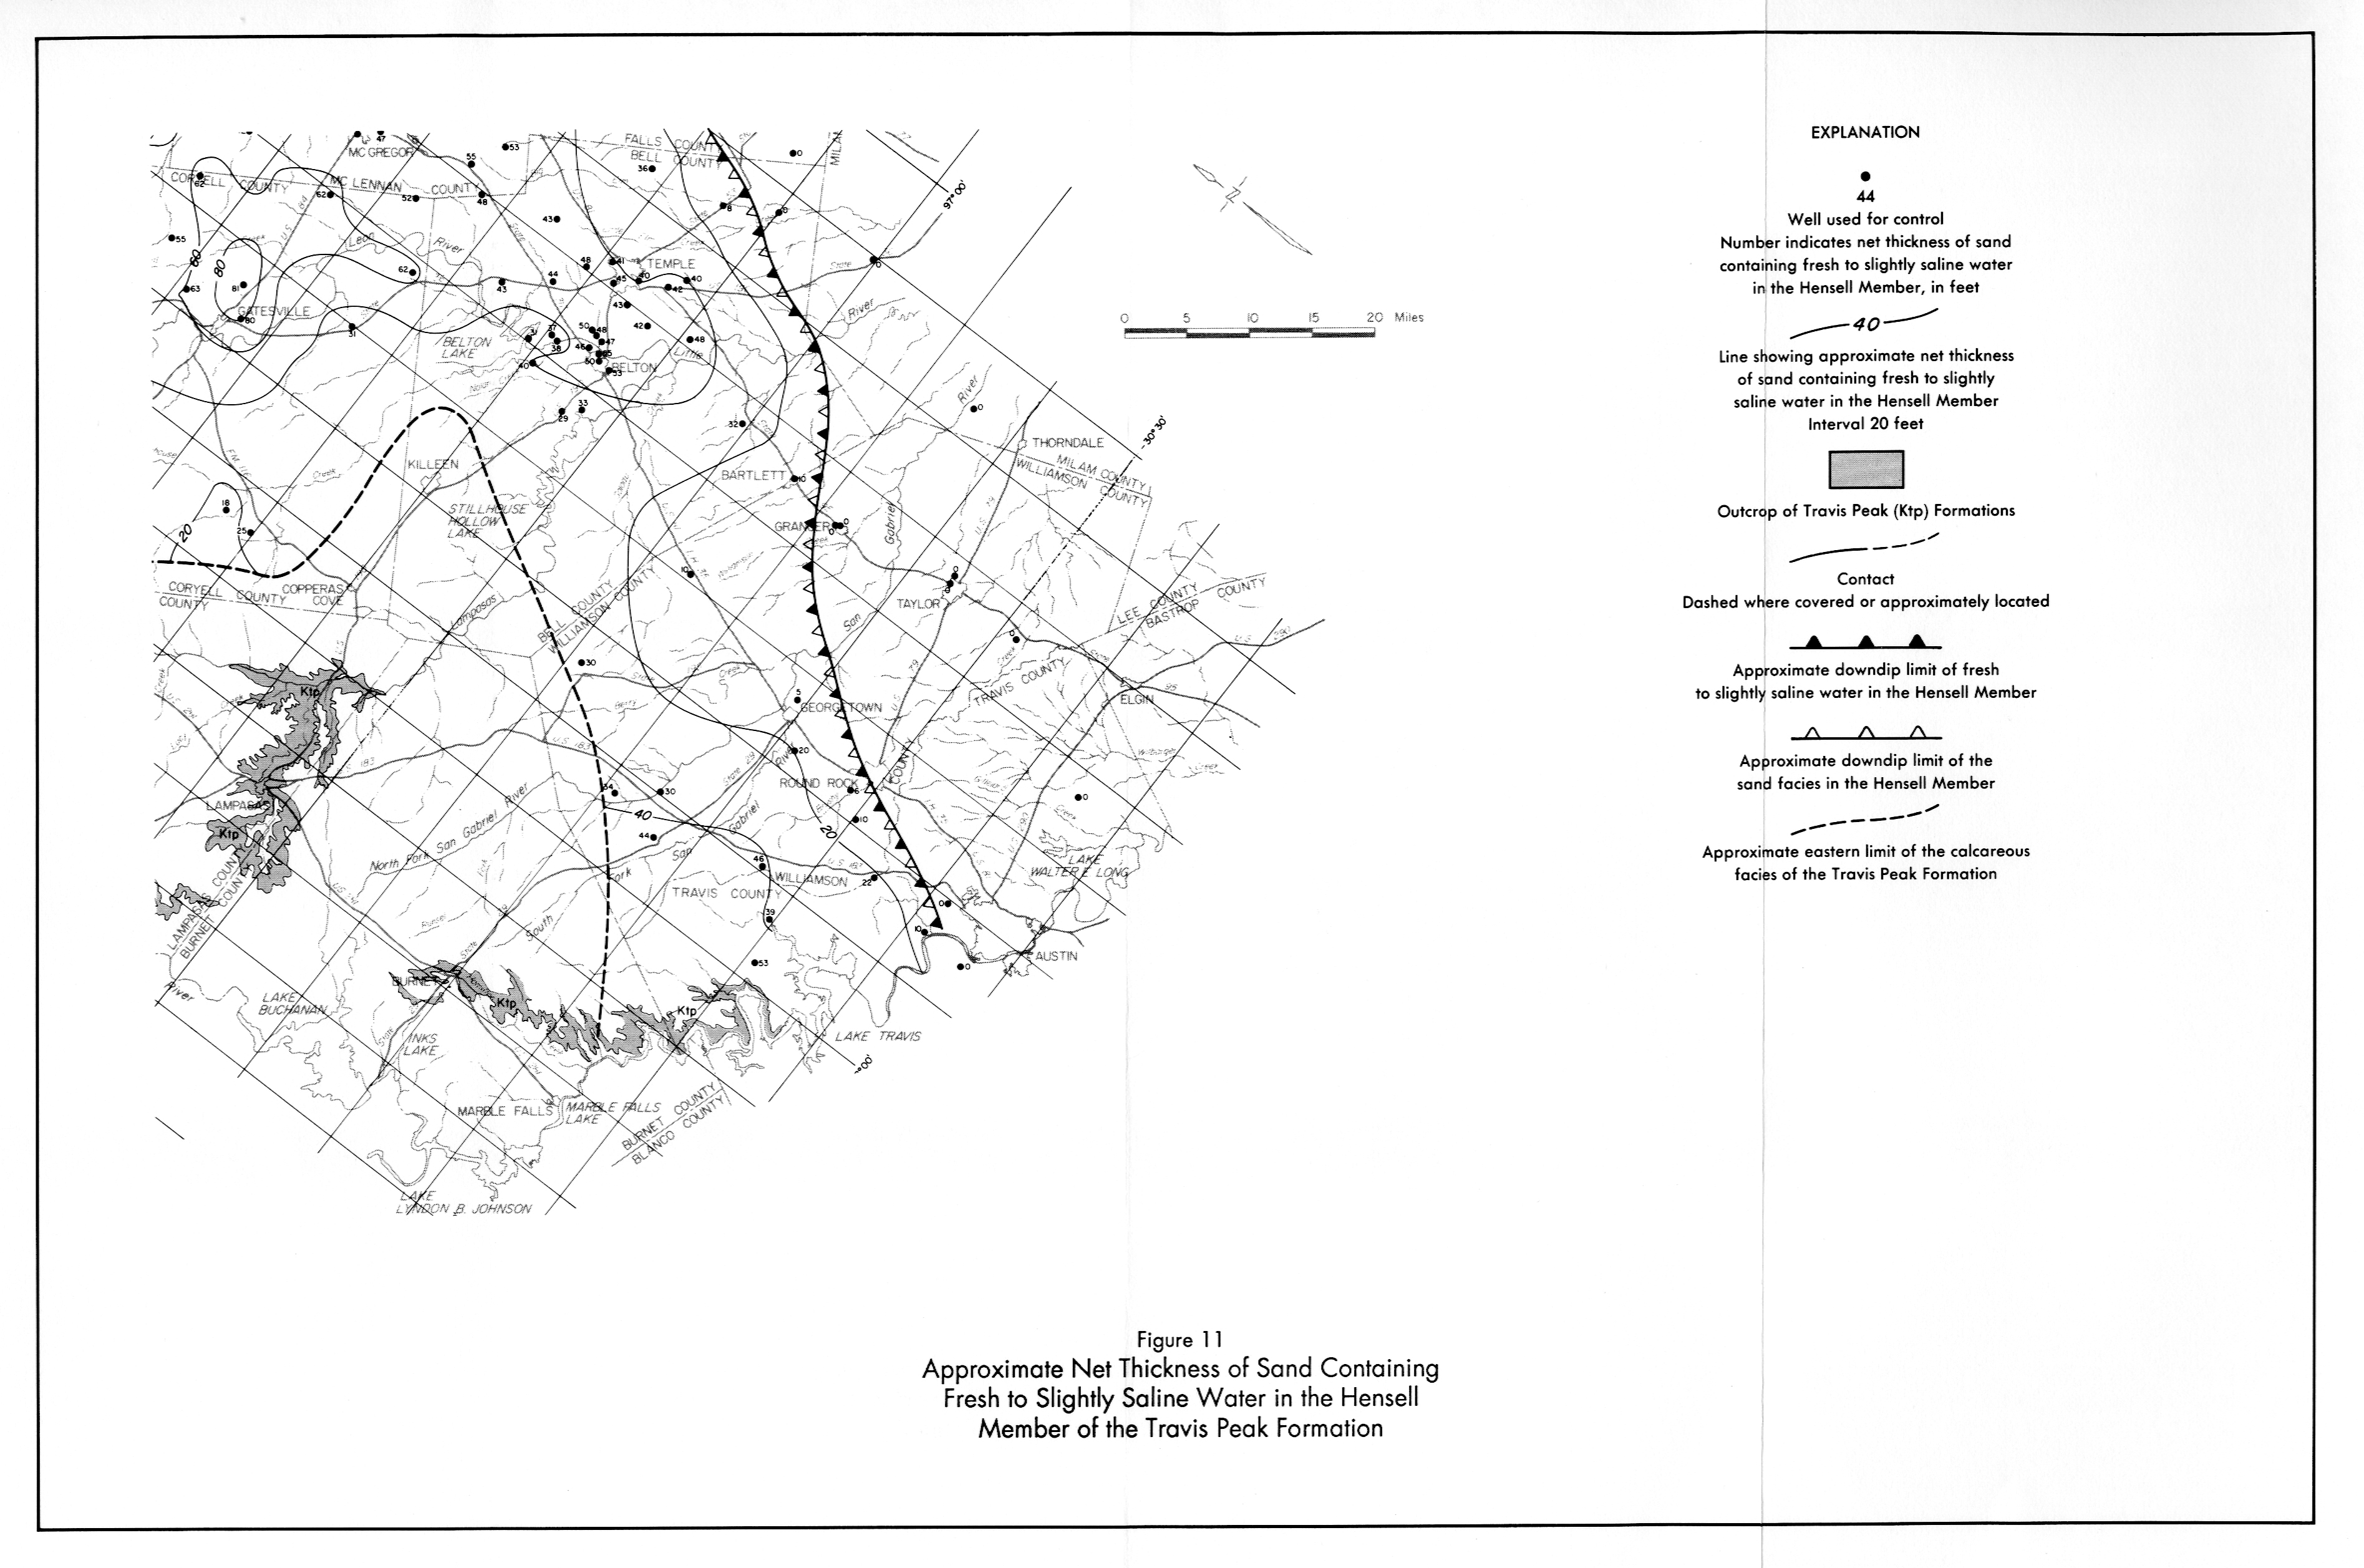
- Figure 11 - Approximate Net Thickness of Sand Containing Fresh to Slightly Saline Water in the Hensell Member of the Travis Peak Formation
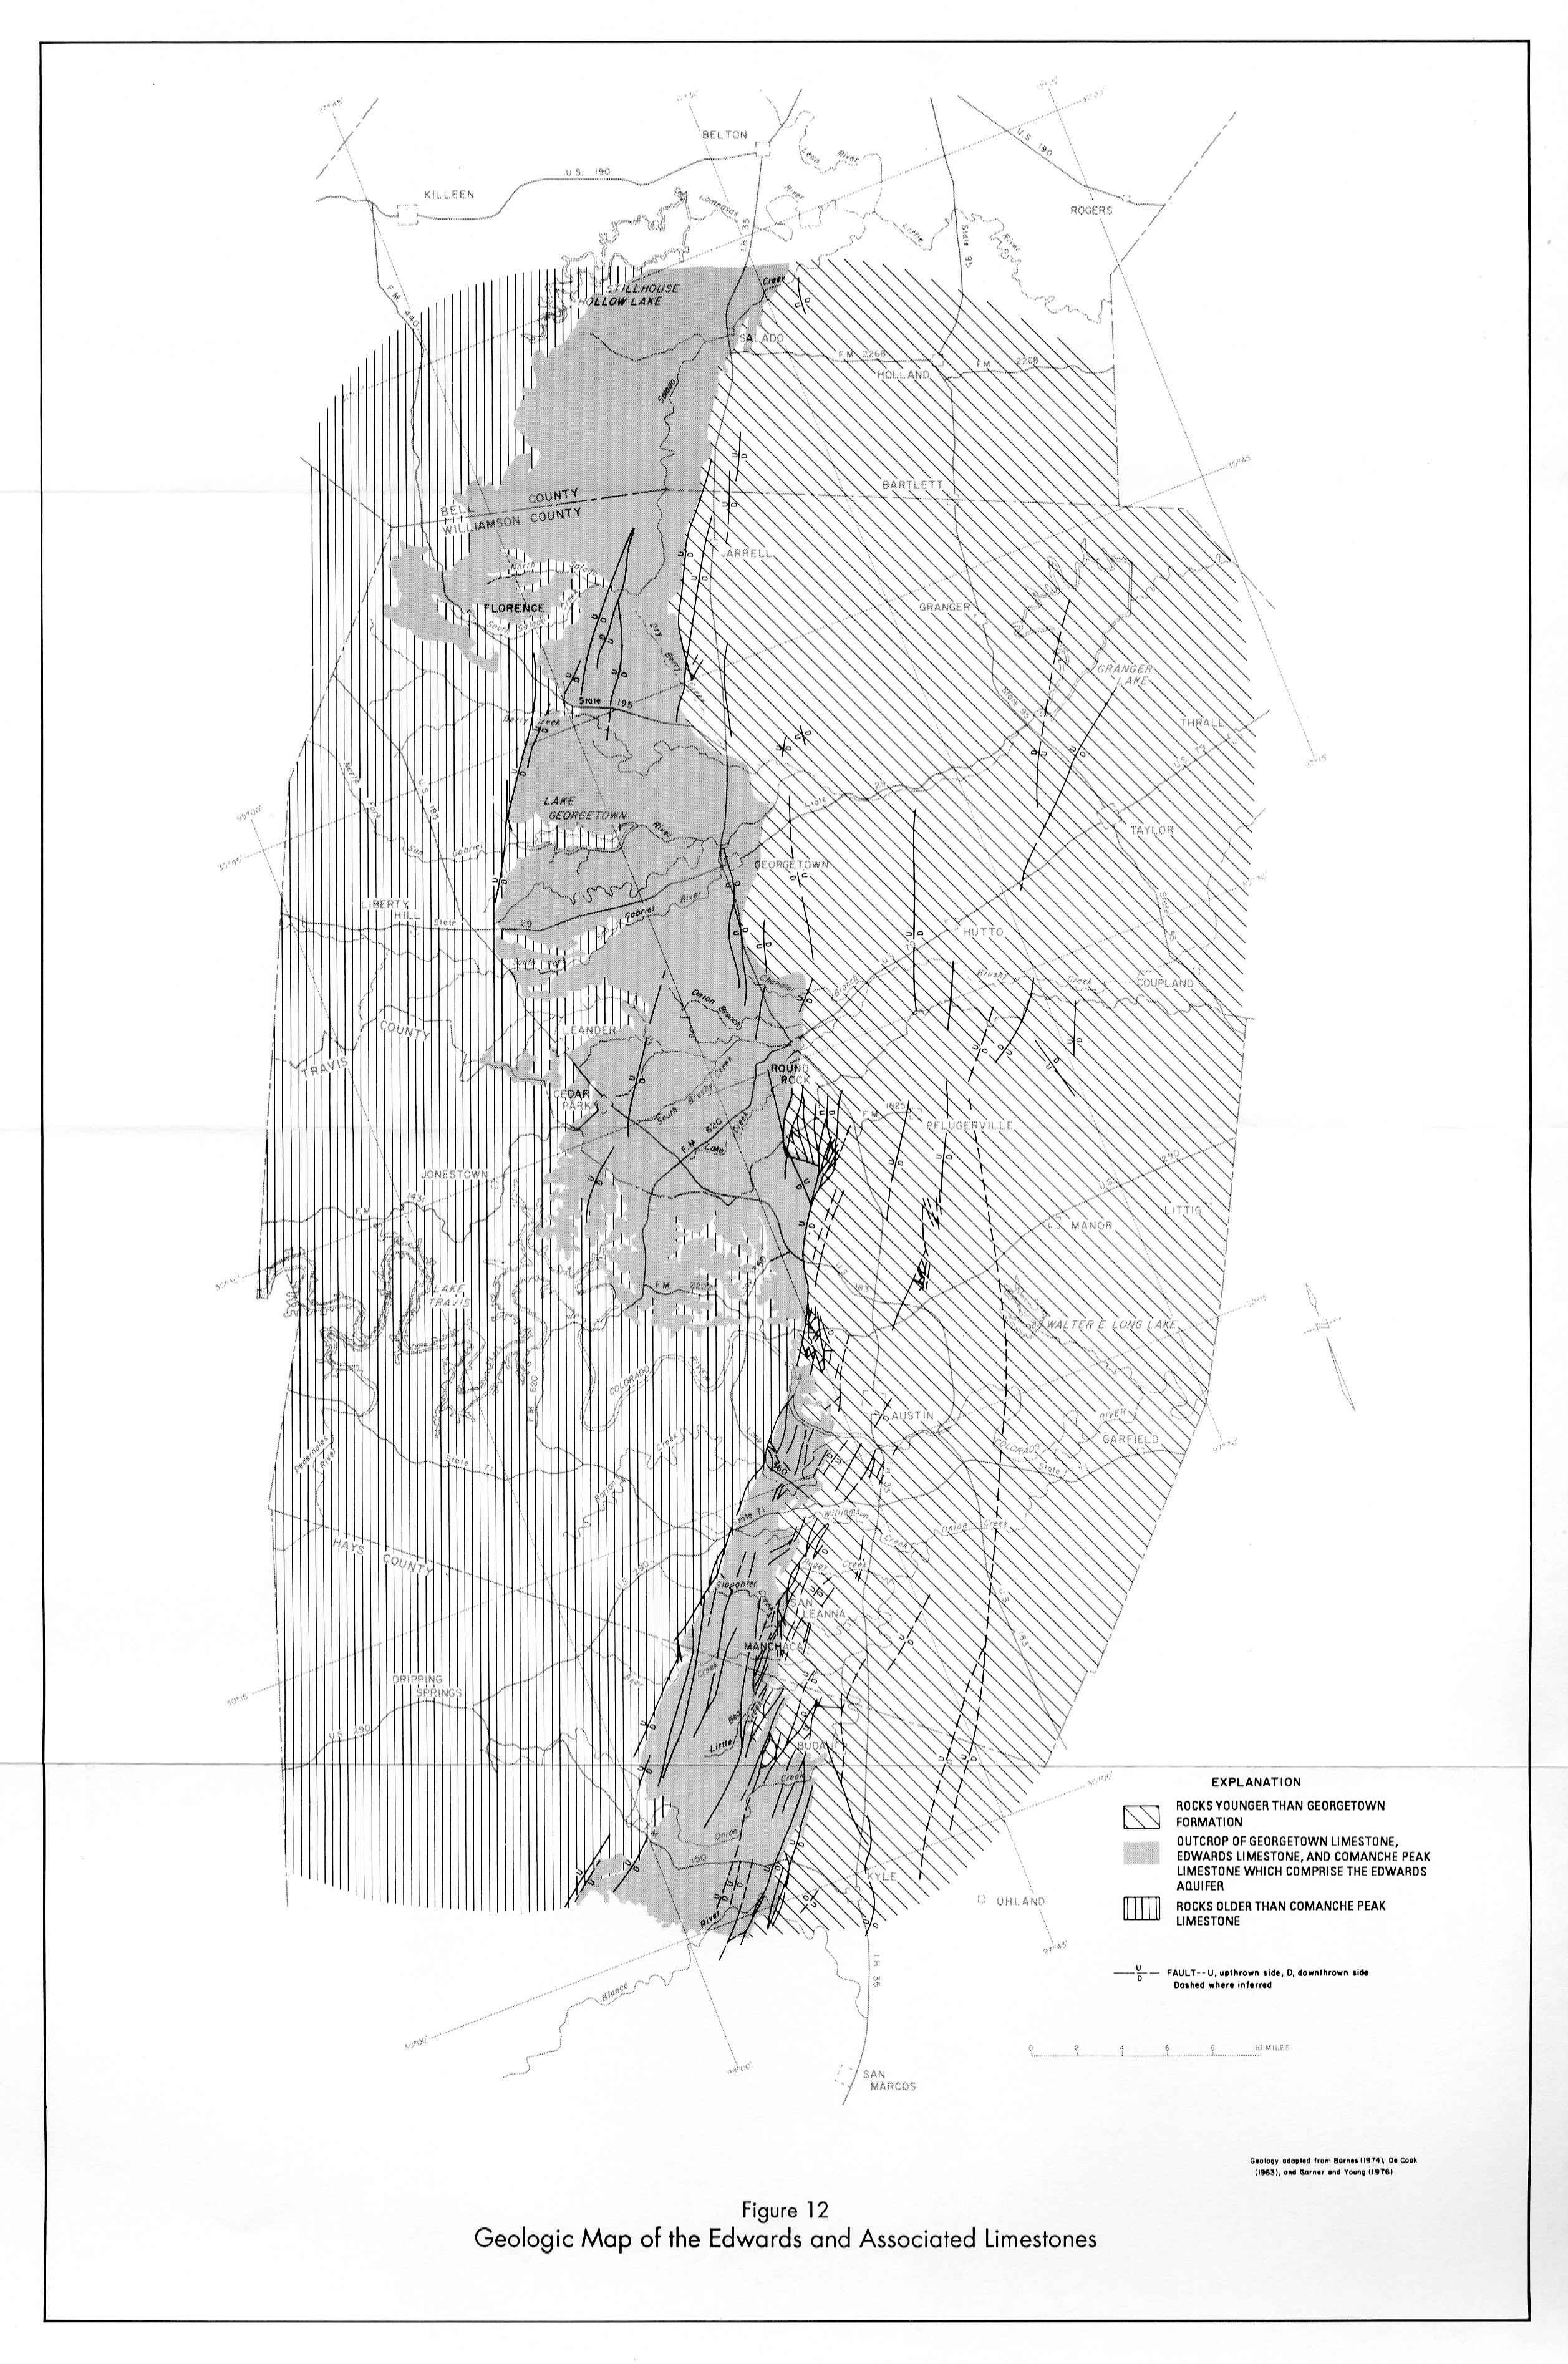
- Figure 12 - Geologic Map of the Edwards and Associated Limestones
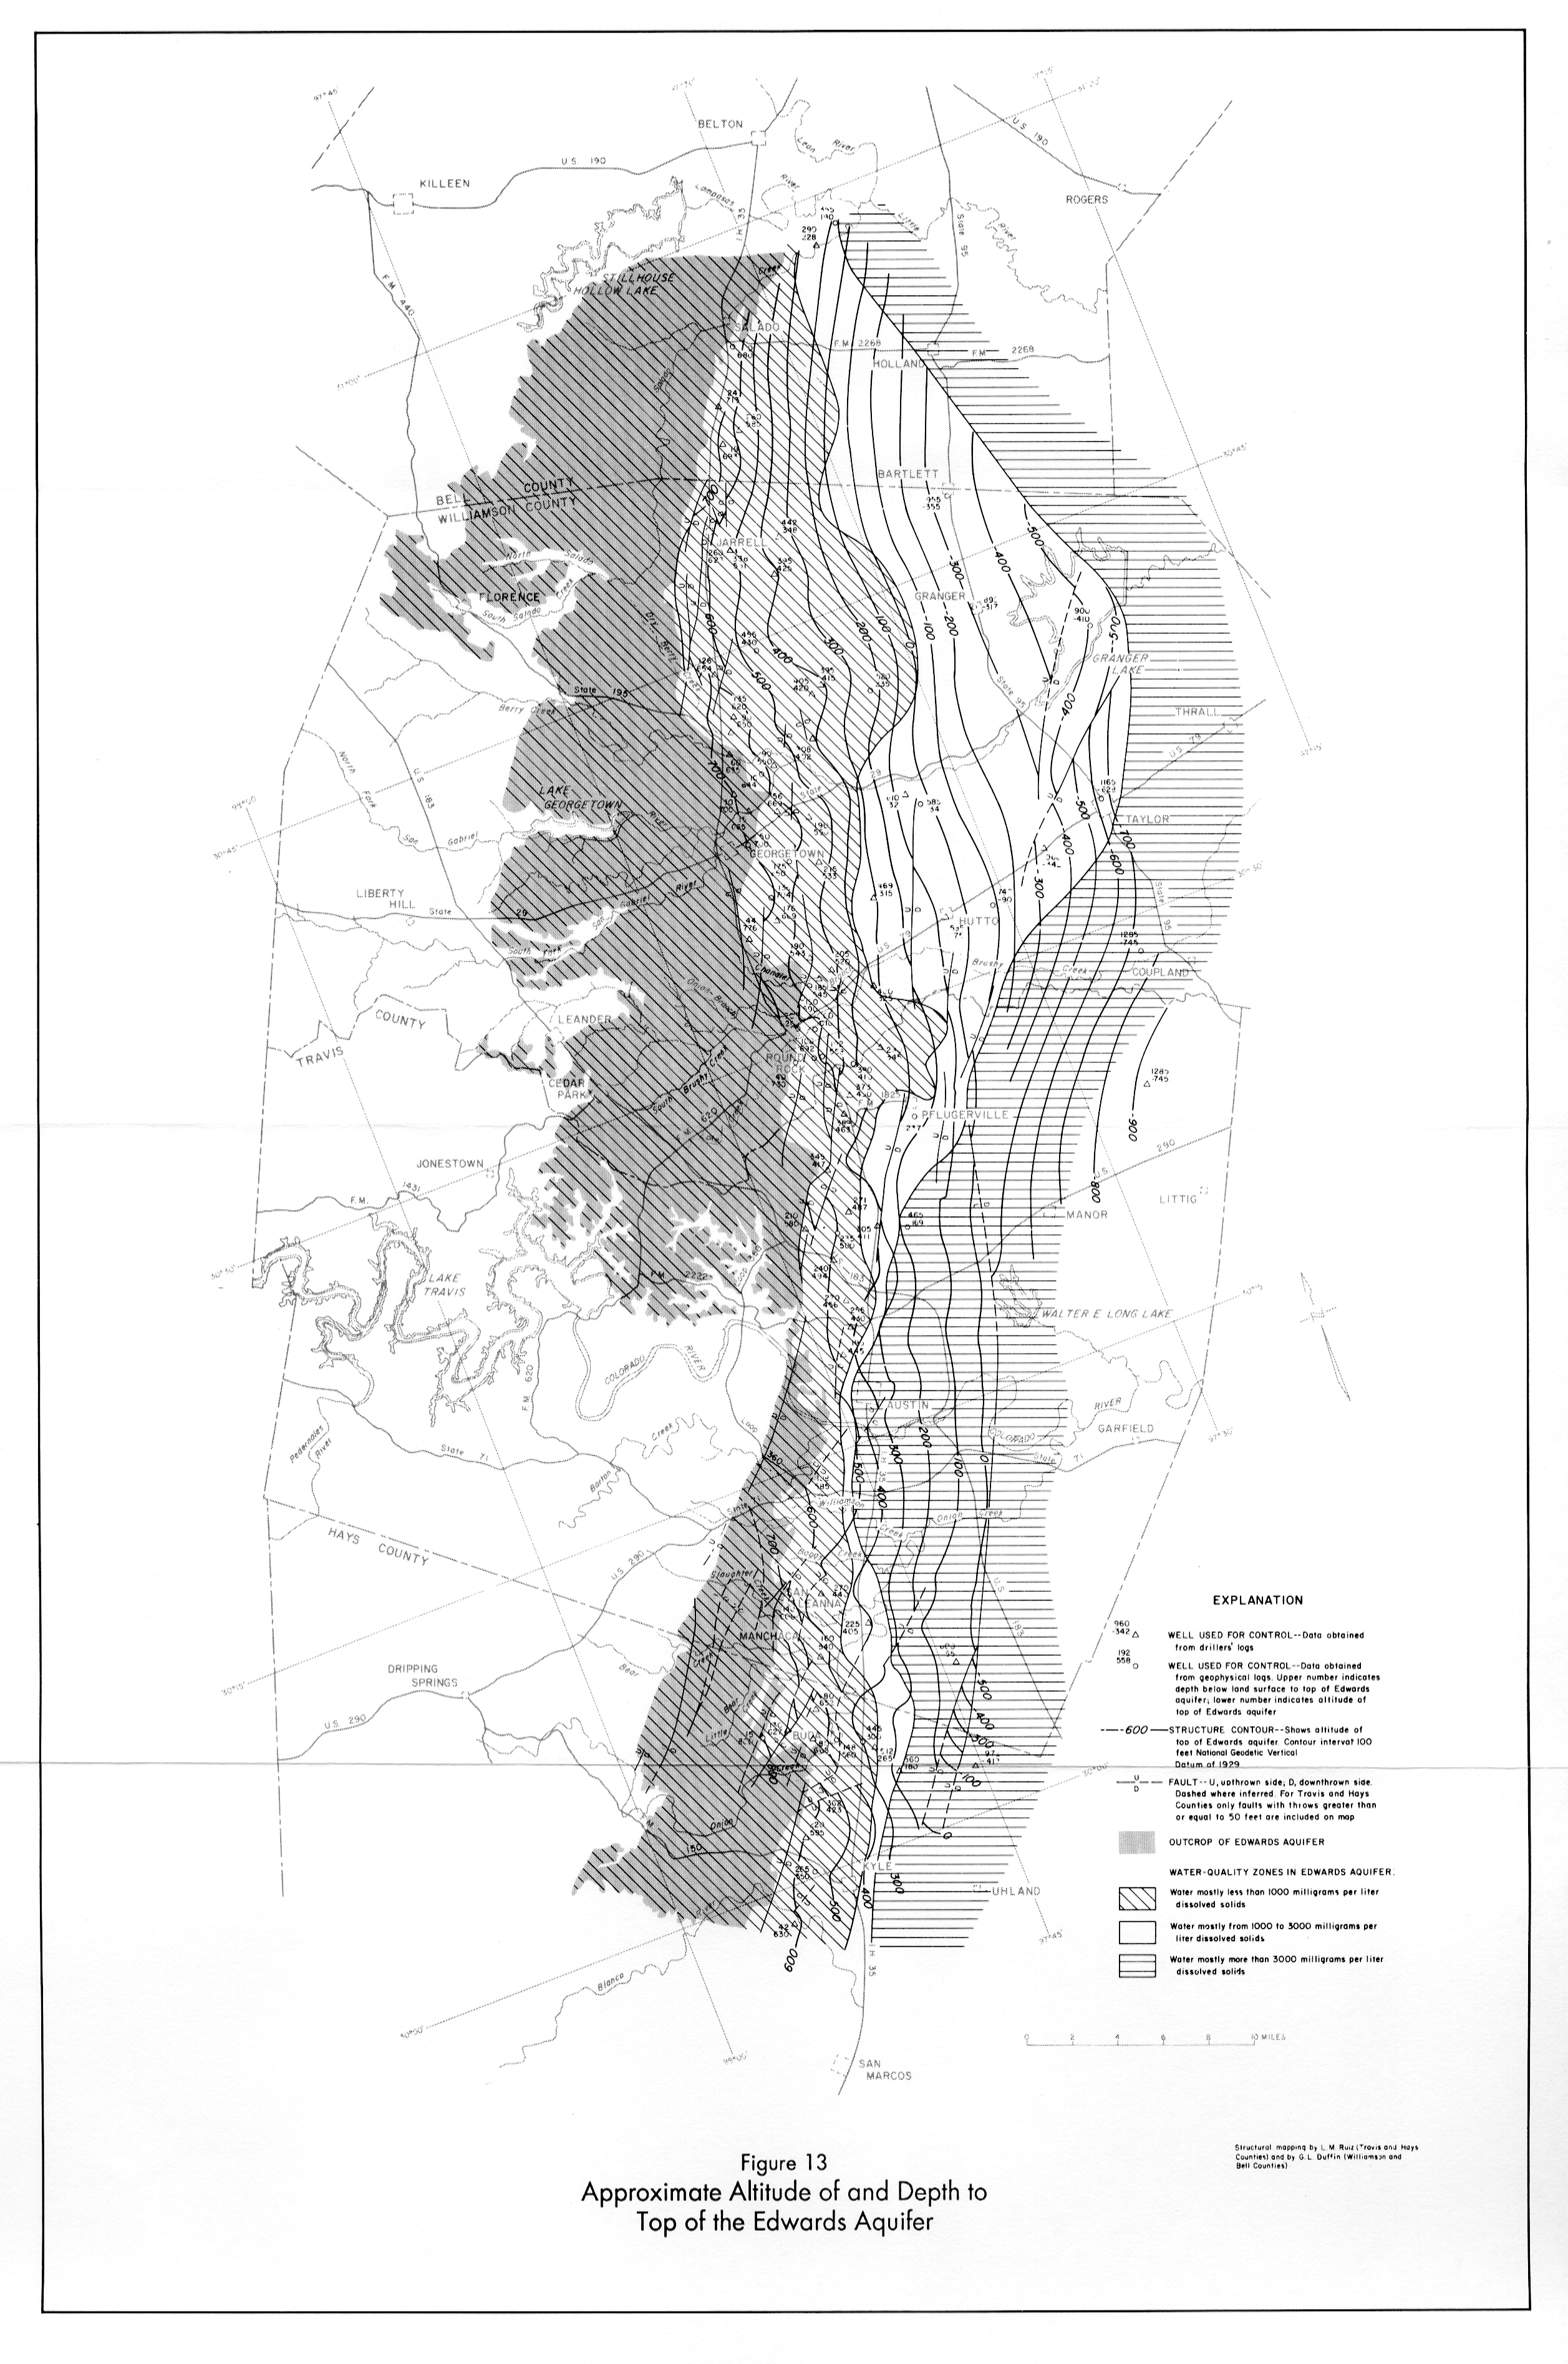
- Figure 13 - Approximate Altitude of and Depth to Top of the Edwards Aquifer
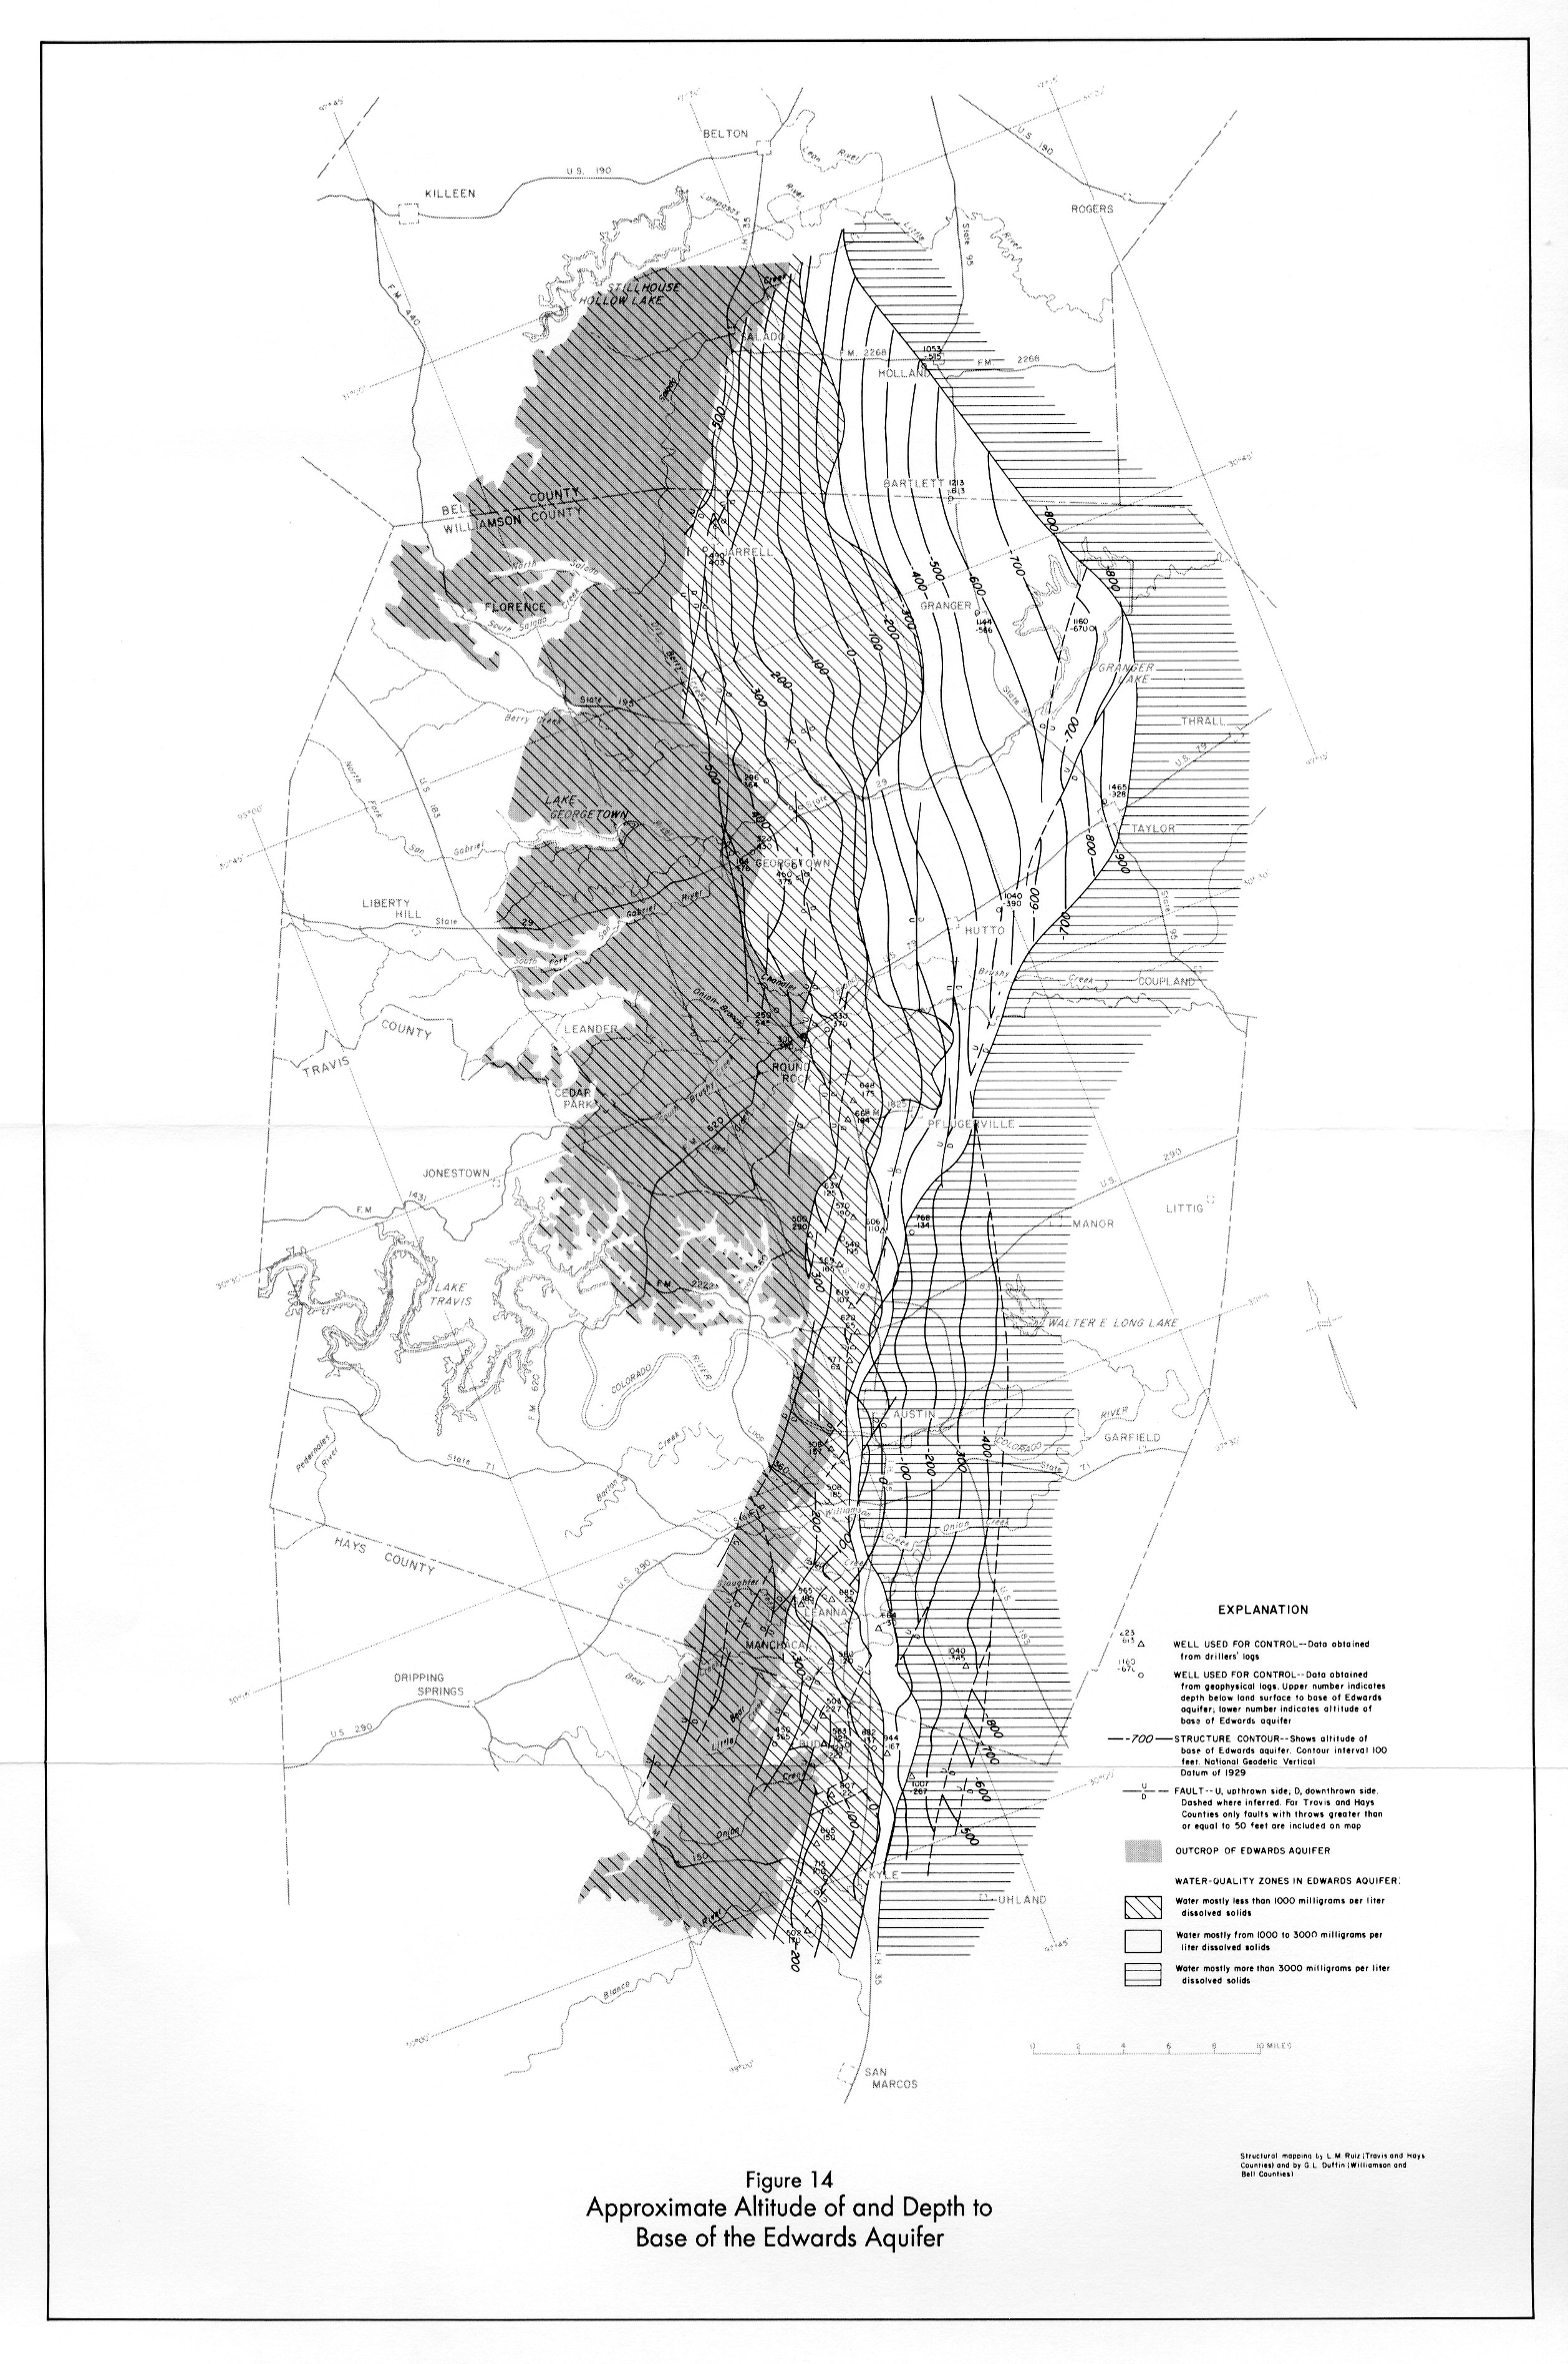
- Figure 14 - Approximate Altitude of and Depth to Base of the Edwards Aquifer
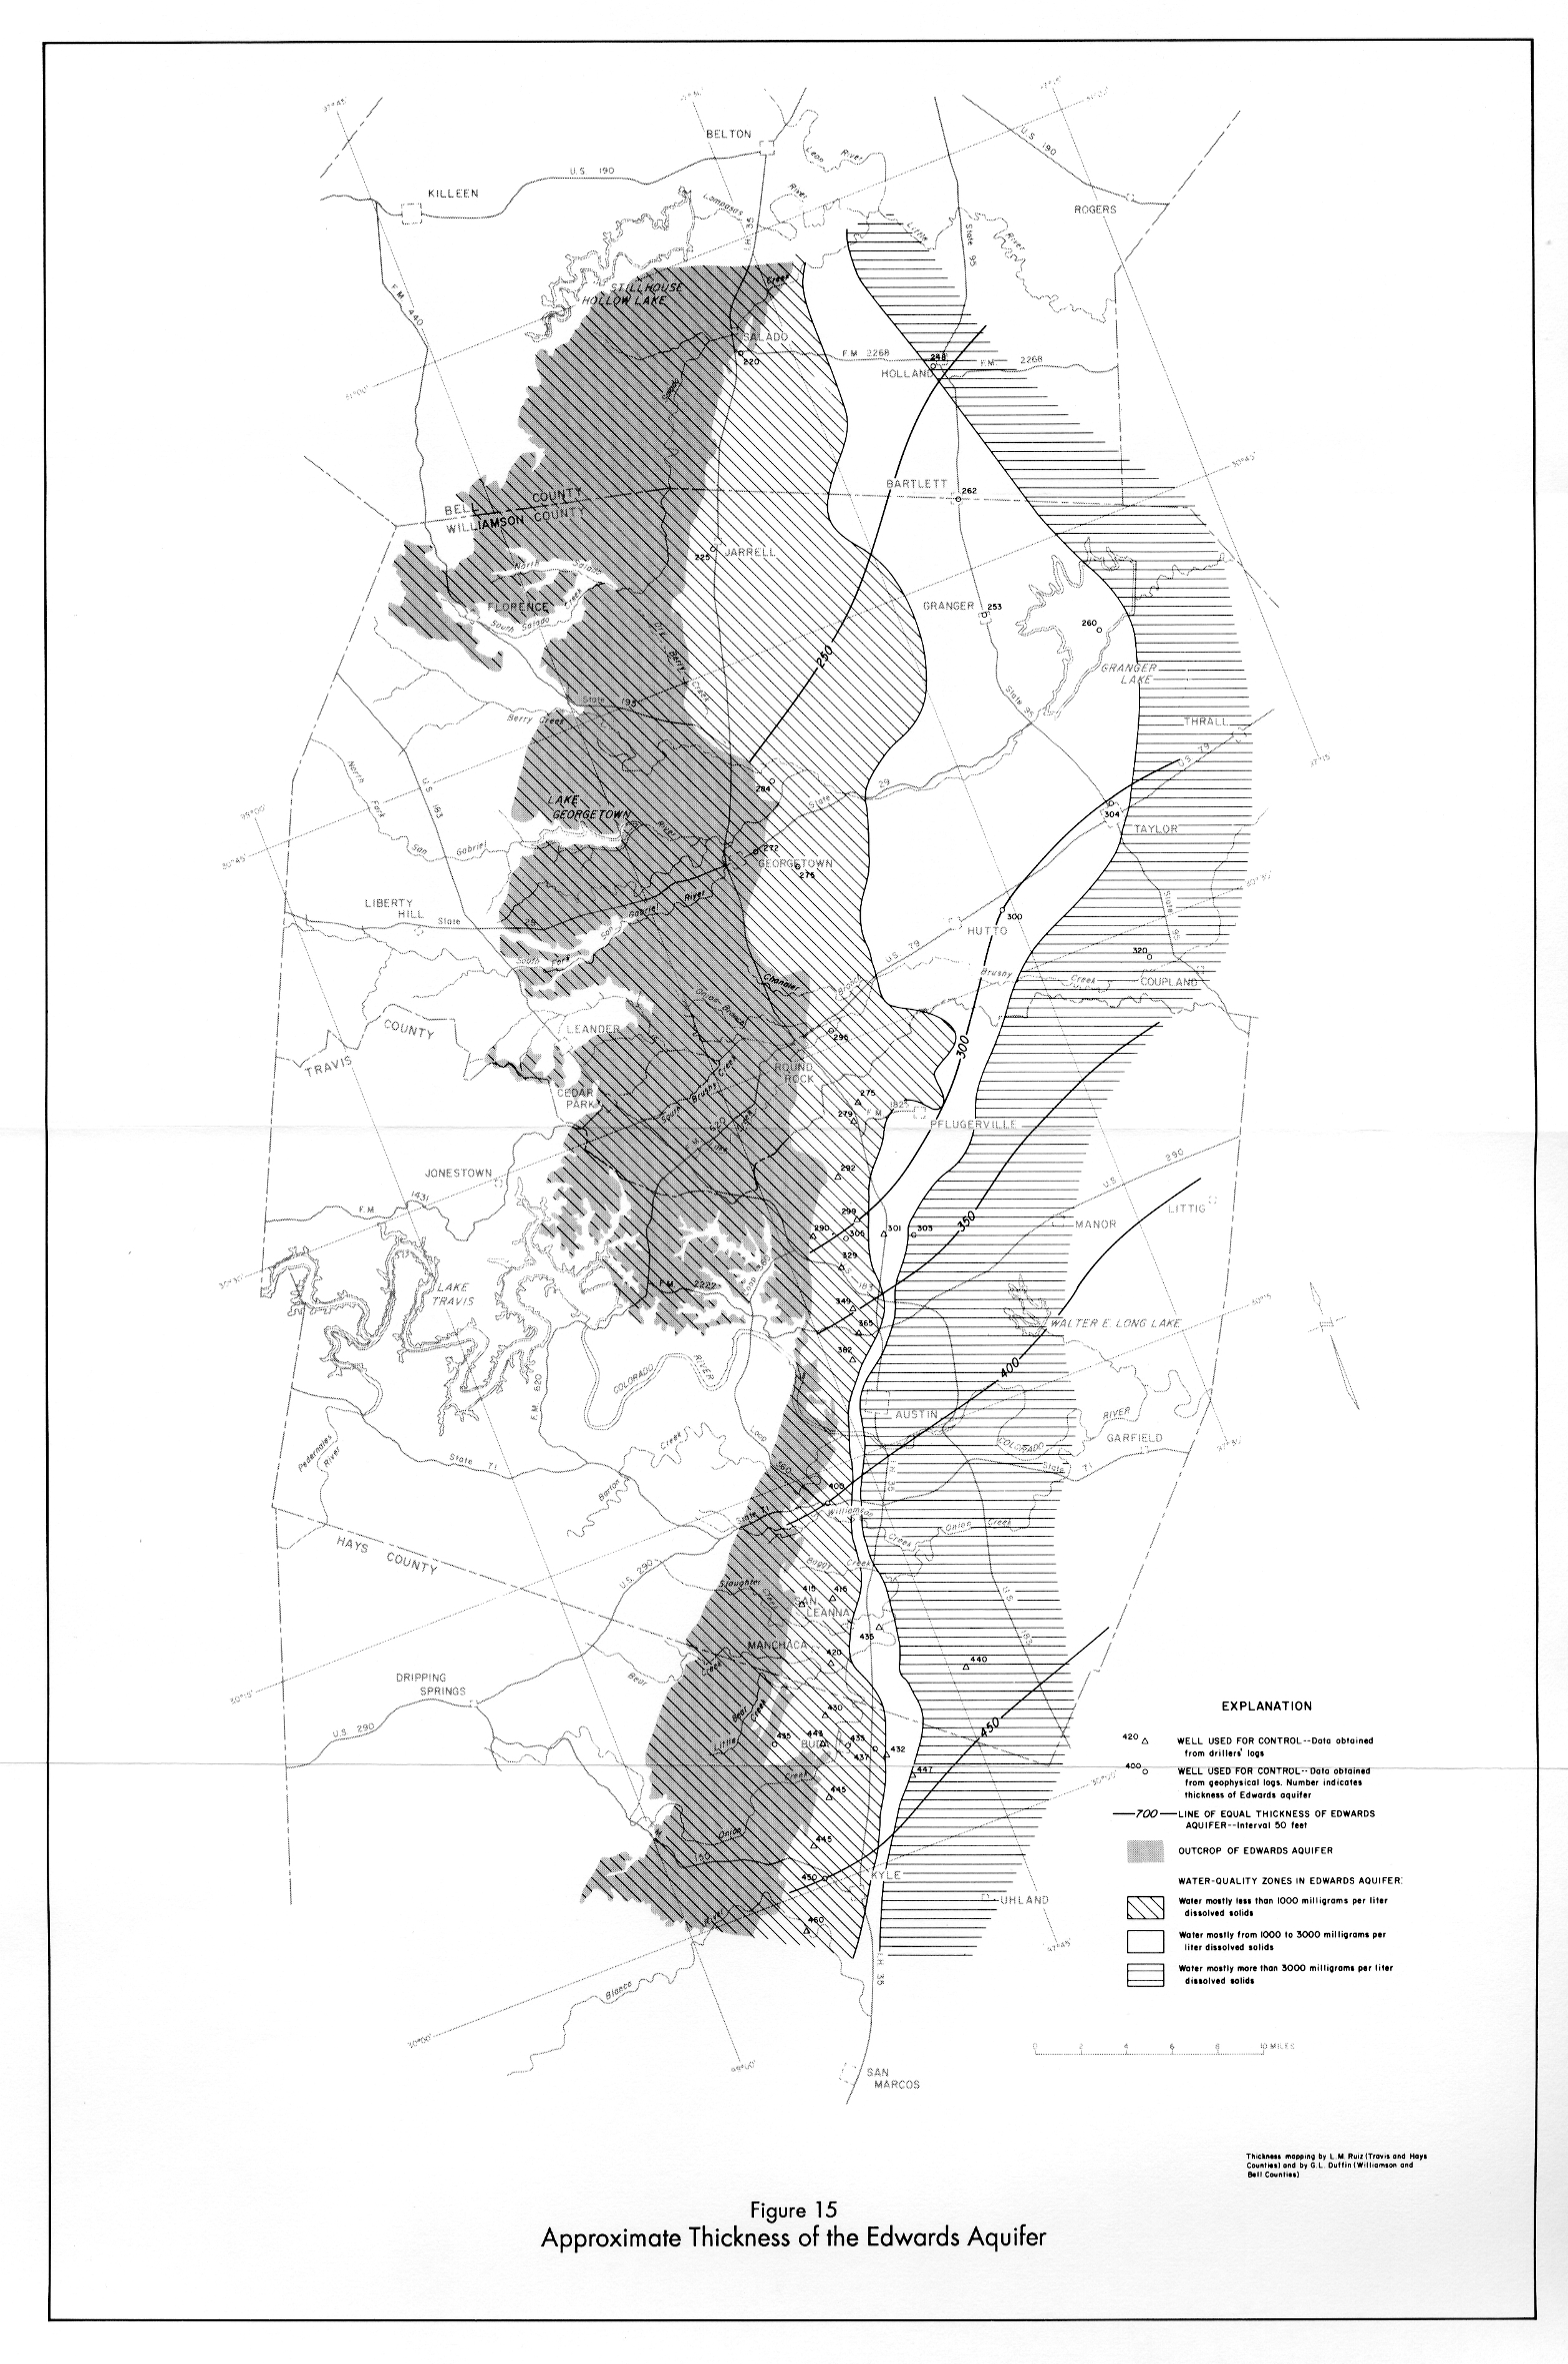
- Figure 15 - Approximate Thickness of the Edwards Aquifer
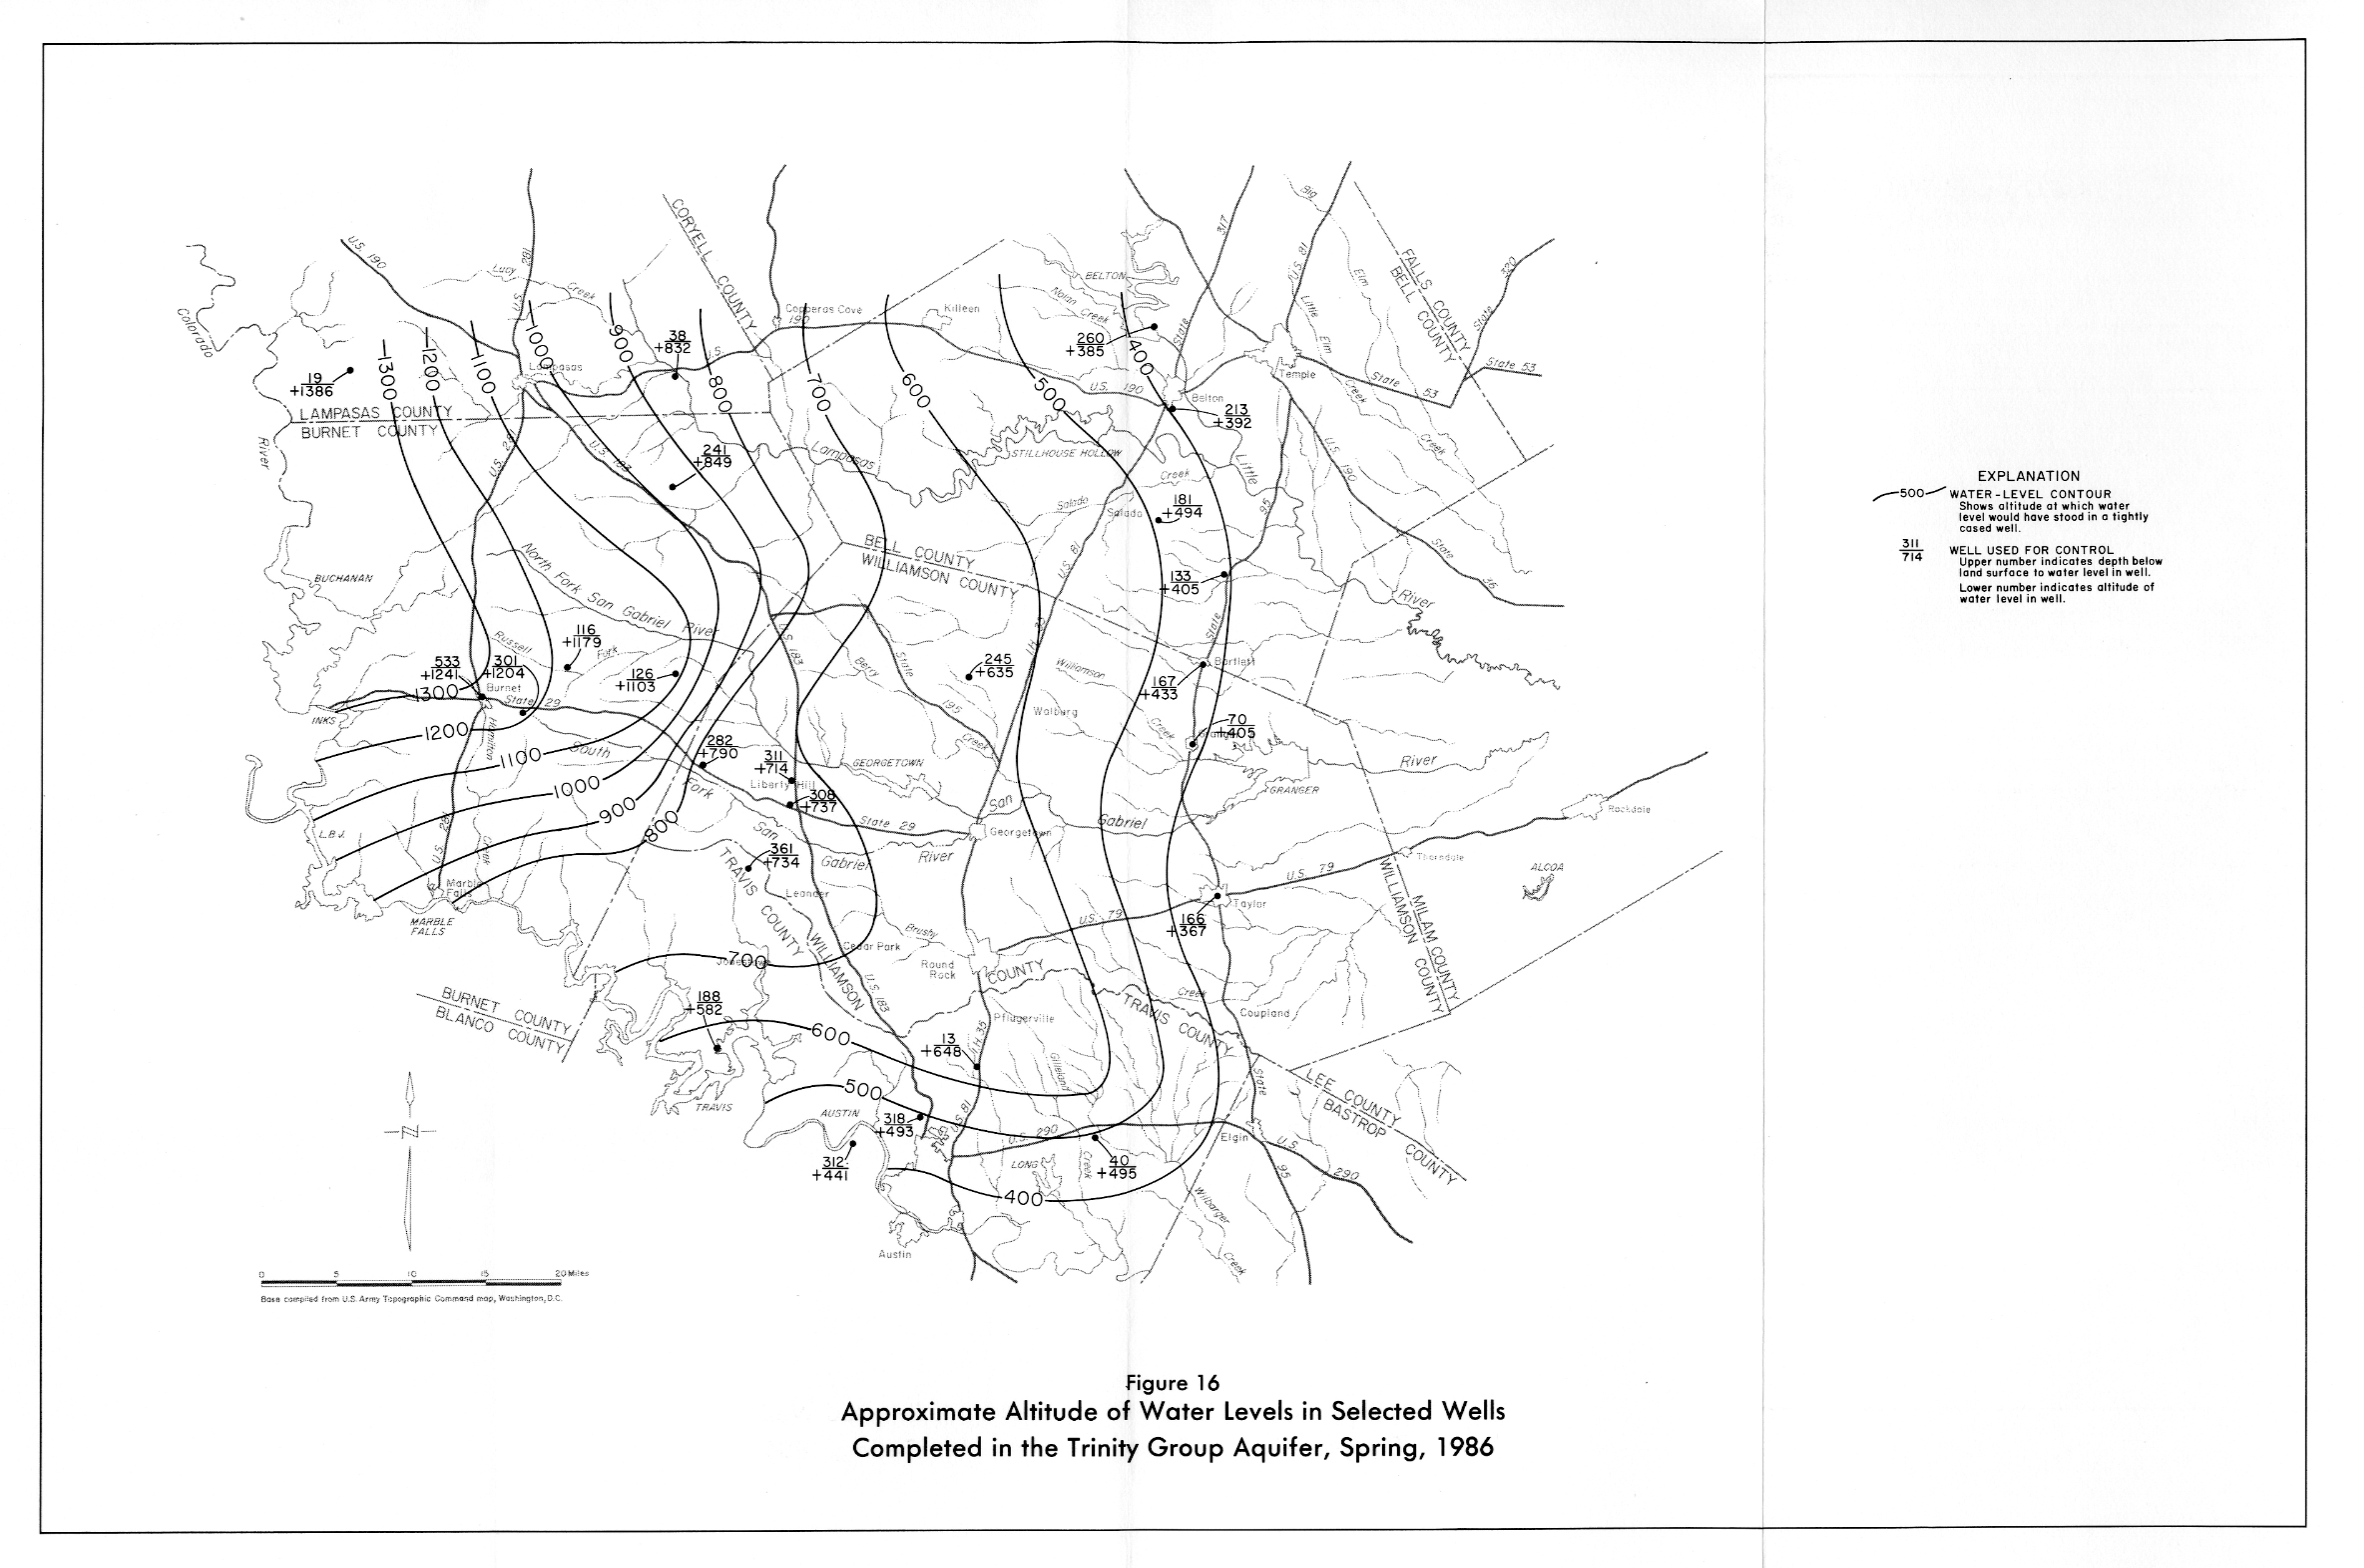
- Figure 16 - Approximate Altitude of Water Levels in Selected Wells Completed in the Trinity Group Aquifer, Spring, 1986
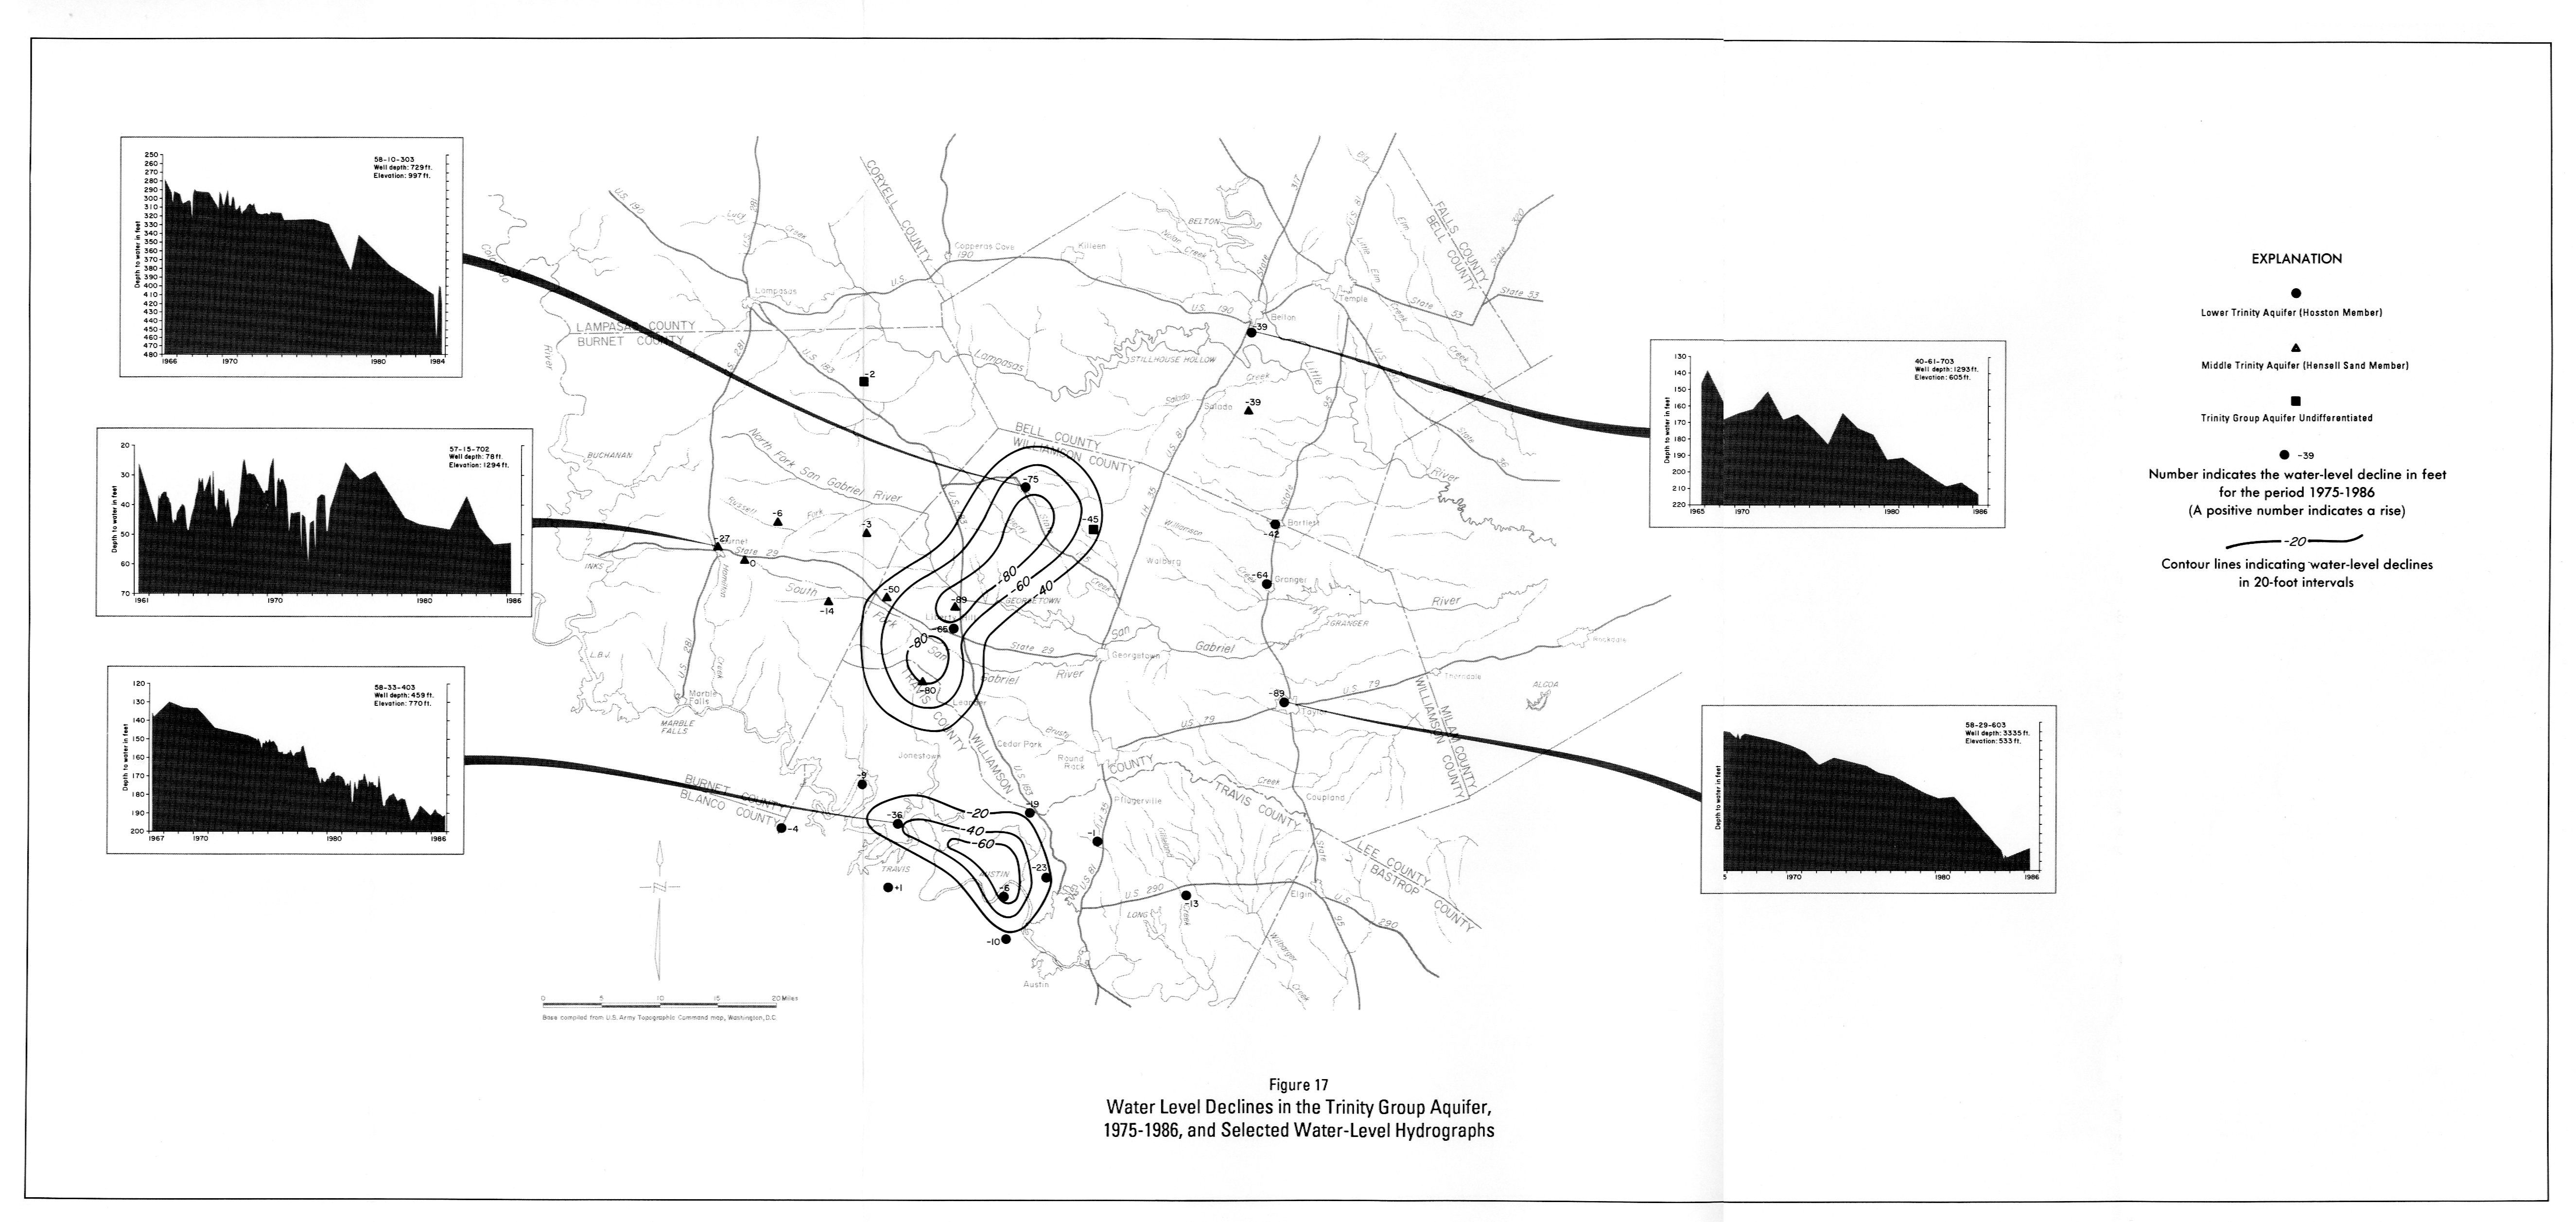
- Figure 17 - Water Level Declines in the Trinity Group Aquifer, 1975-1986, and Selected Water-Level Hydrographs
- Figure 18 - Sulfate, Chloride, and Dissolved-Solids Content in Water From Selected Wells in the Lower, Middle, and Upper Trinity Aquifers
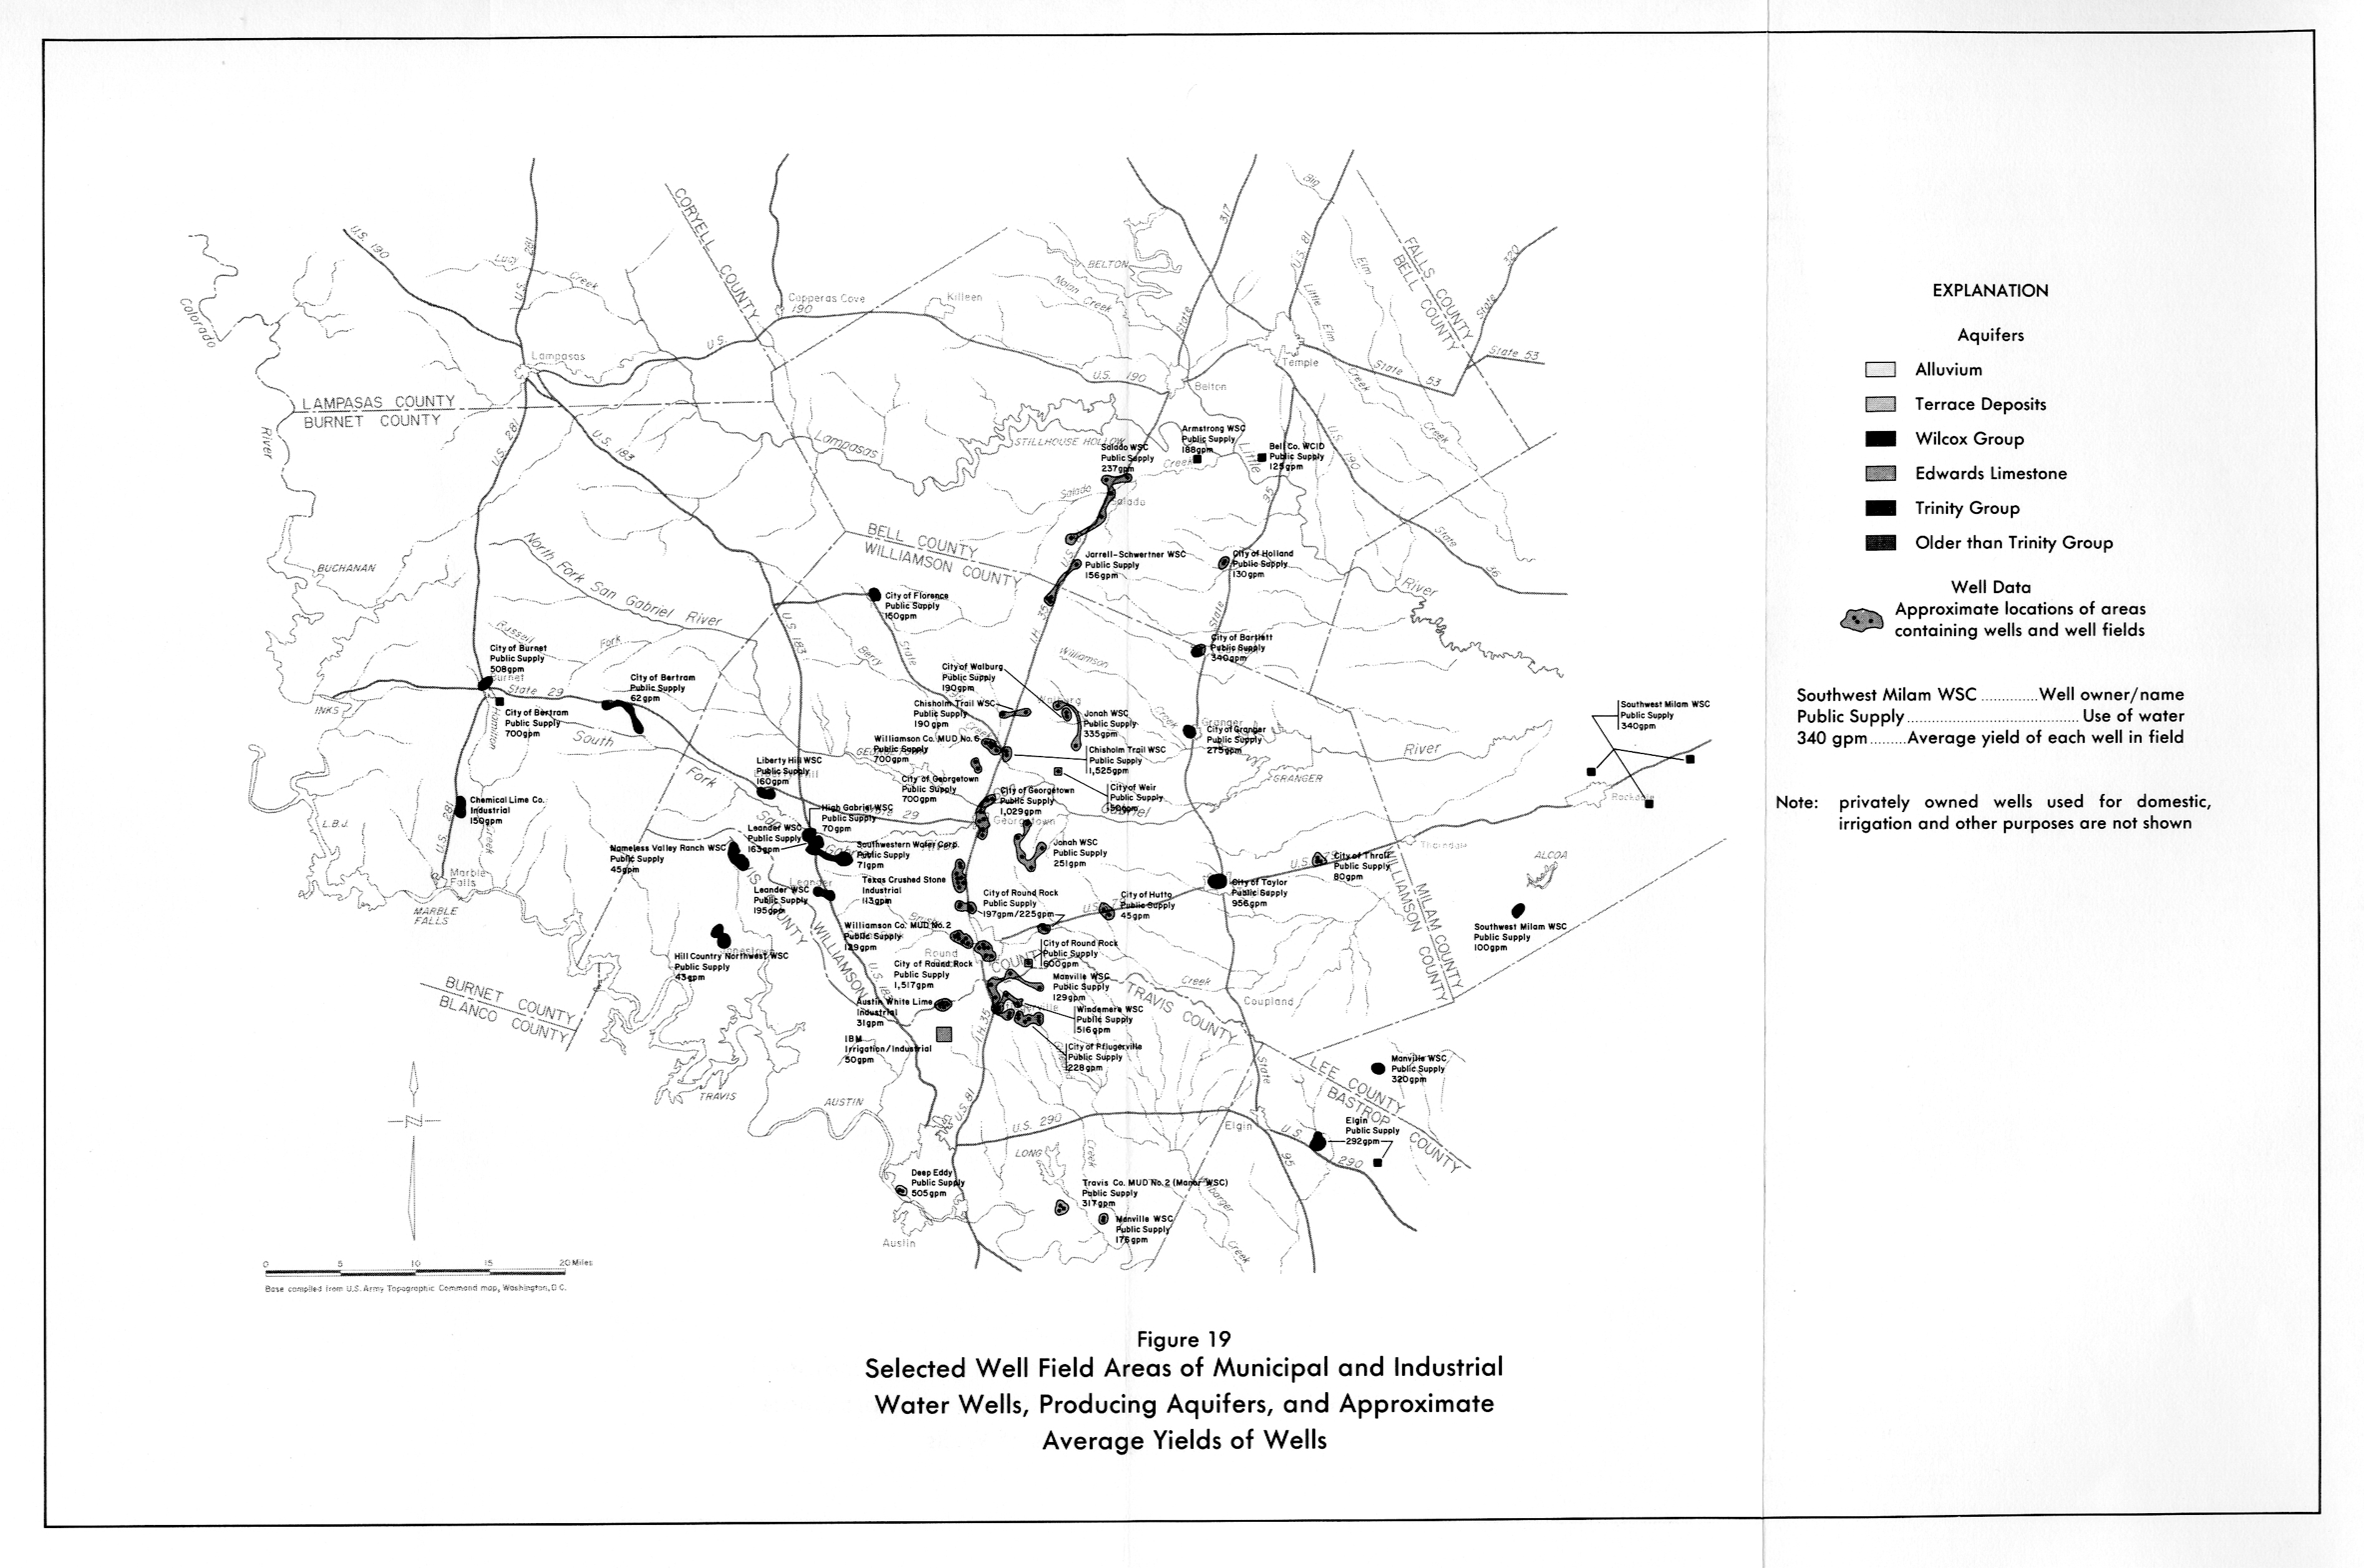
- Figure 19 - Selected Well Field Areas of Municipal and Industrial Water Wells, Producing Aquifers, and Approximate Average Yields of Wells
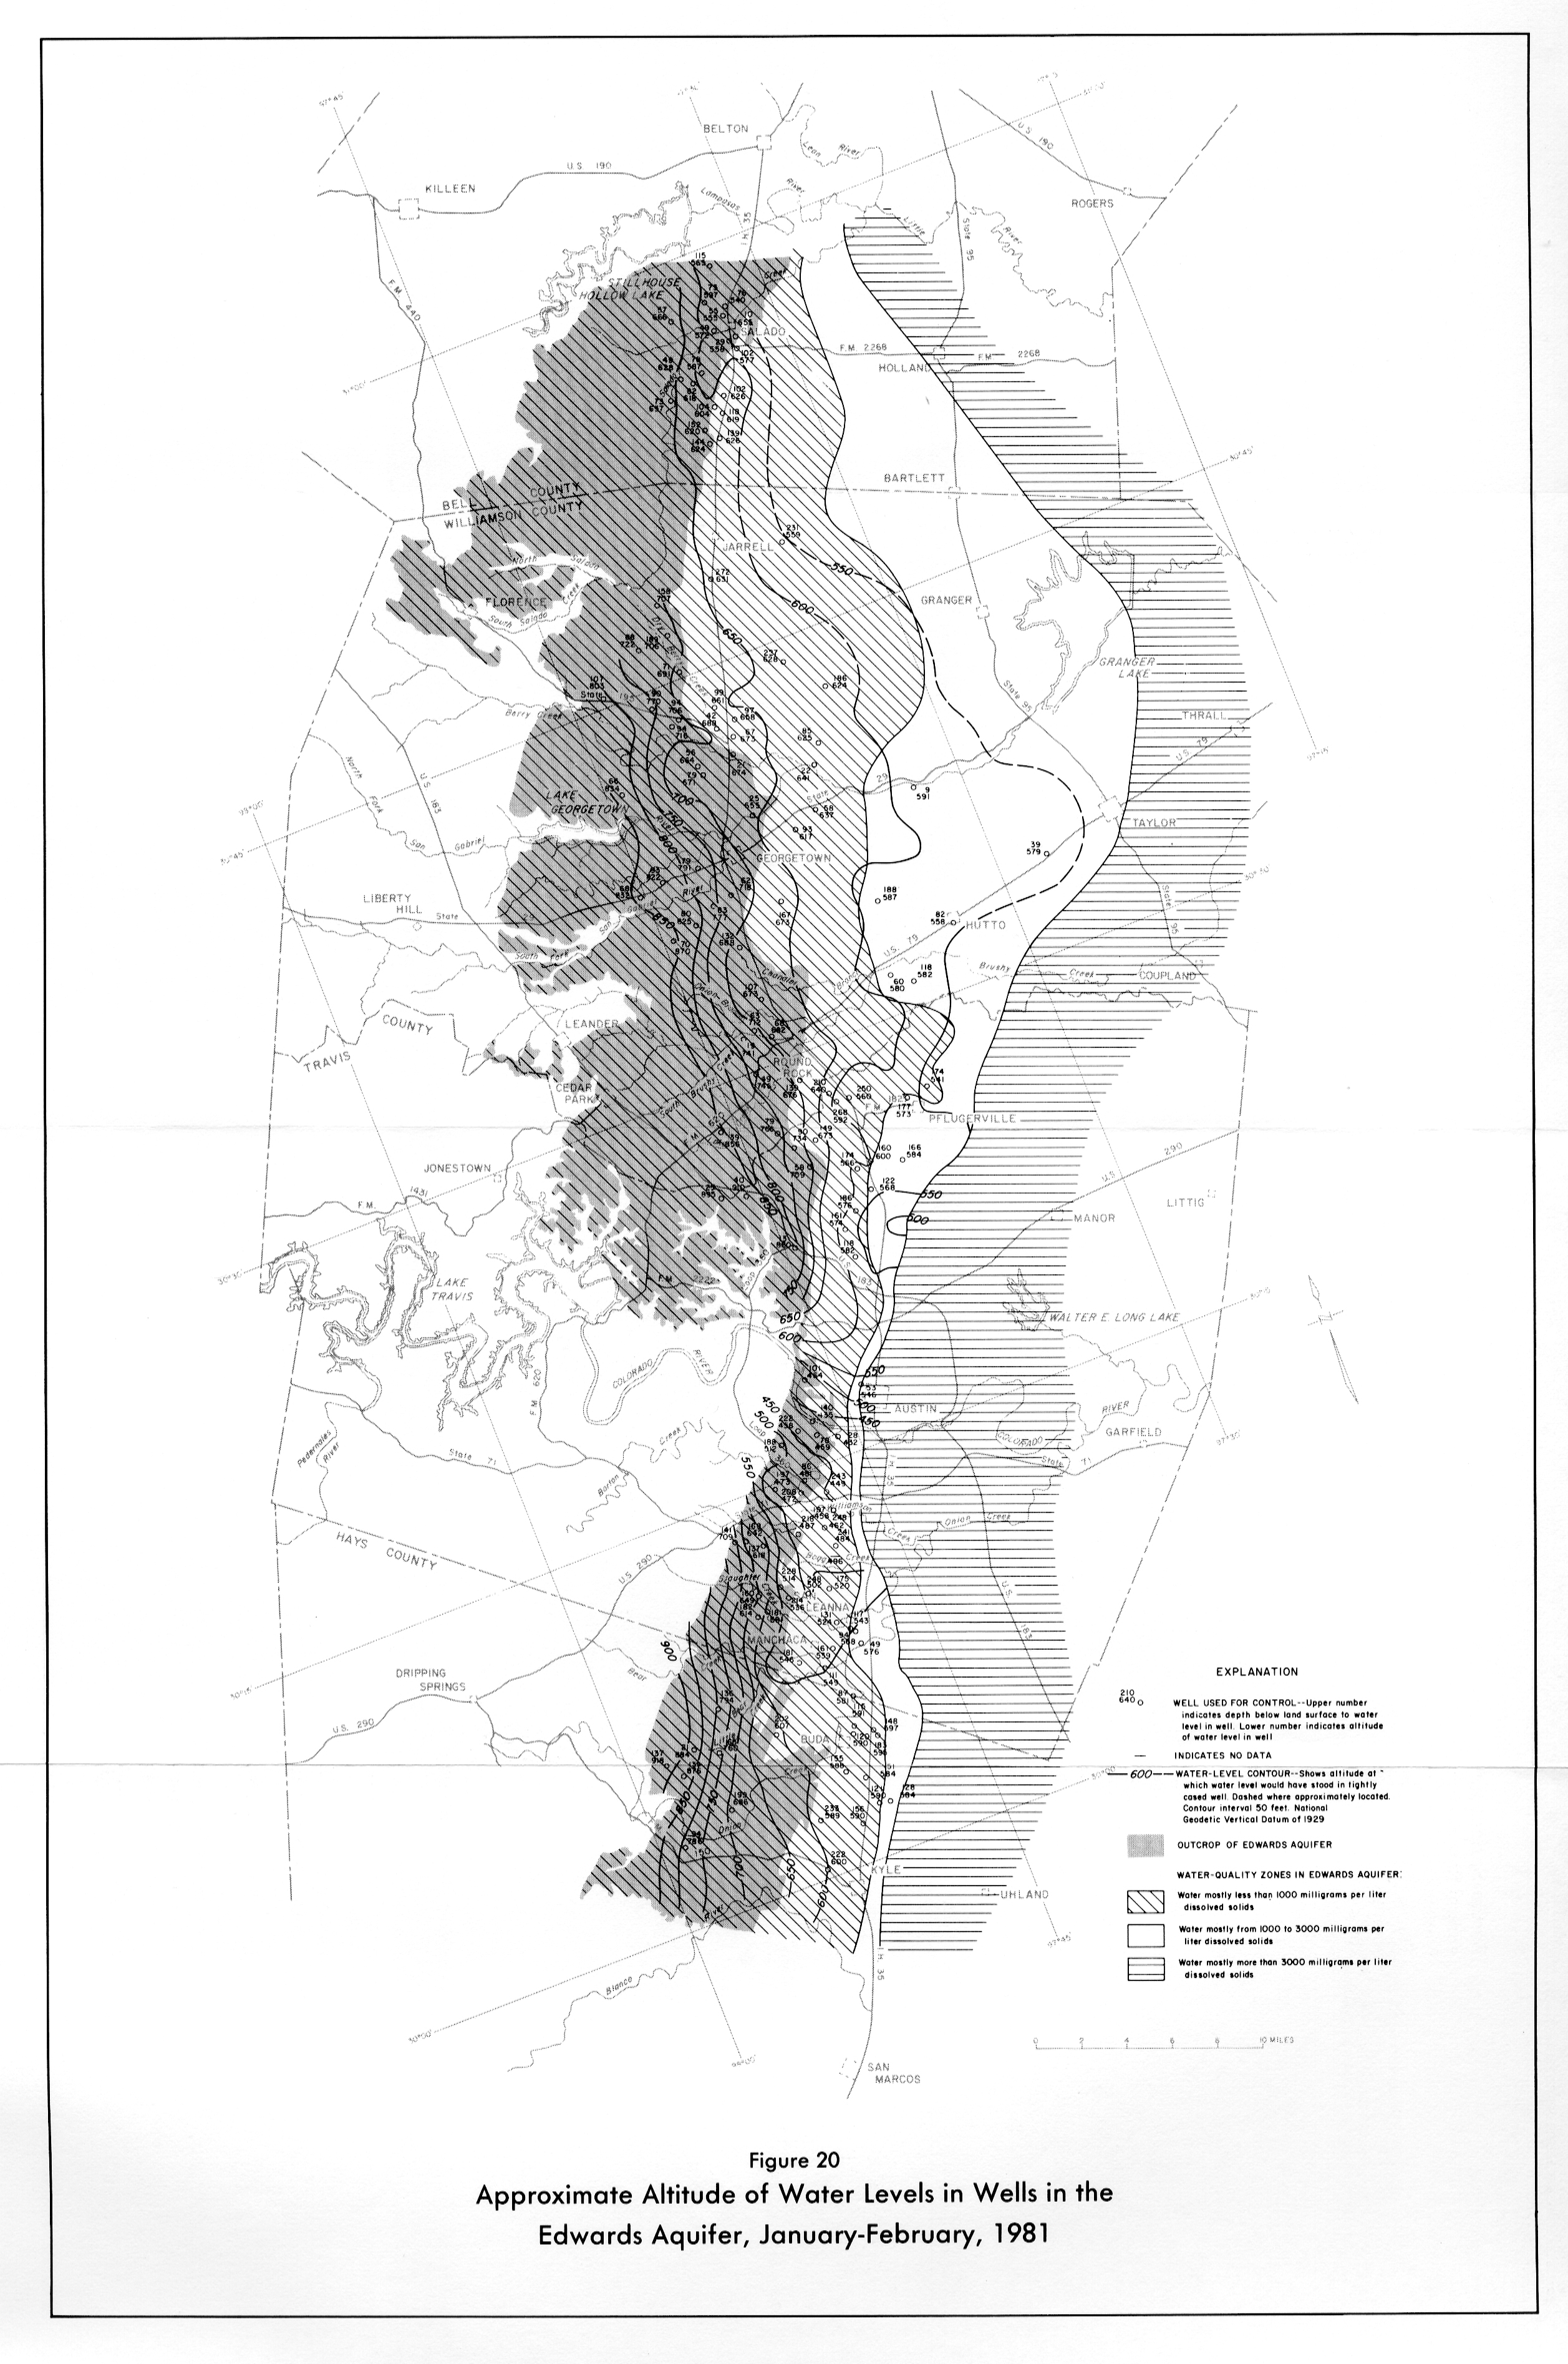
- Figure 20 - Approximate Altitude of Water Levels in Wells in the Edwards Aquifer, January-February, 1981
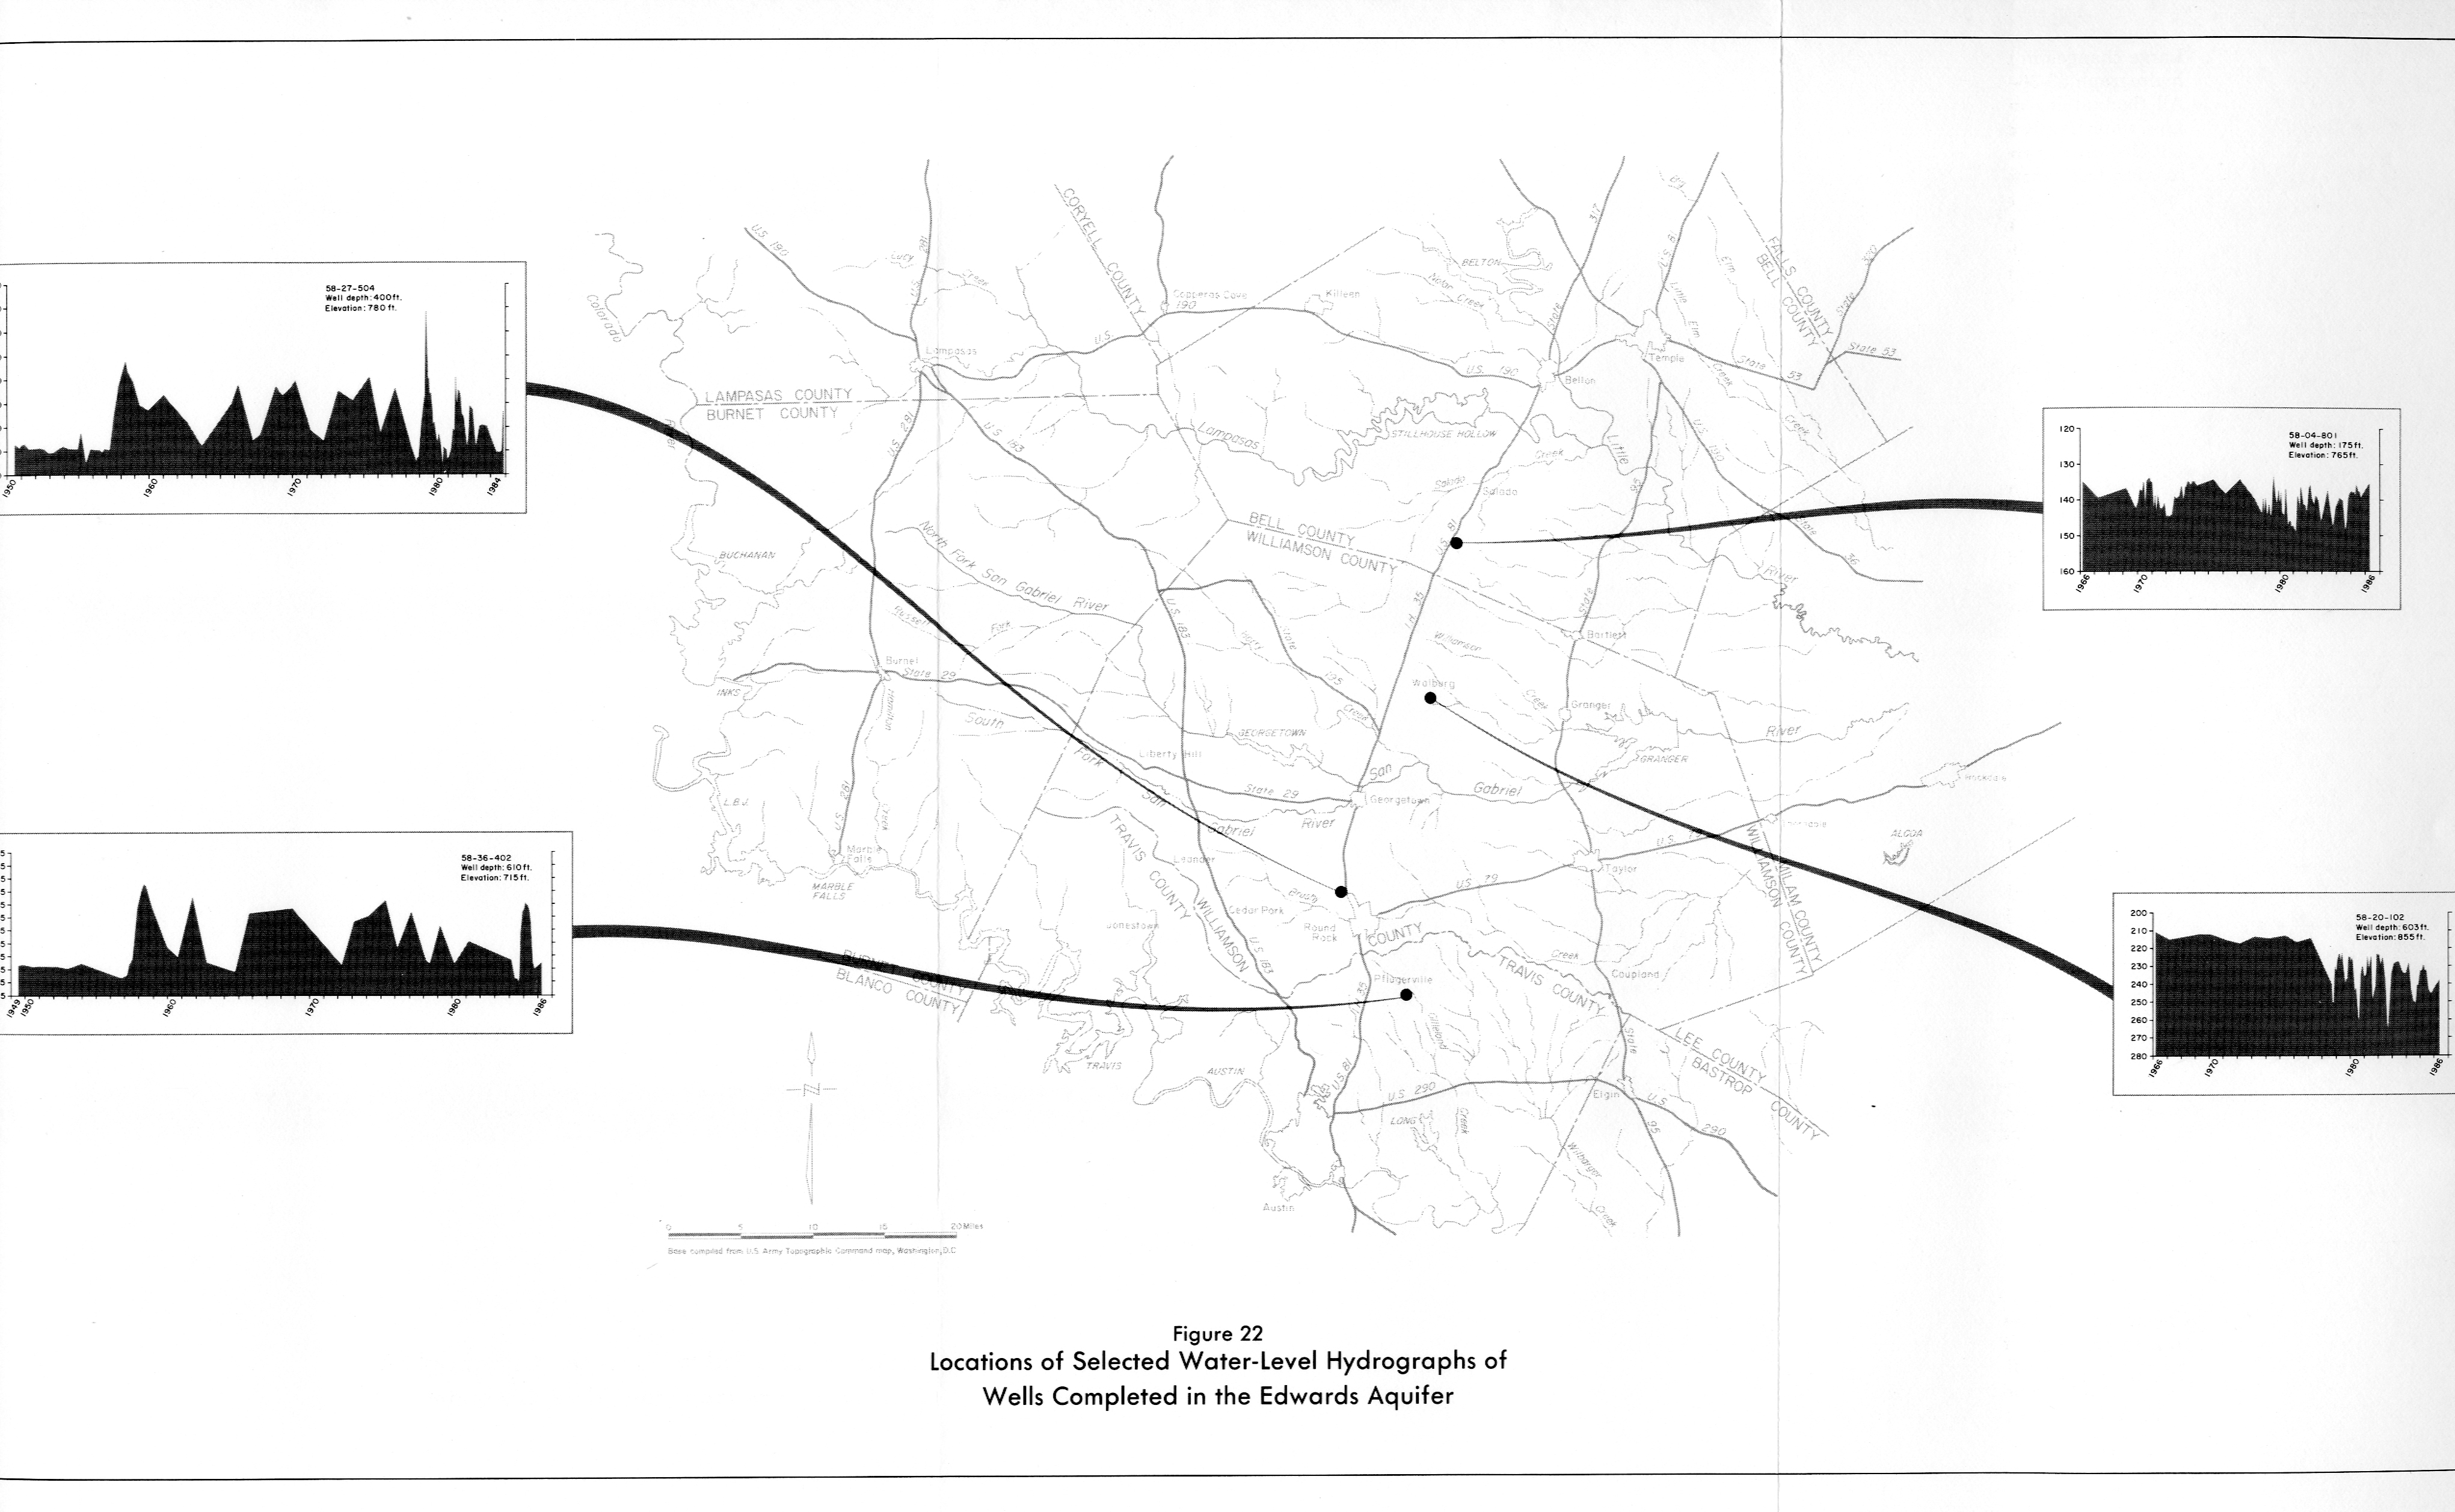
- Figure 22 - Locations of Selected Water-Level Hydrographs of Wells Completed in the Edwards Aquifer
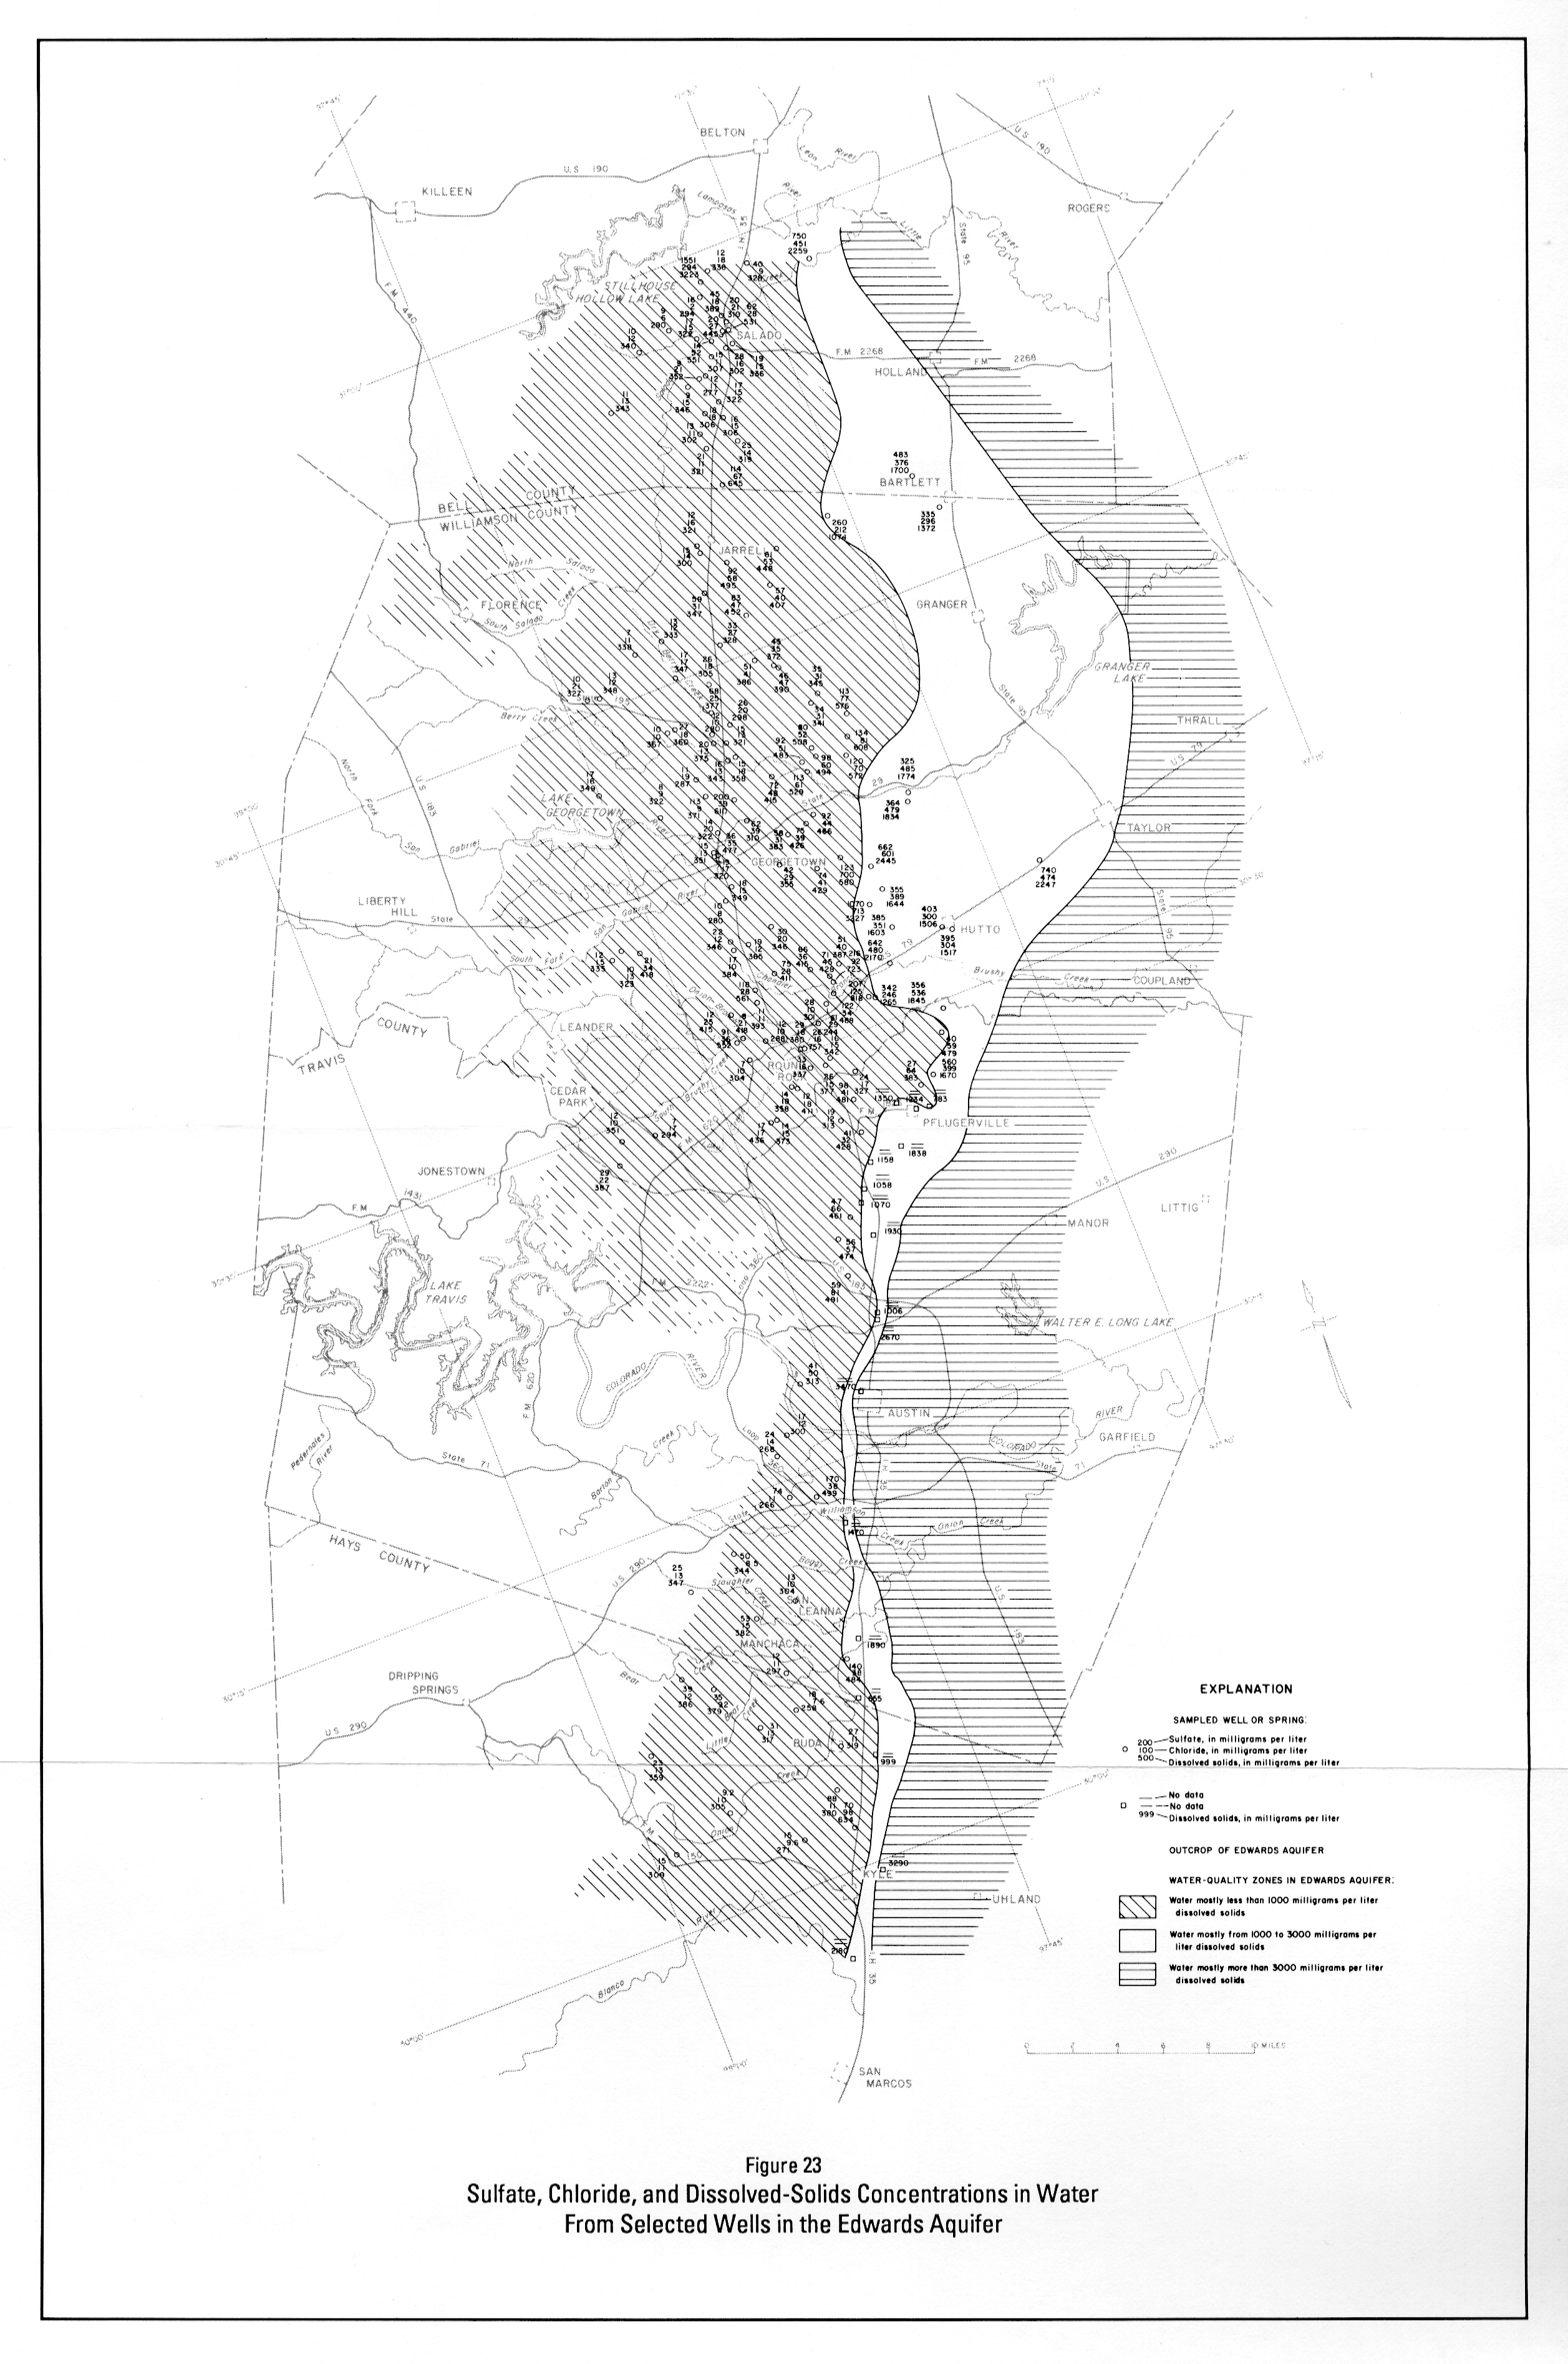
- Figure 23 - Sulfate, Chloride, and Dissolved-Solids Concentrations in Water From Selected Wells in the Edwards Aquifer
- Figure 24 - Surface-Water Reservoirs in the Study Area