Report 308 By Phillip L. Nordstrom | August 1988
- Report 308 - Occurrence and Quality of Ground Water in Jack County, Texas
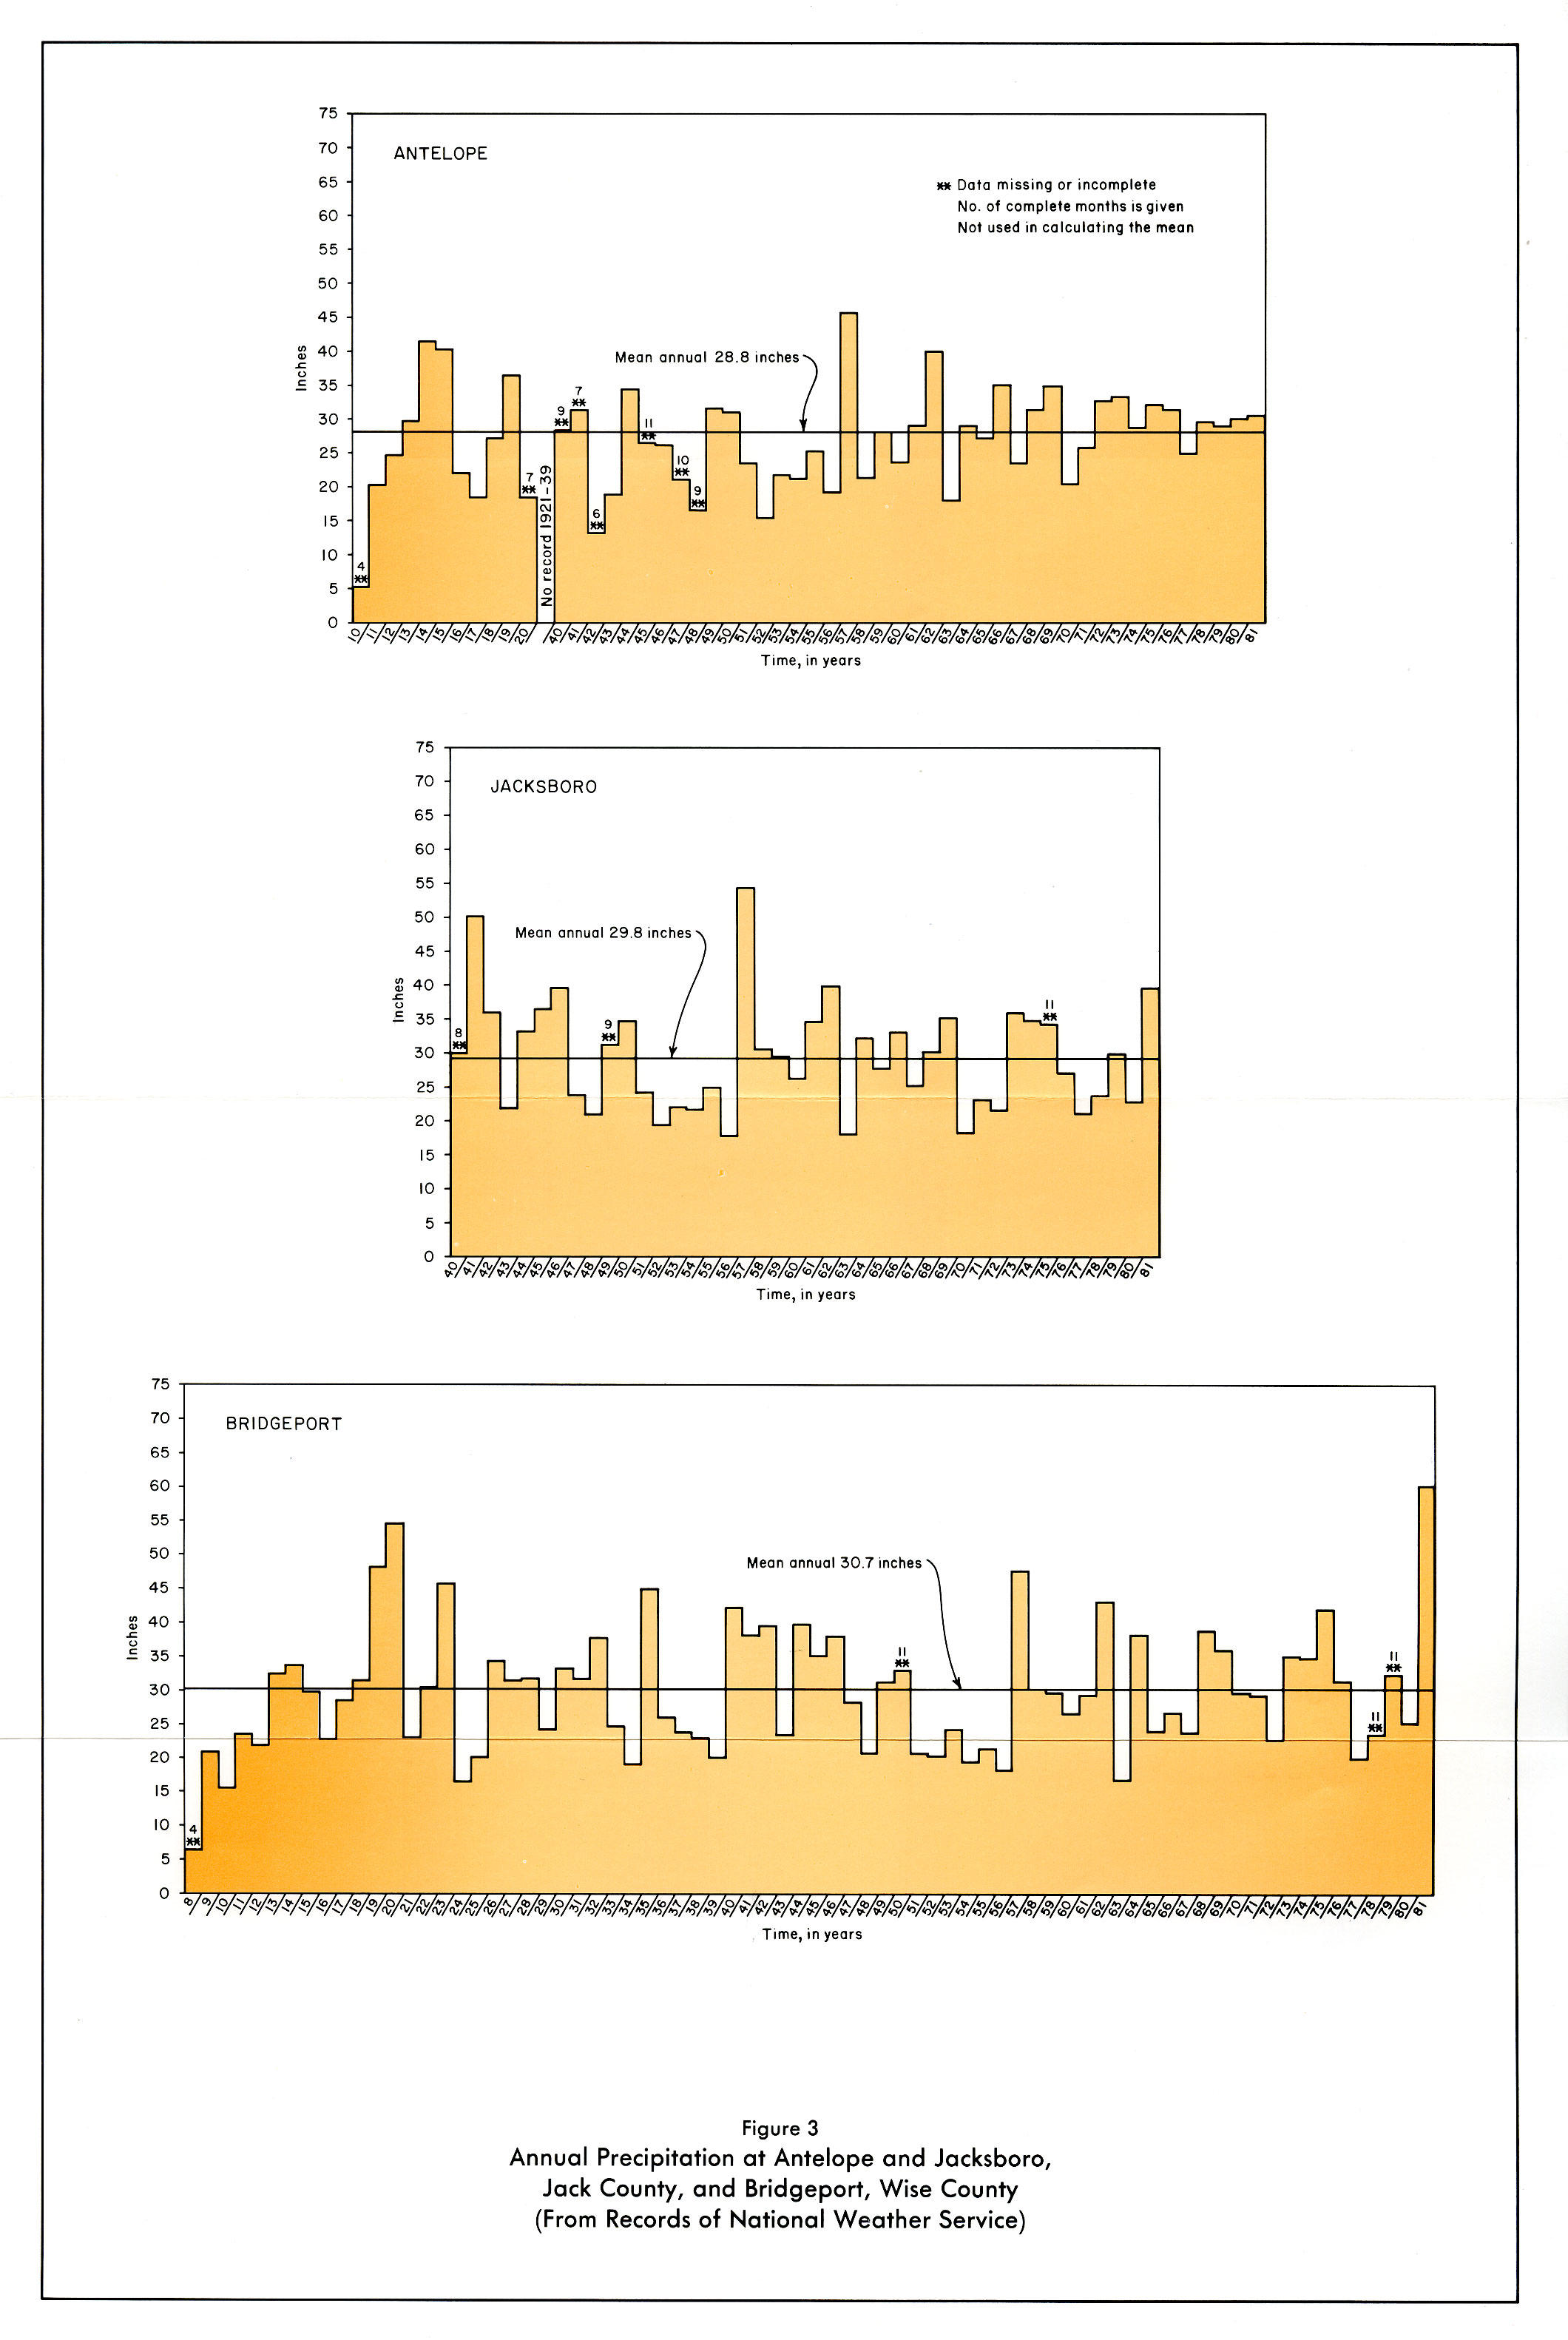
- Figure 3: Annual Precipitation at Antelope and Jacksboro, Jack County, and Bridgeport. Wise County
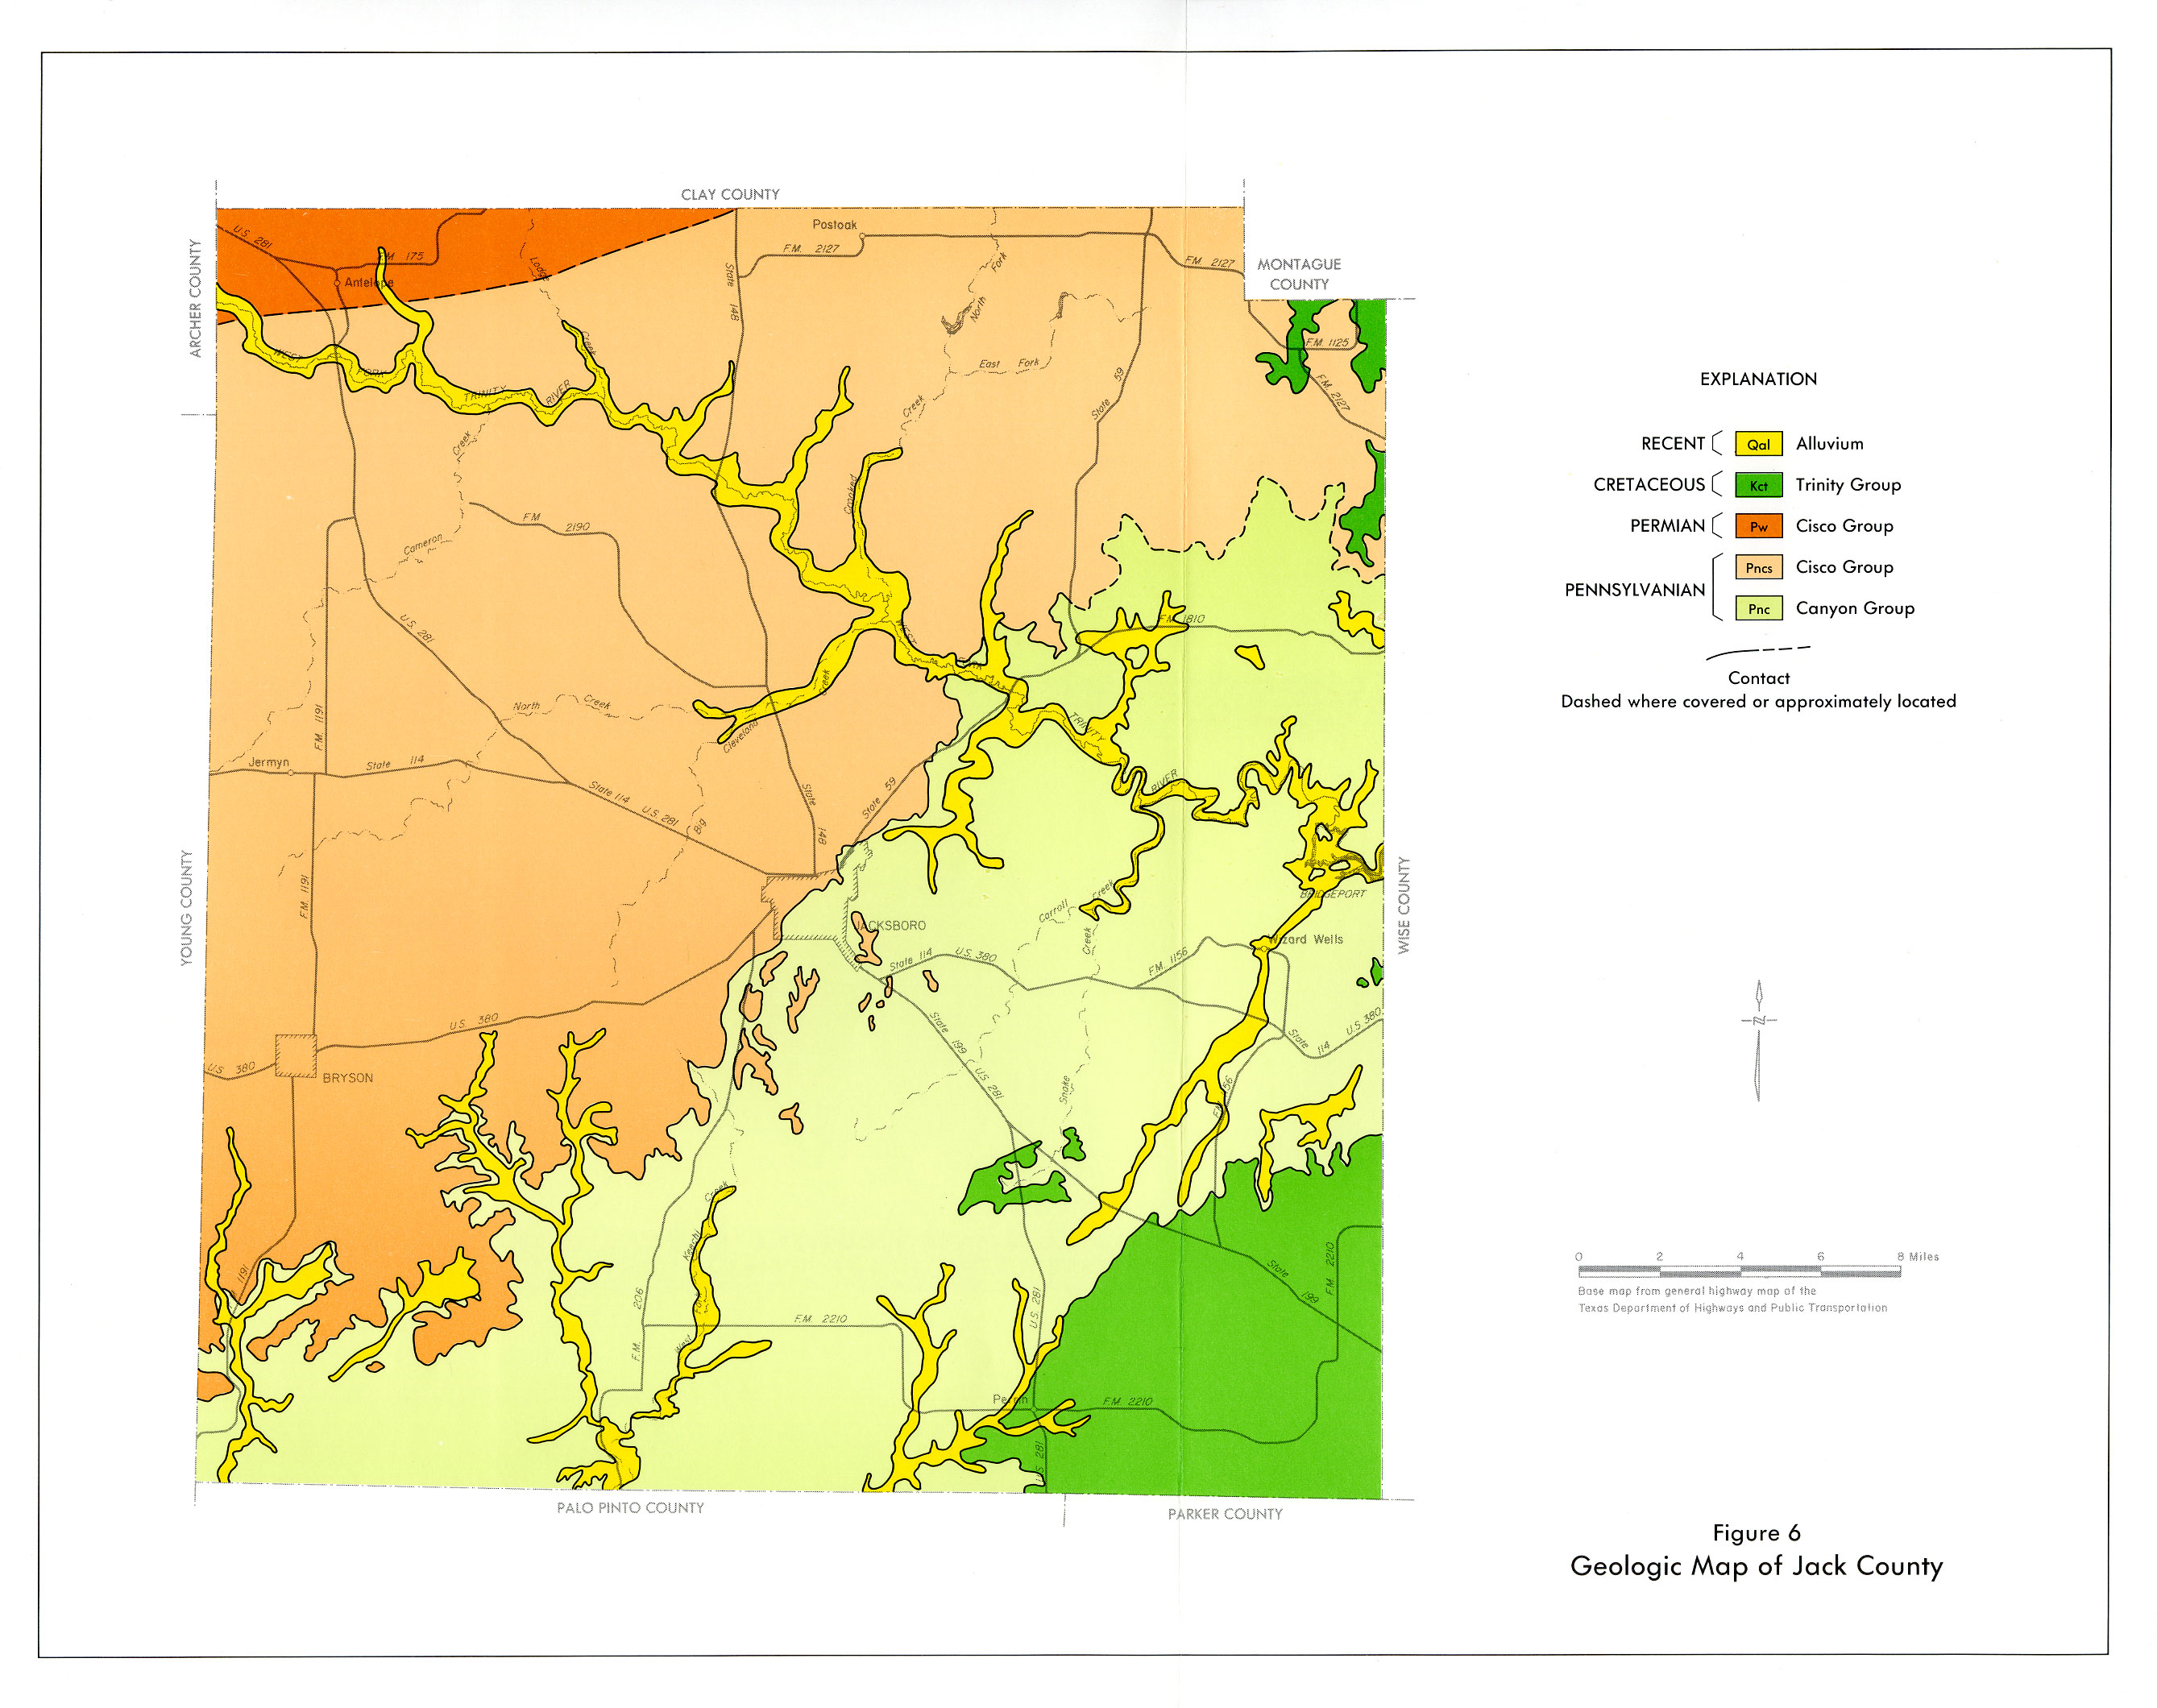
- Figure 6: Geologic Map of Jack County
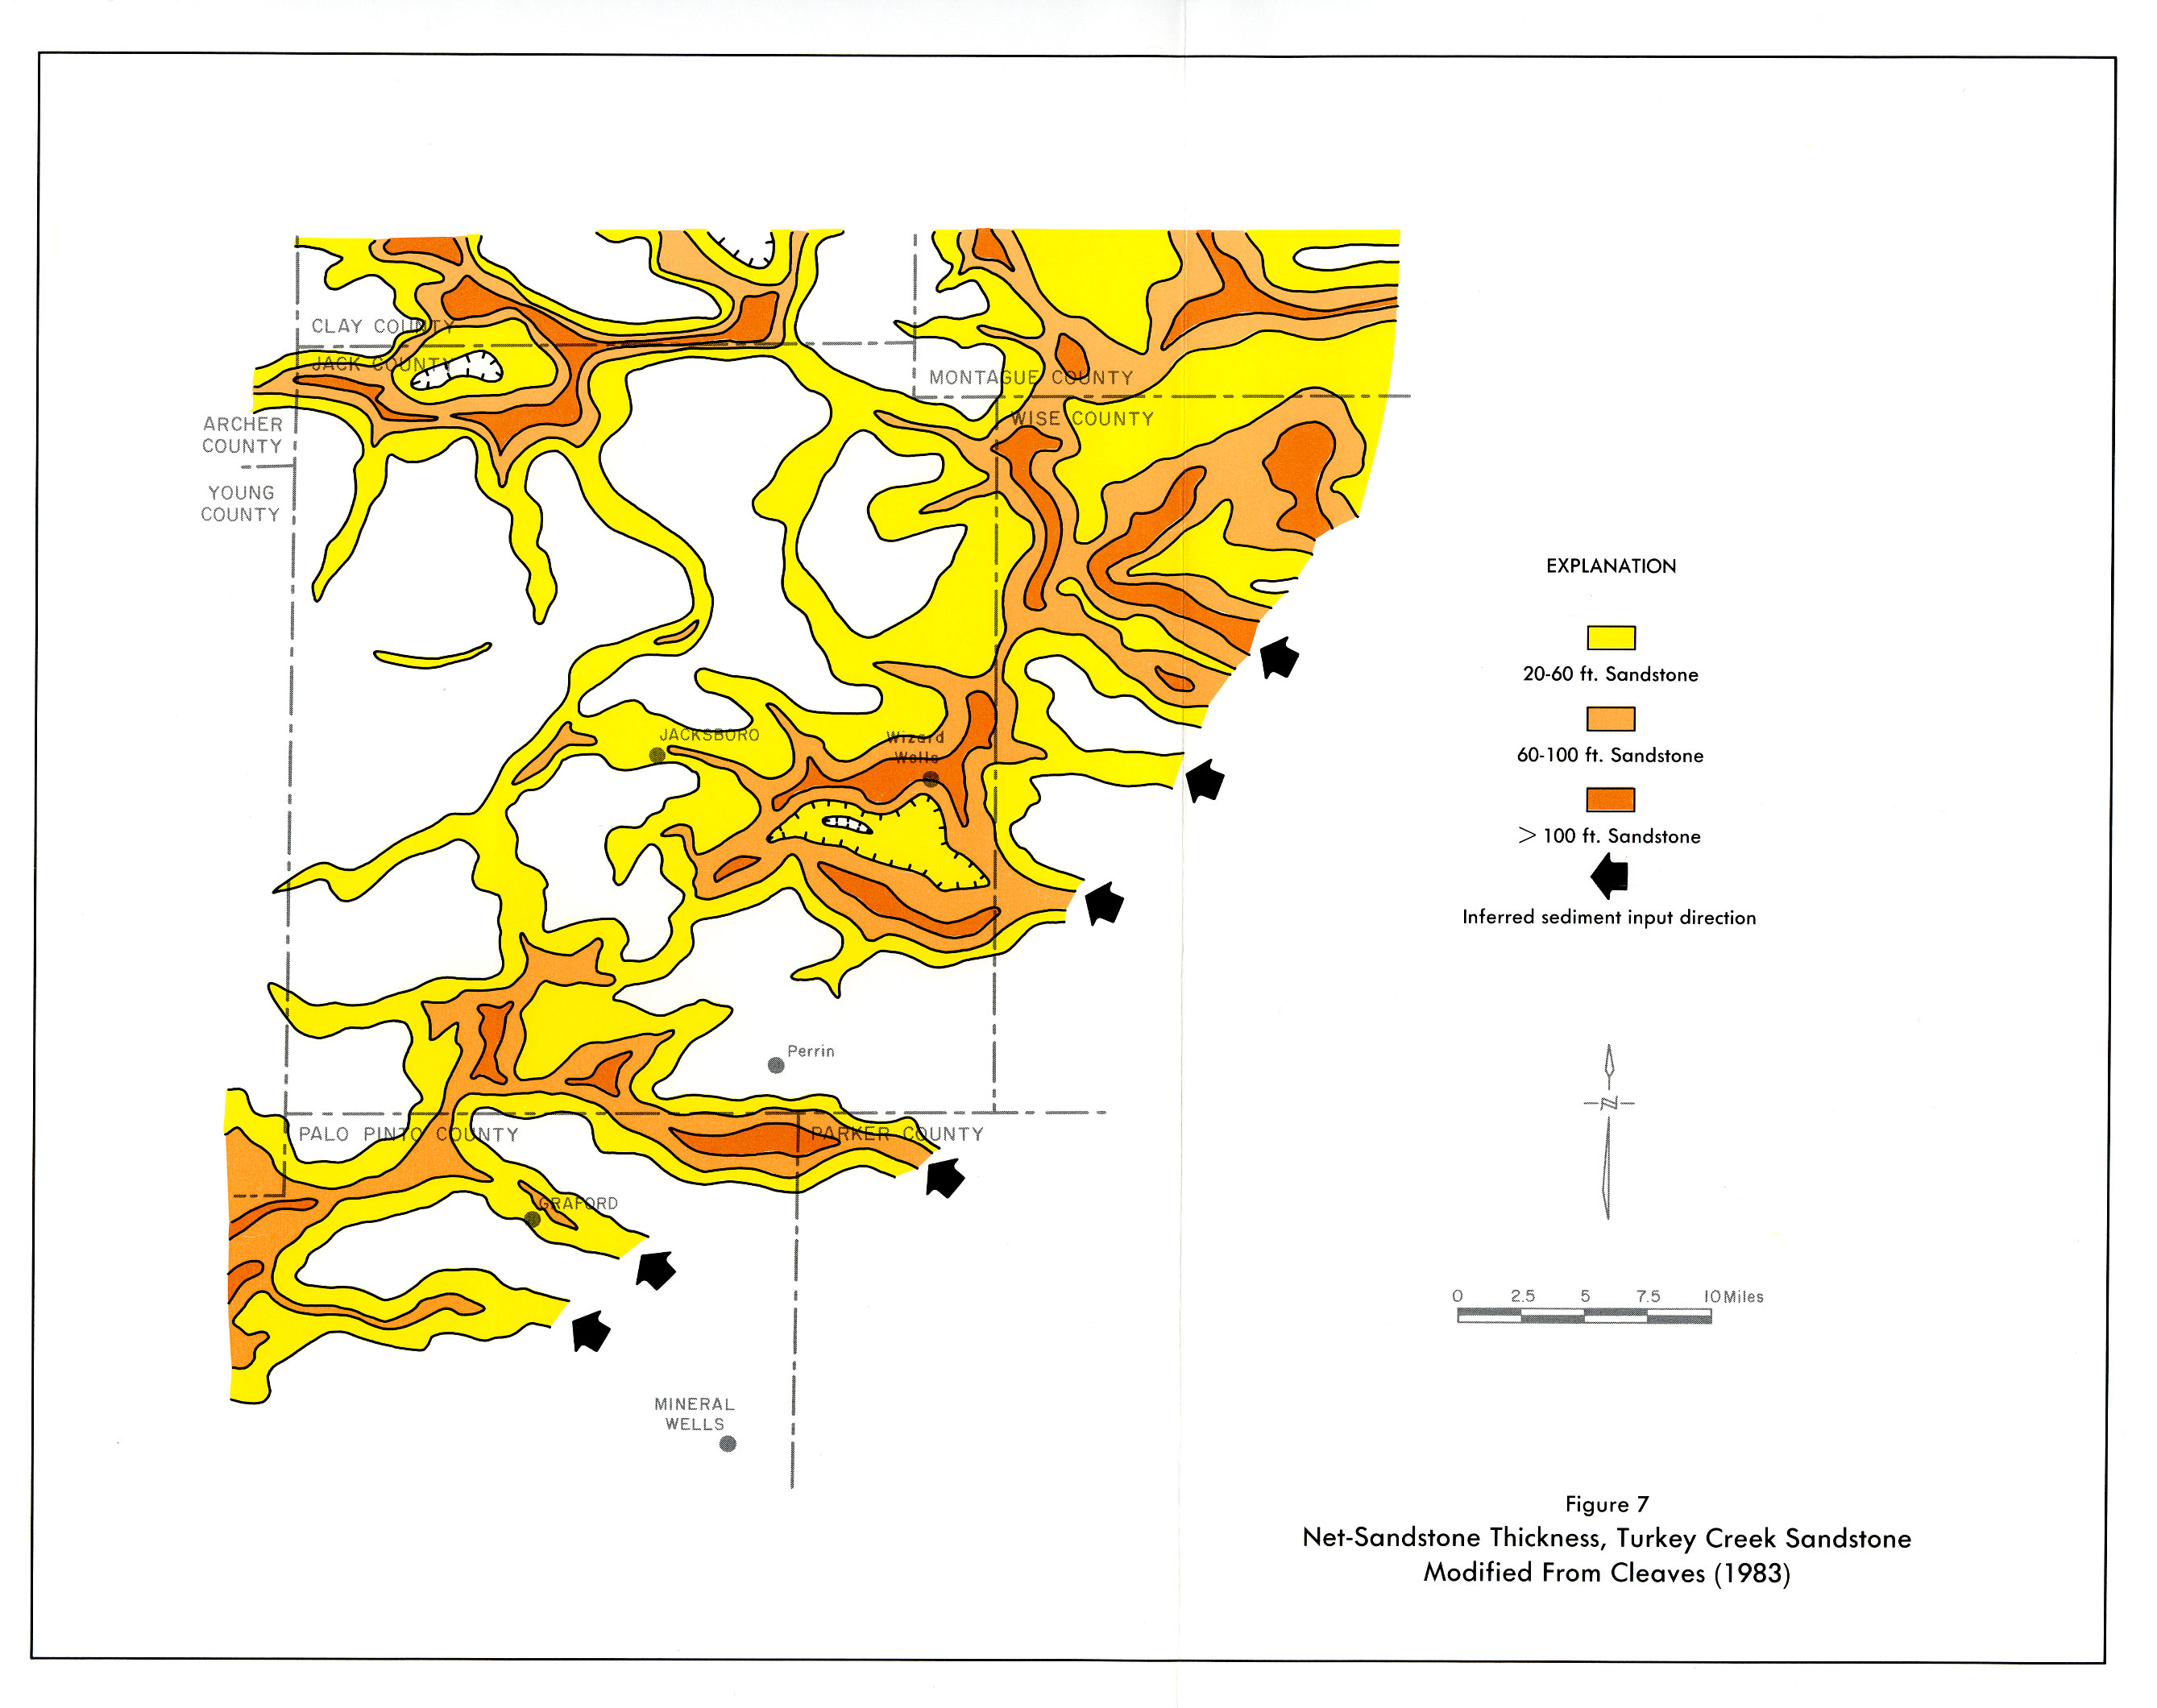
- Figure 7: Net-Sandstone Thickness, Turkey Creek Sandstone
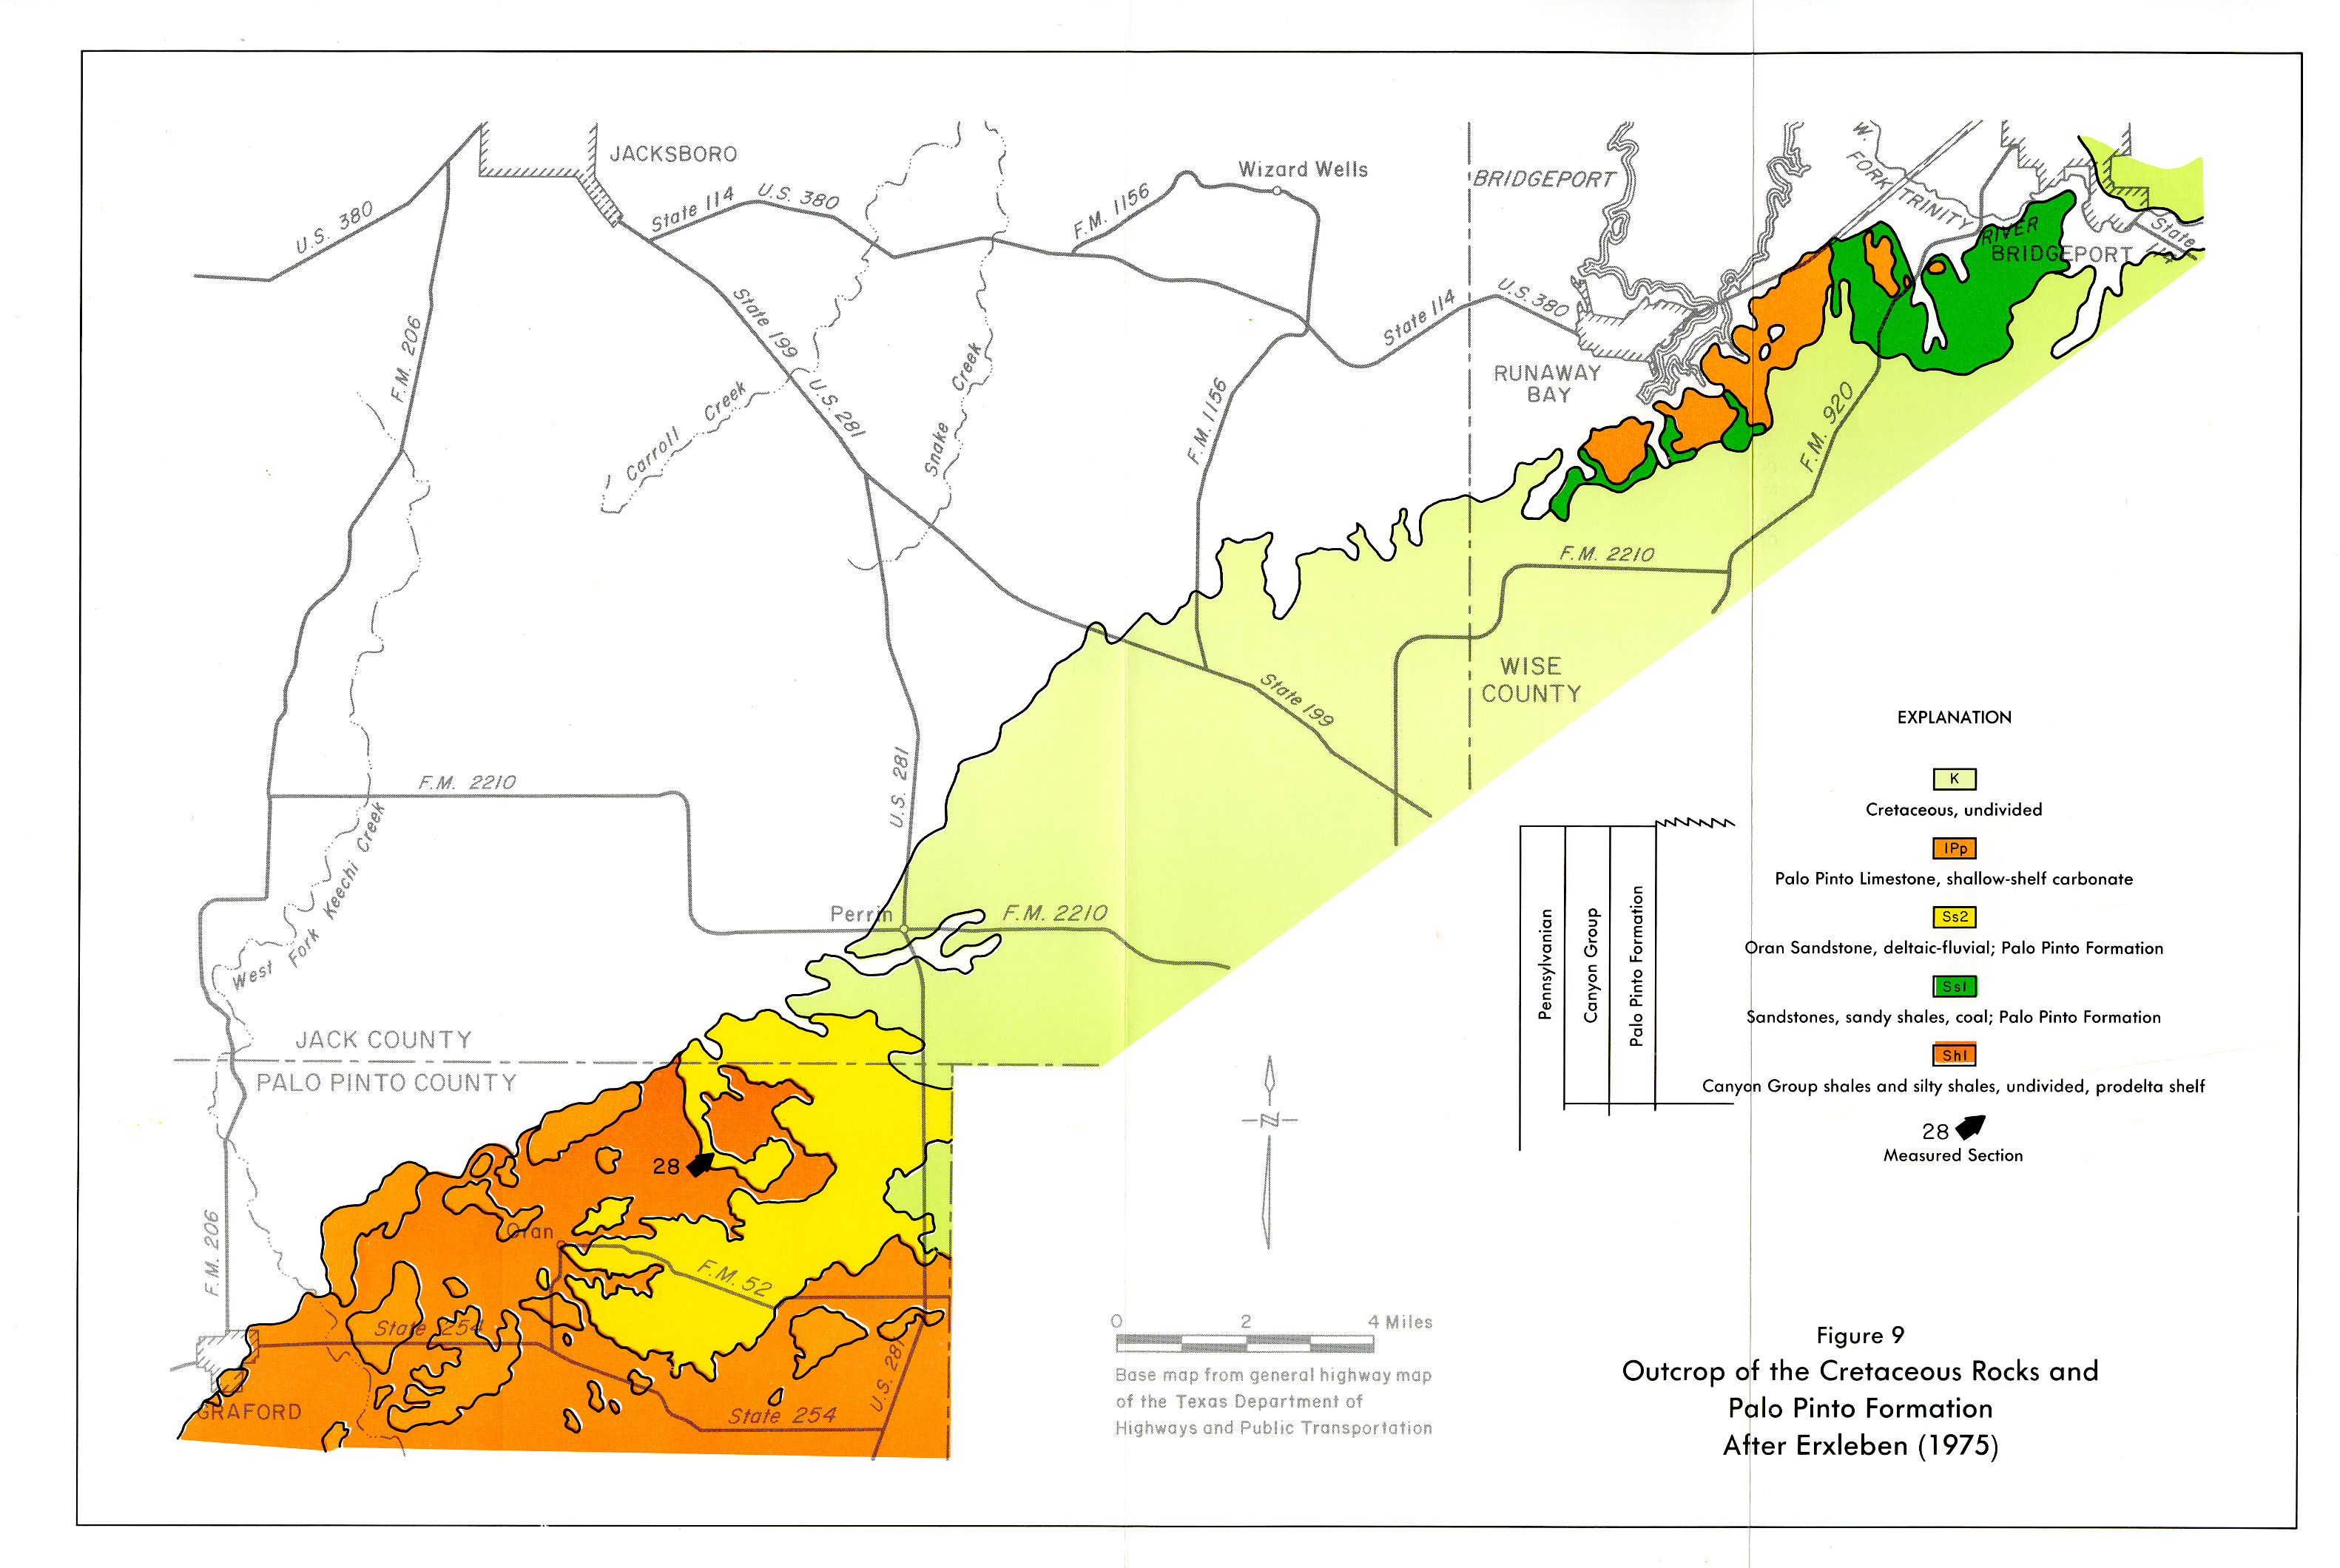
- Figure 9: Outcrop of Cretaceous Rocks and Palo Pinto Formation
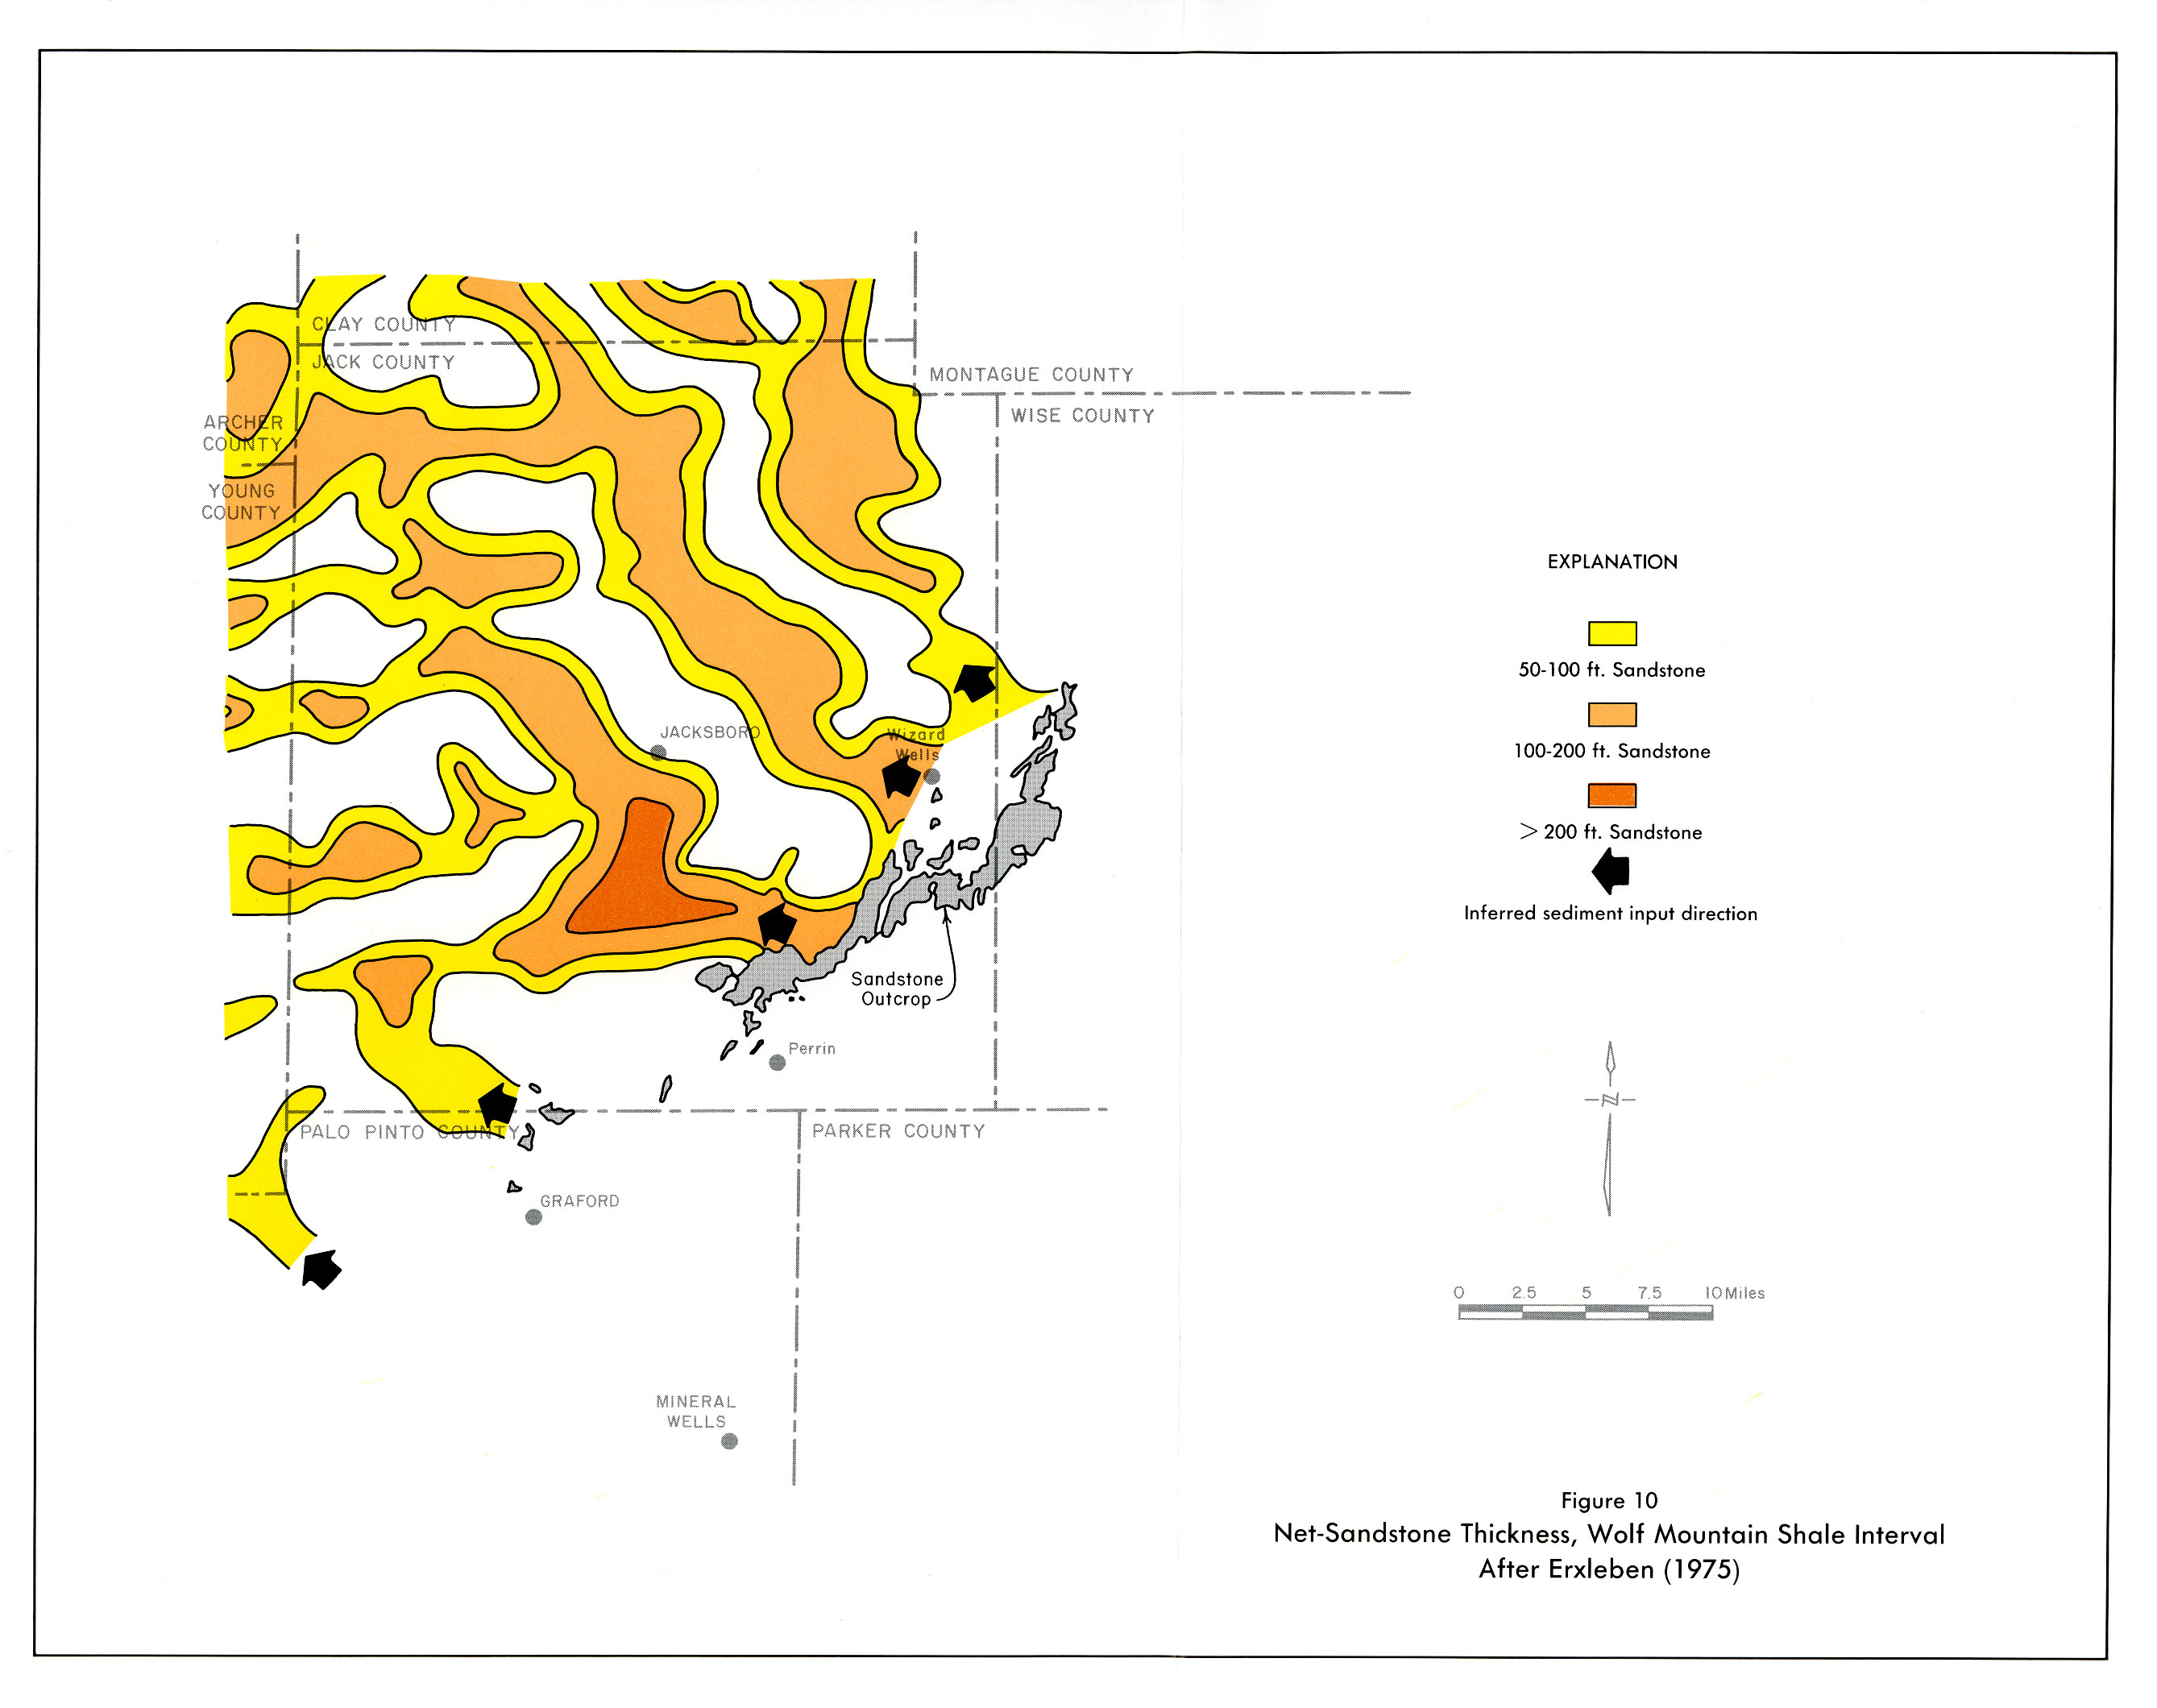
- Figure 10: Net-Sandstone Thickness, Wolf Mountain Shale Interval
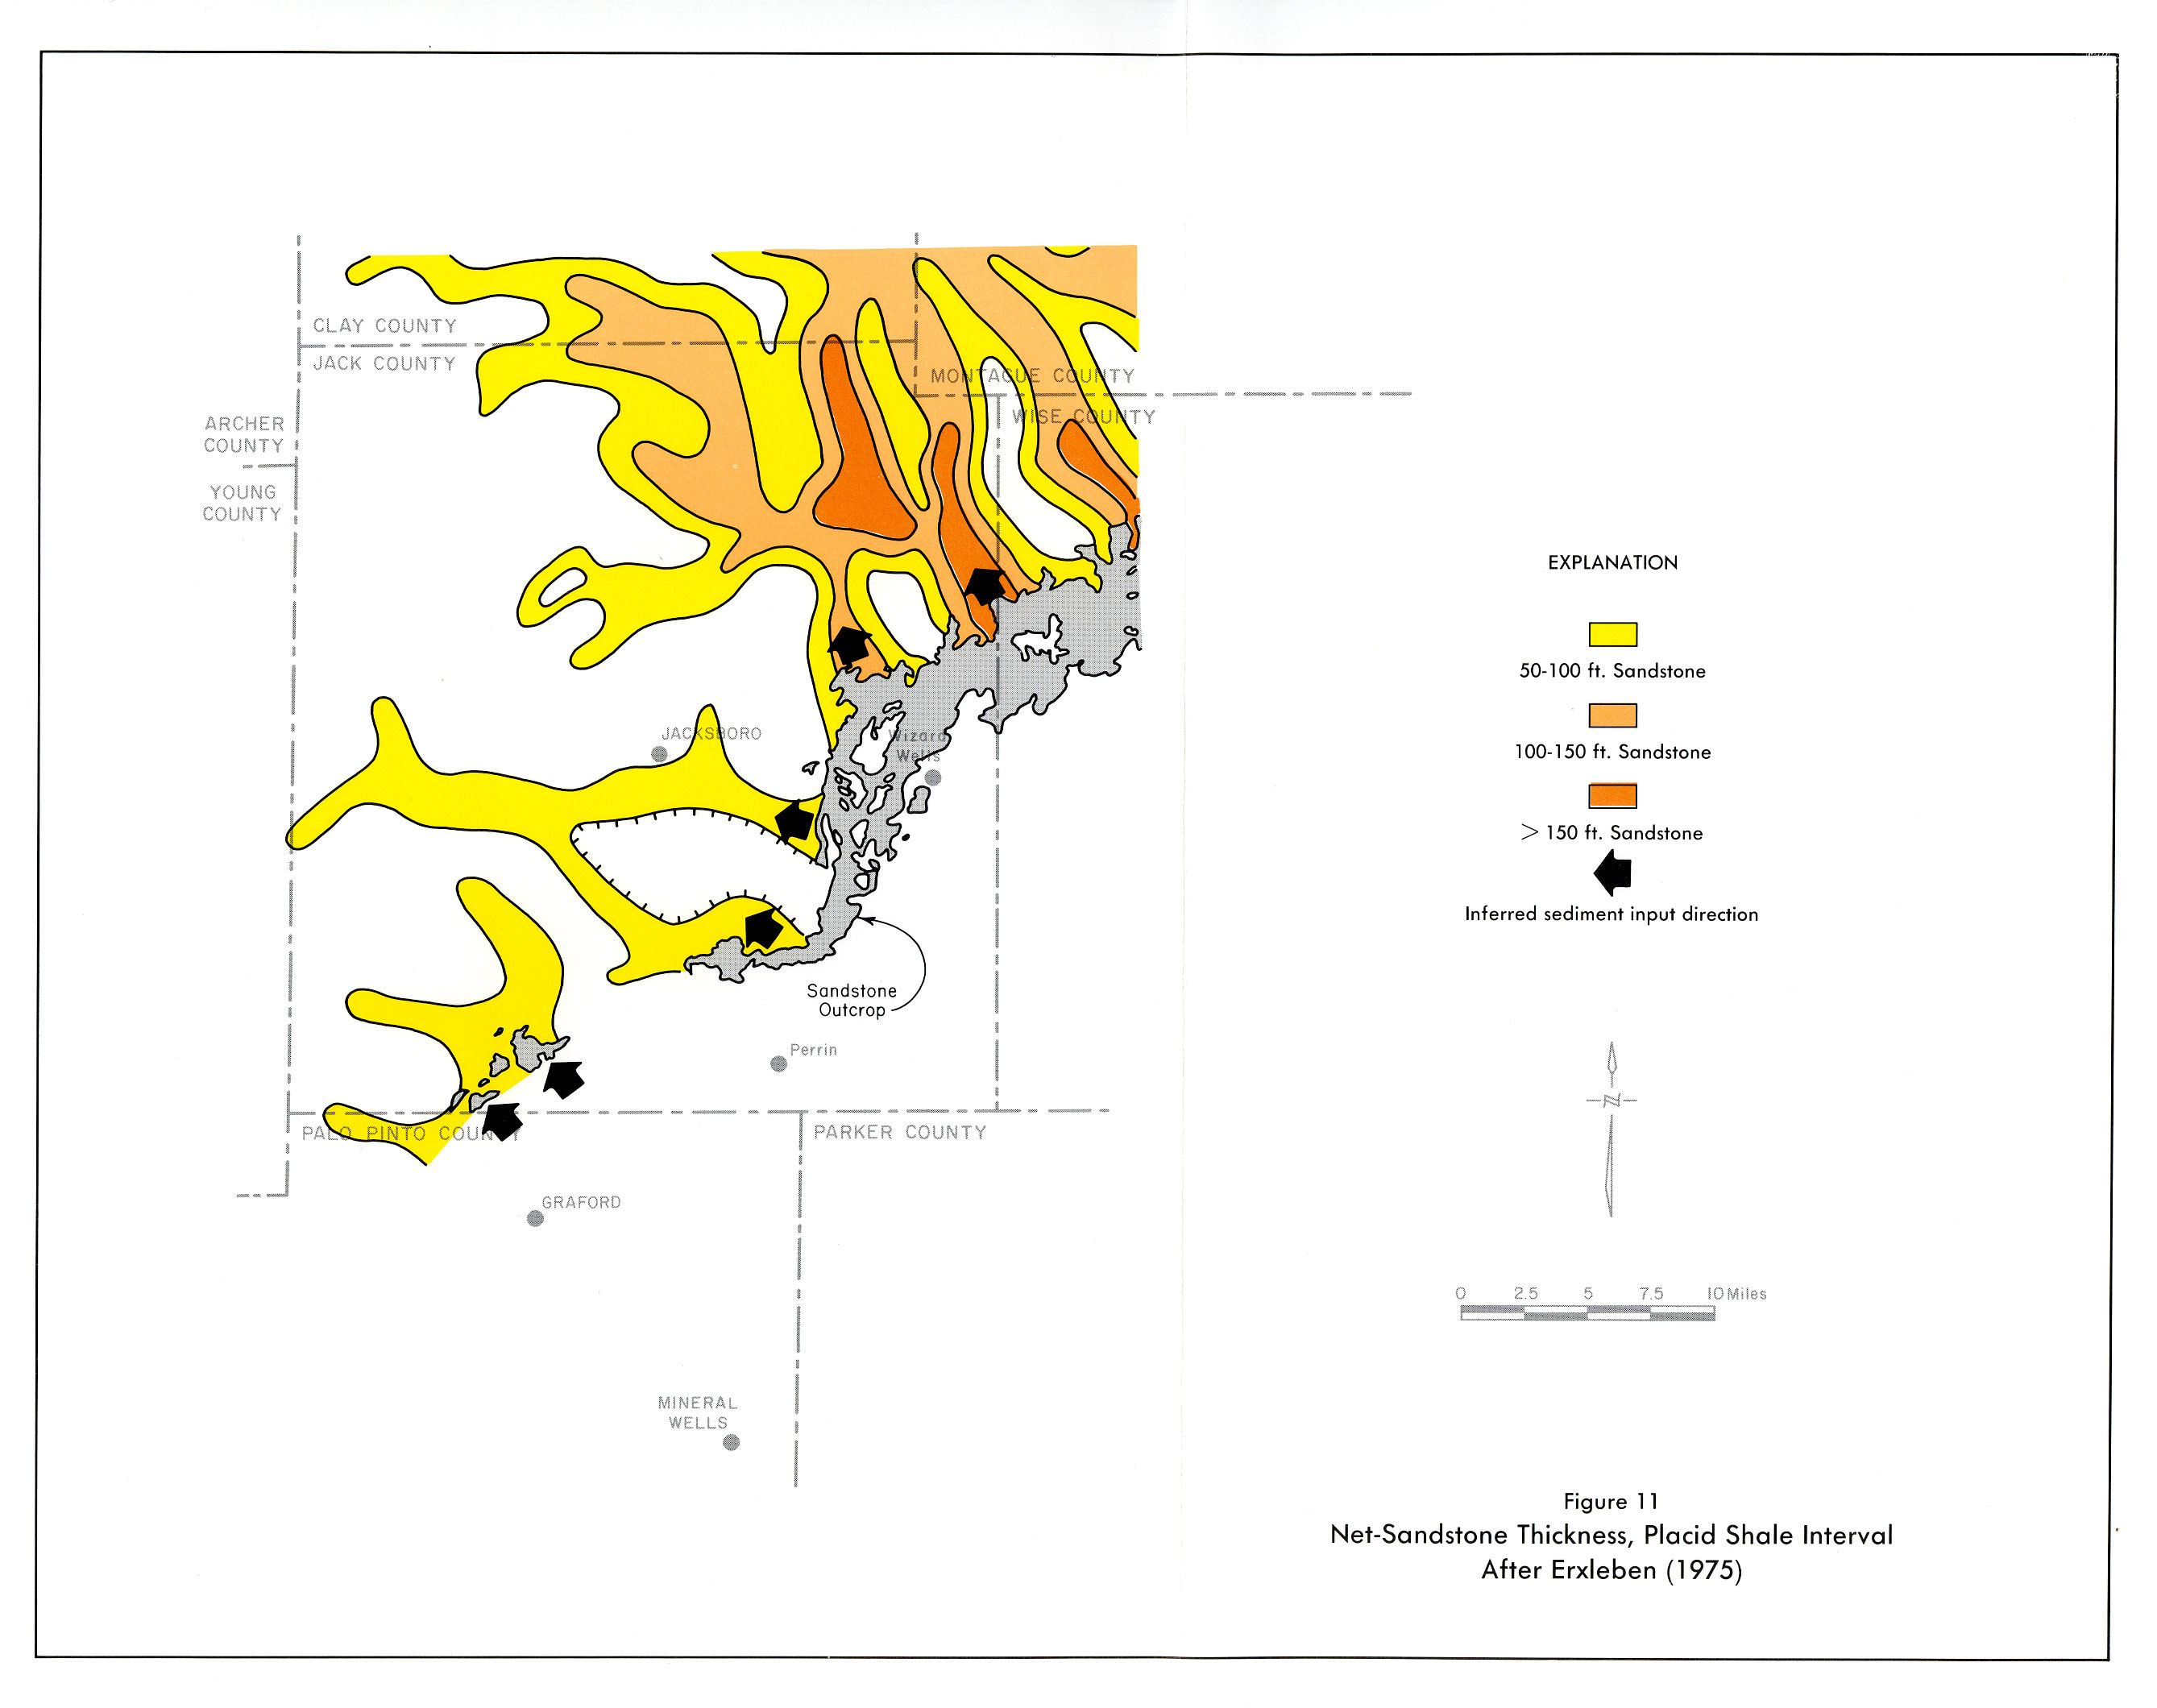
- Figure 11: Net-Sandstone Thickness, Placid Shale Interval
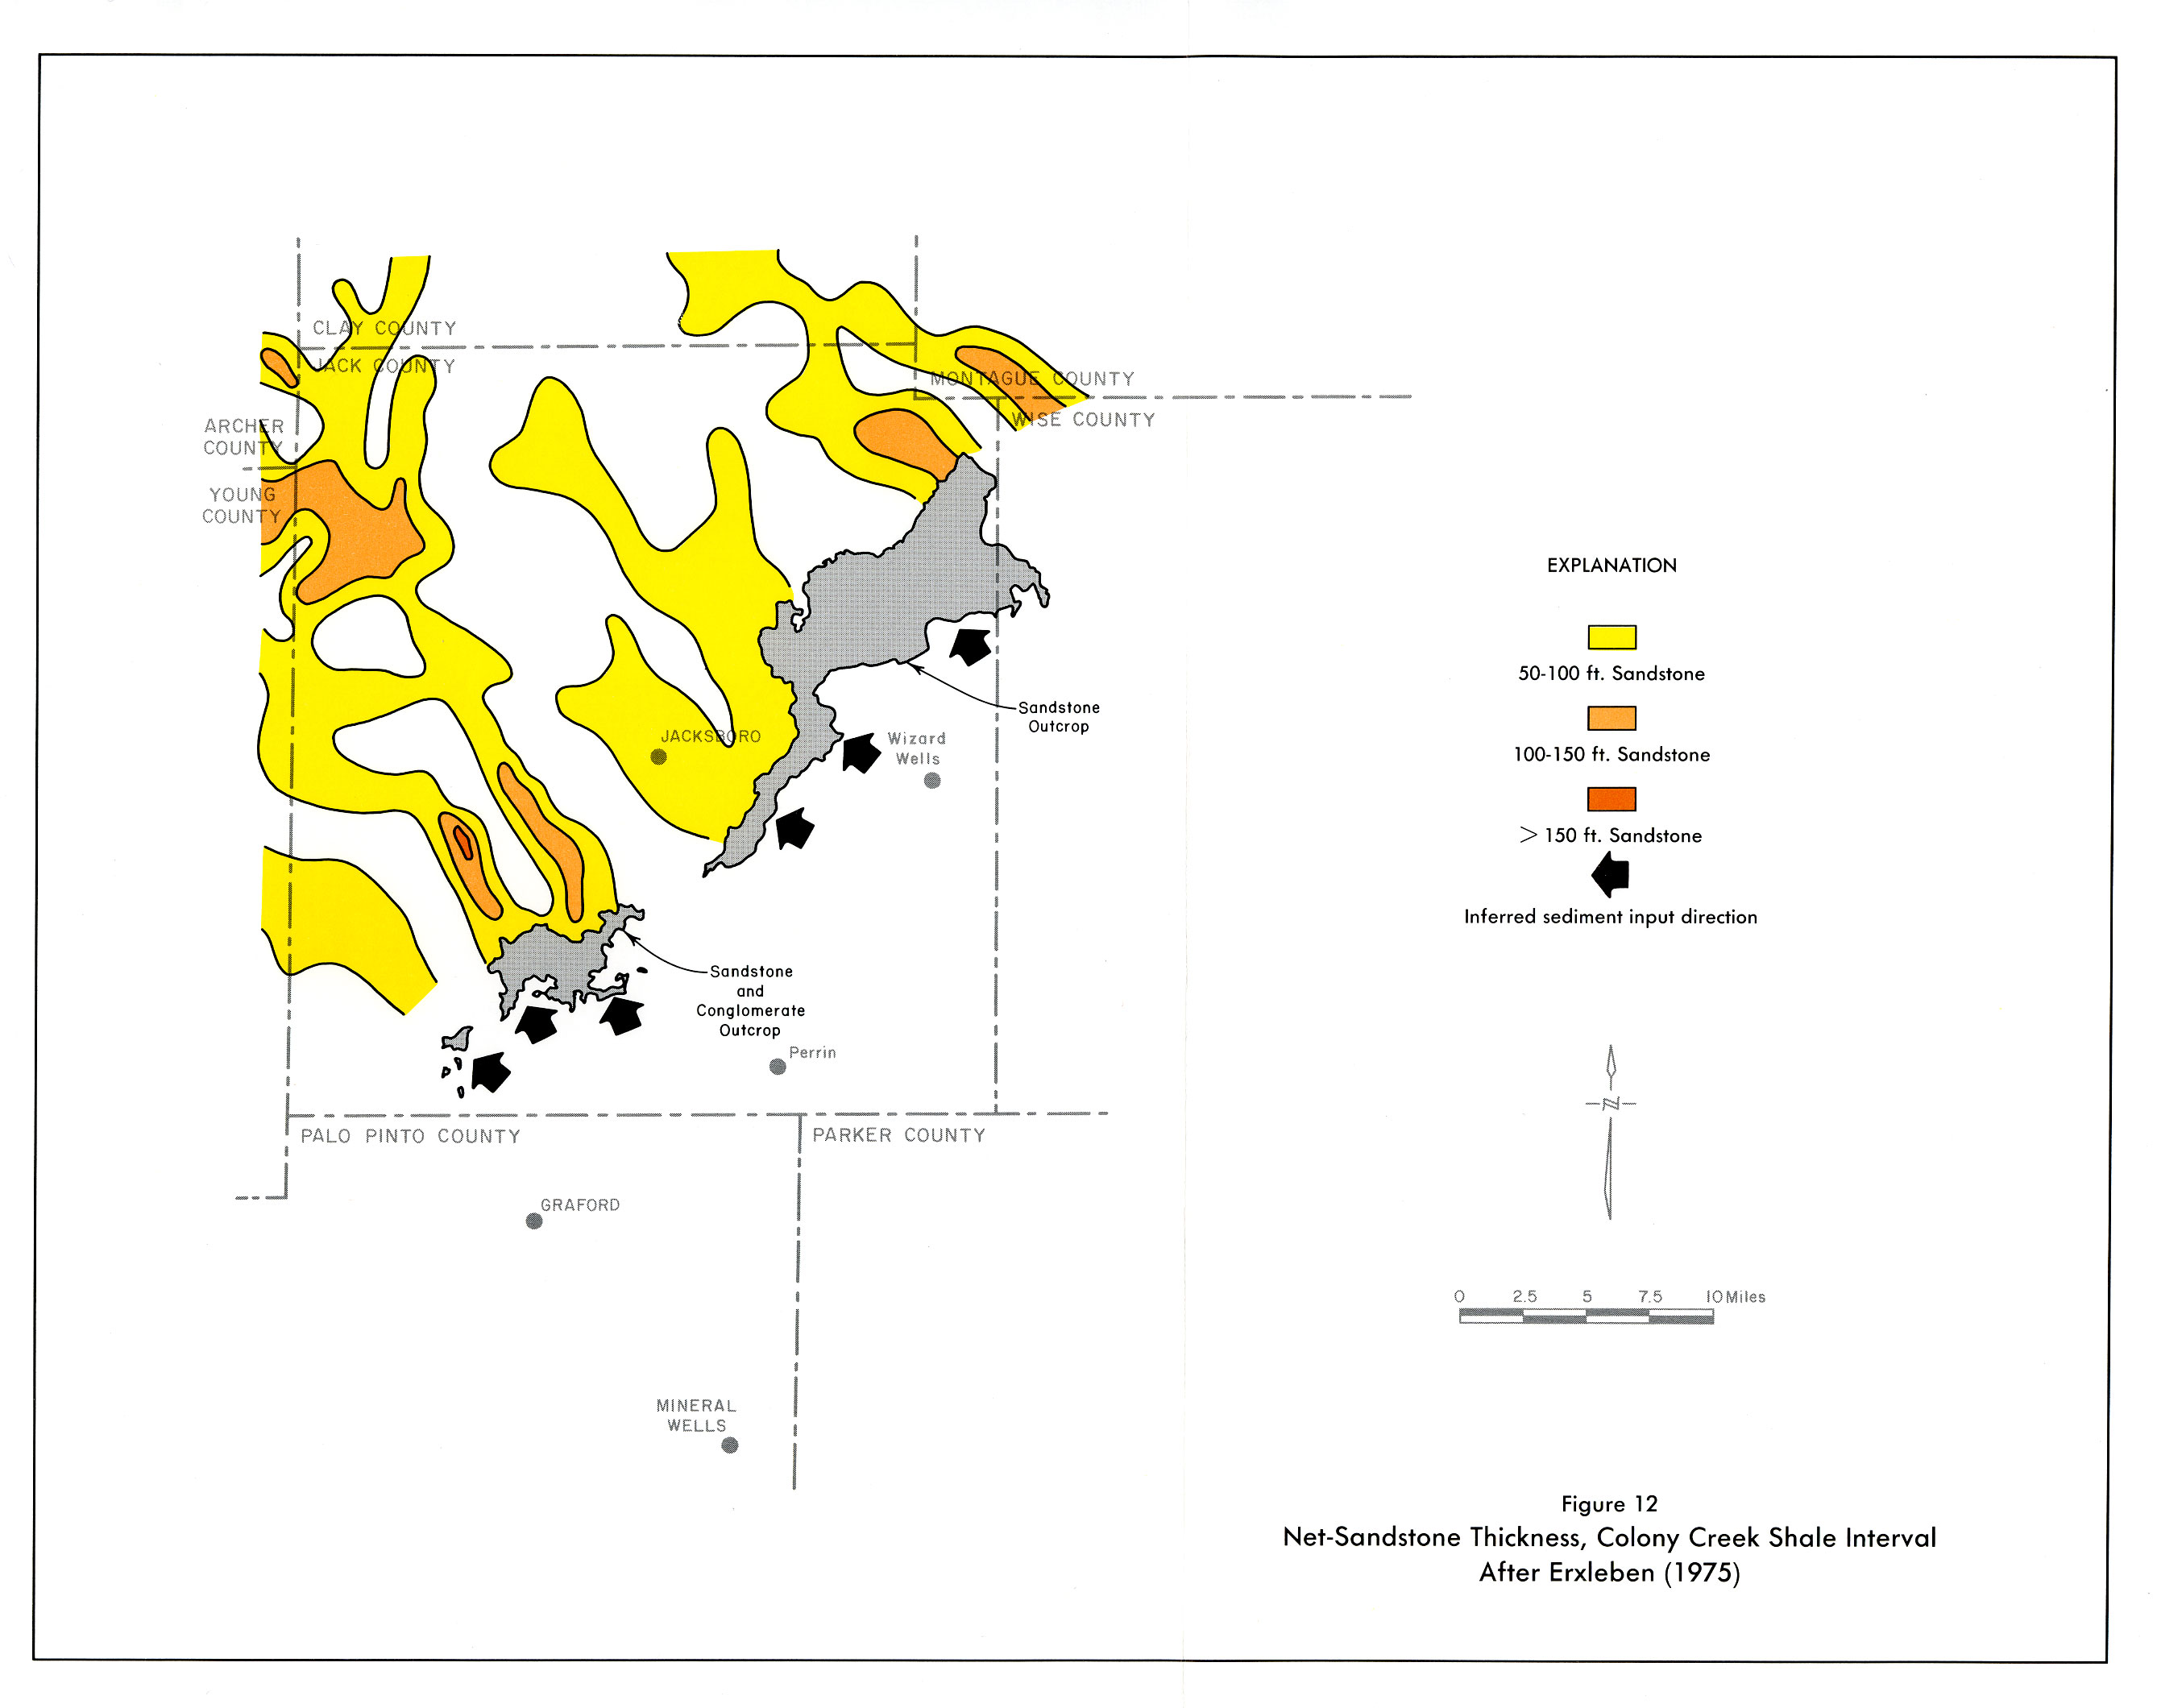
- Figure 12: Net-Sandstone Thickness, Colony Creek Shale Interval
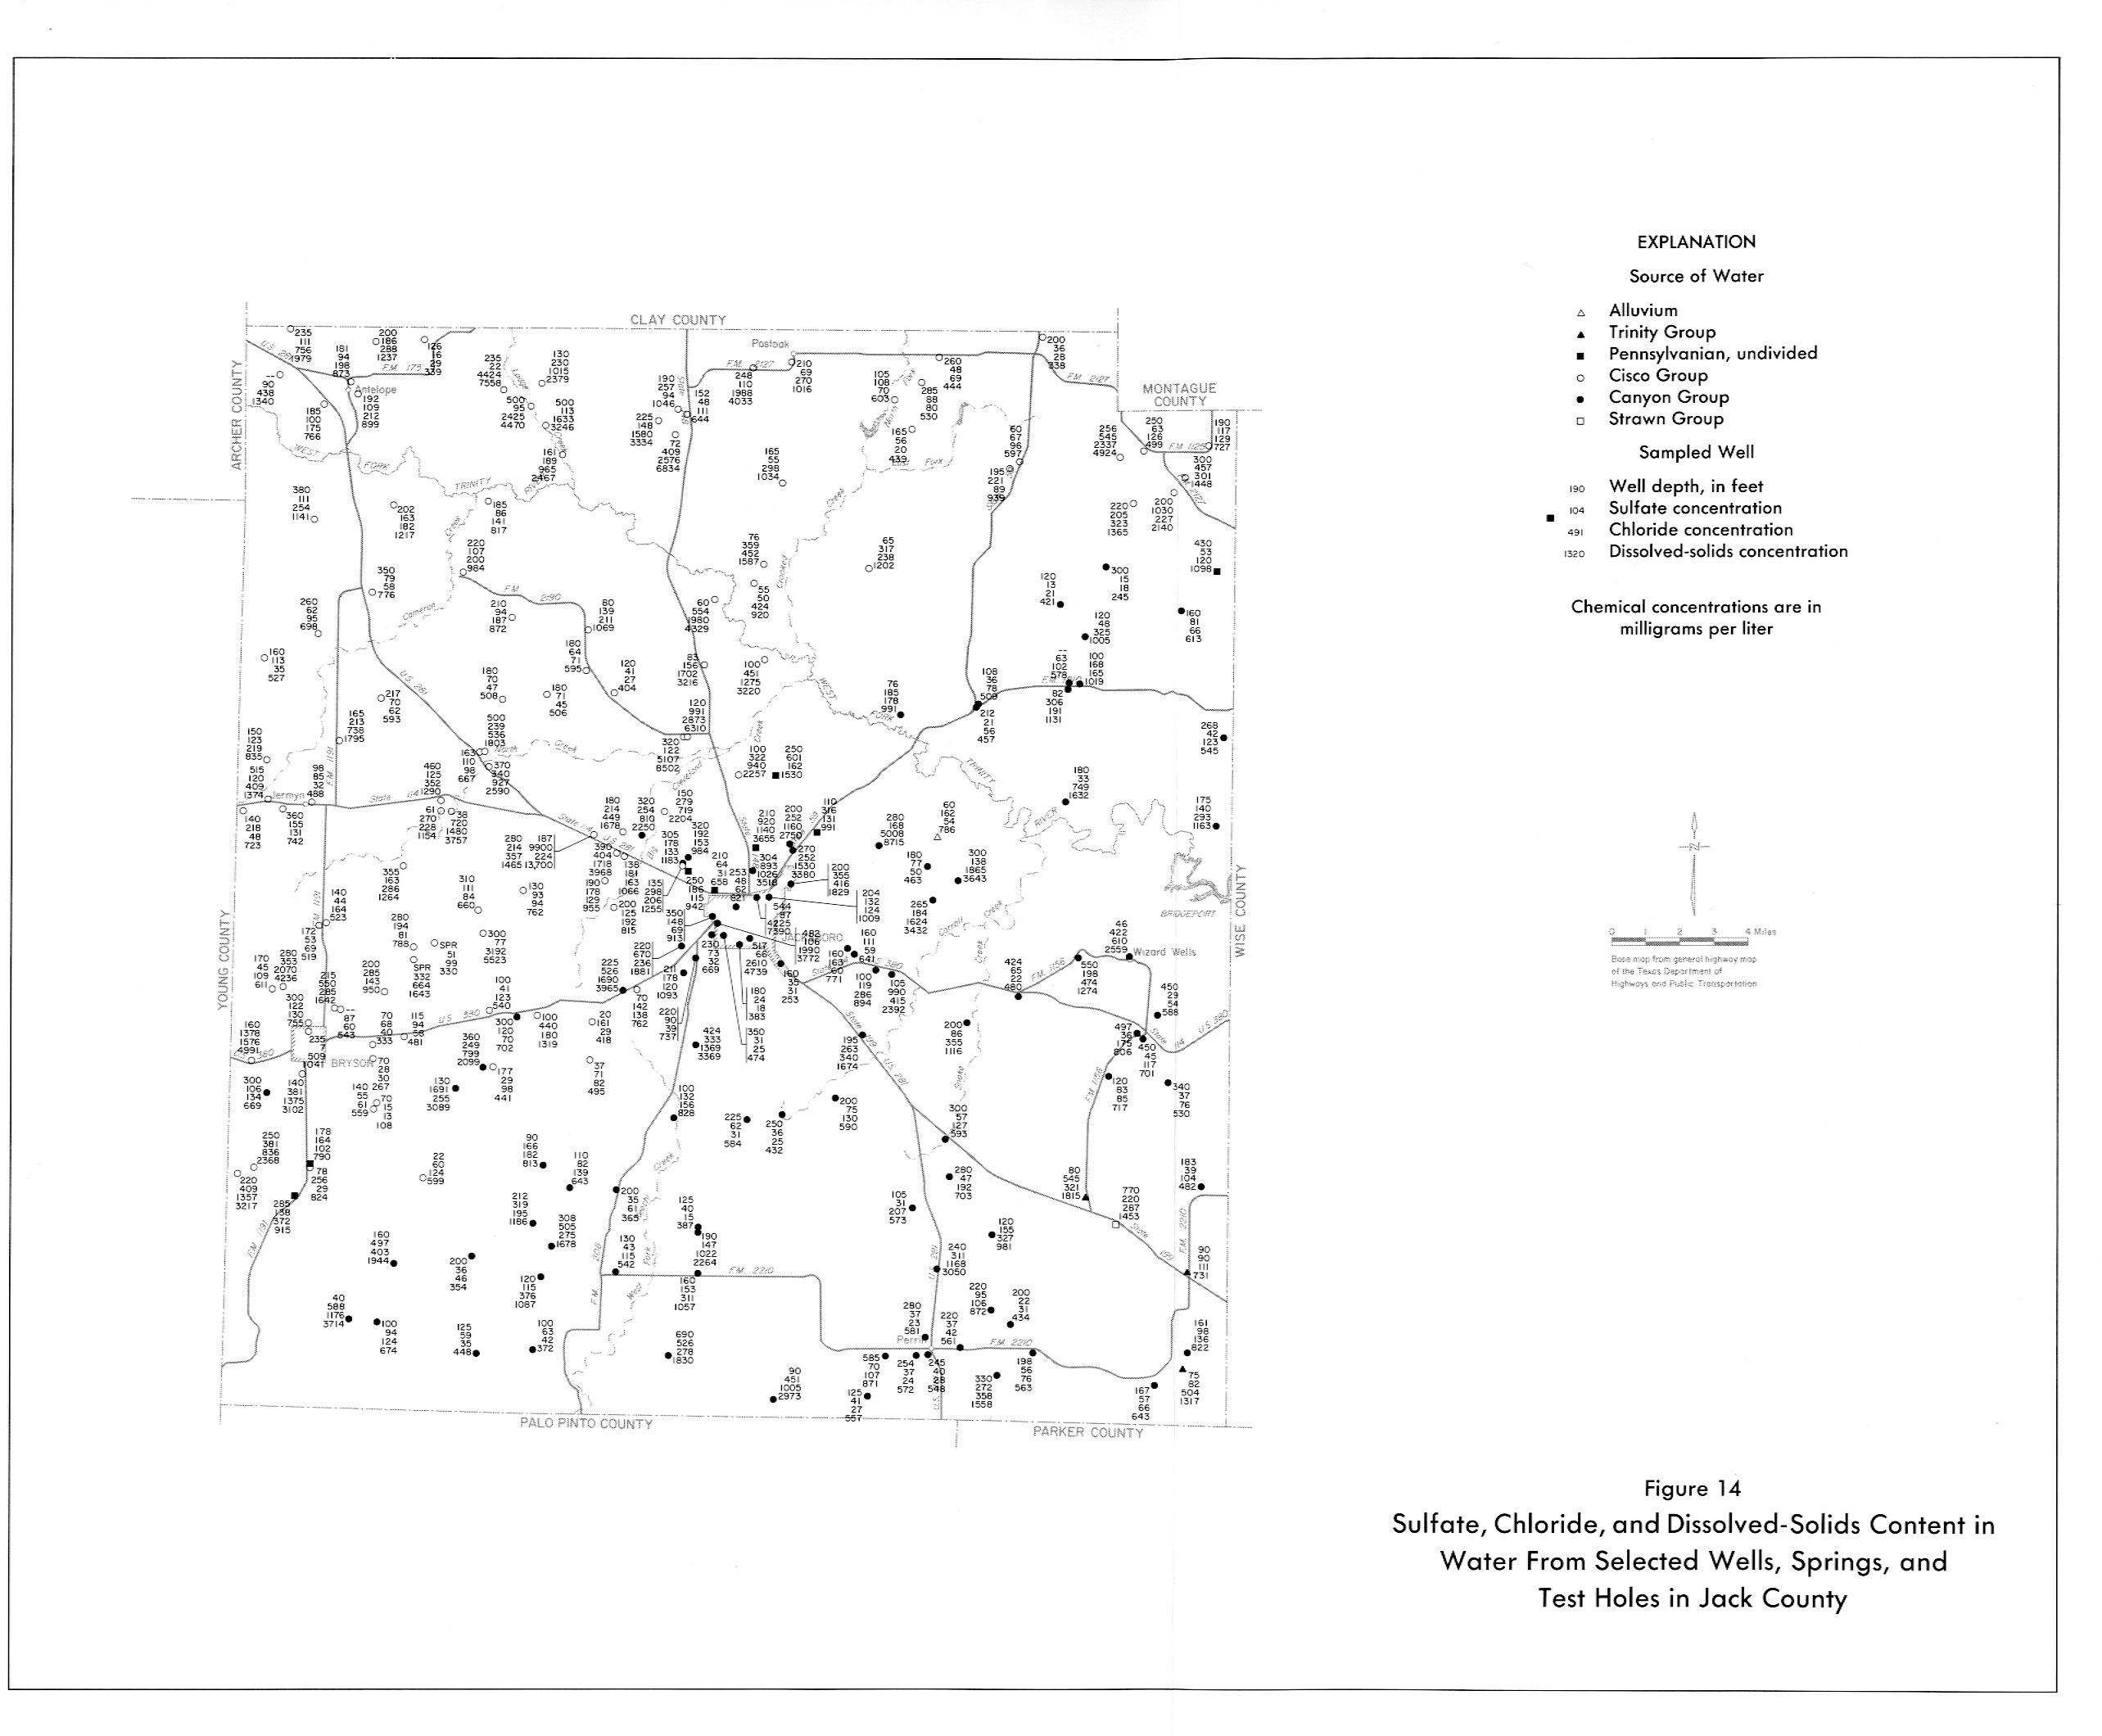
- Figure 14: Sulfate. Chloride, and Dissolved-Solids Content in Water from Selected Wells, Springs, and test Holes in Jack County
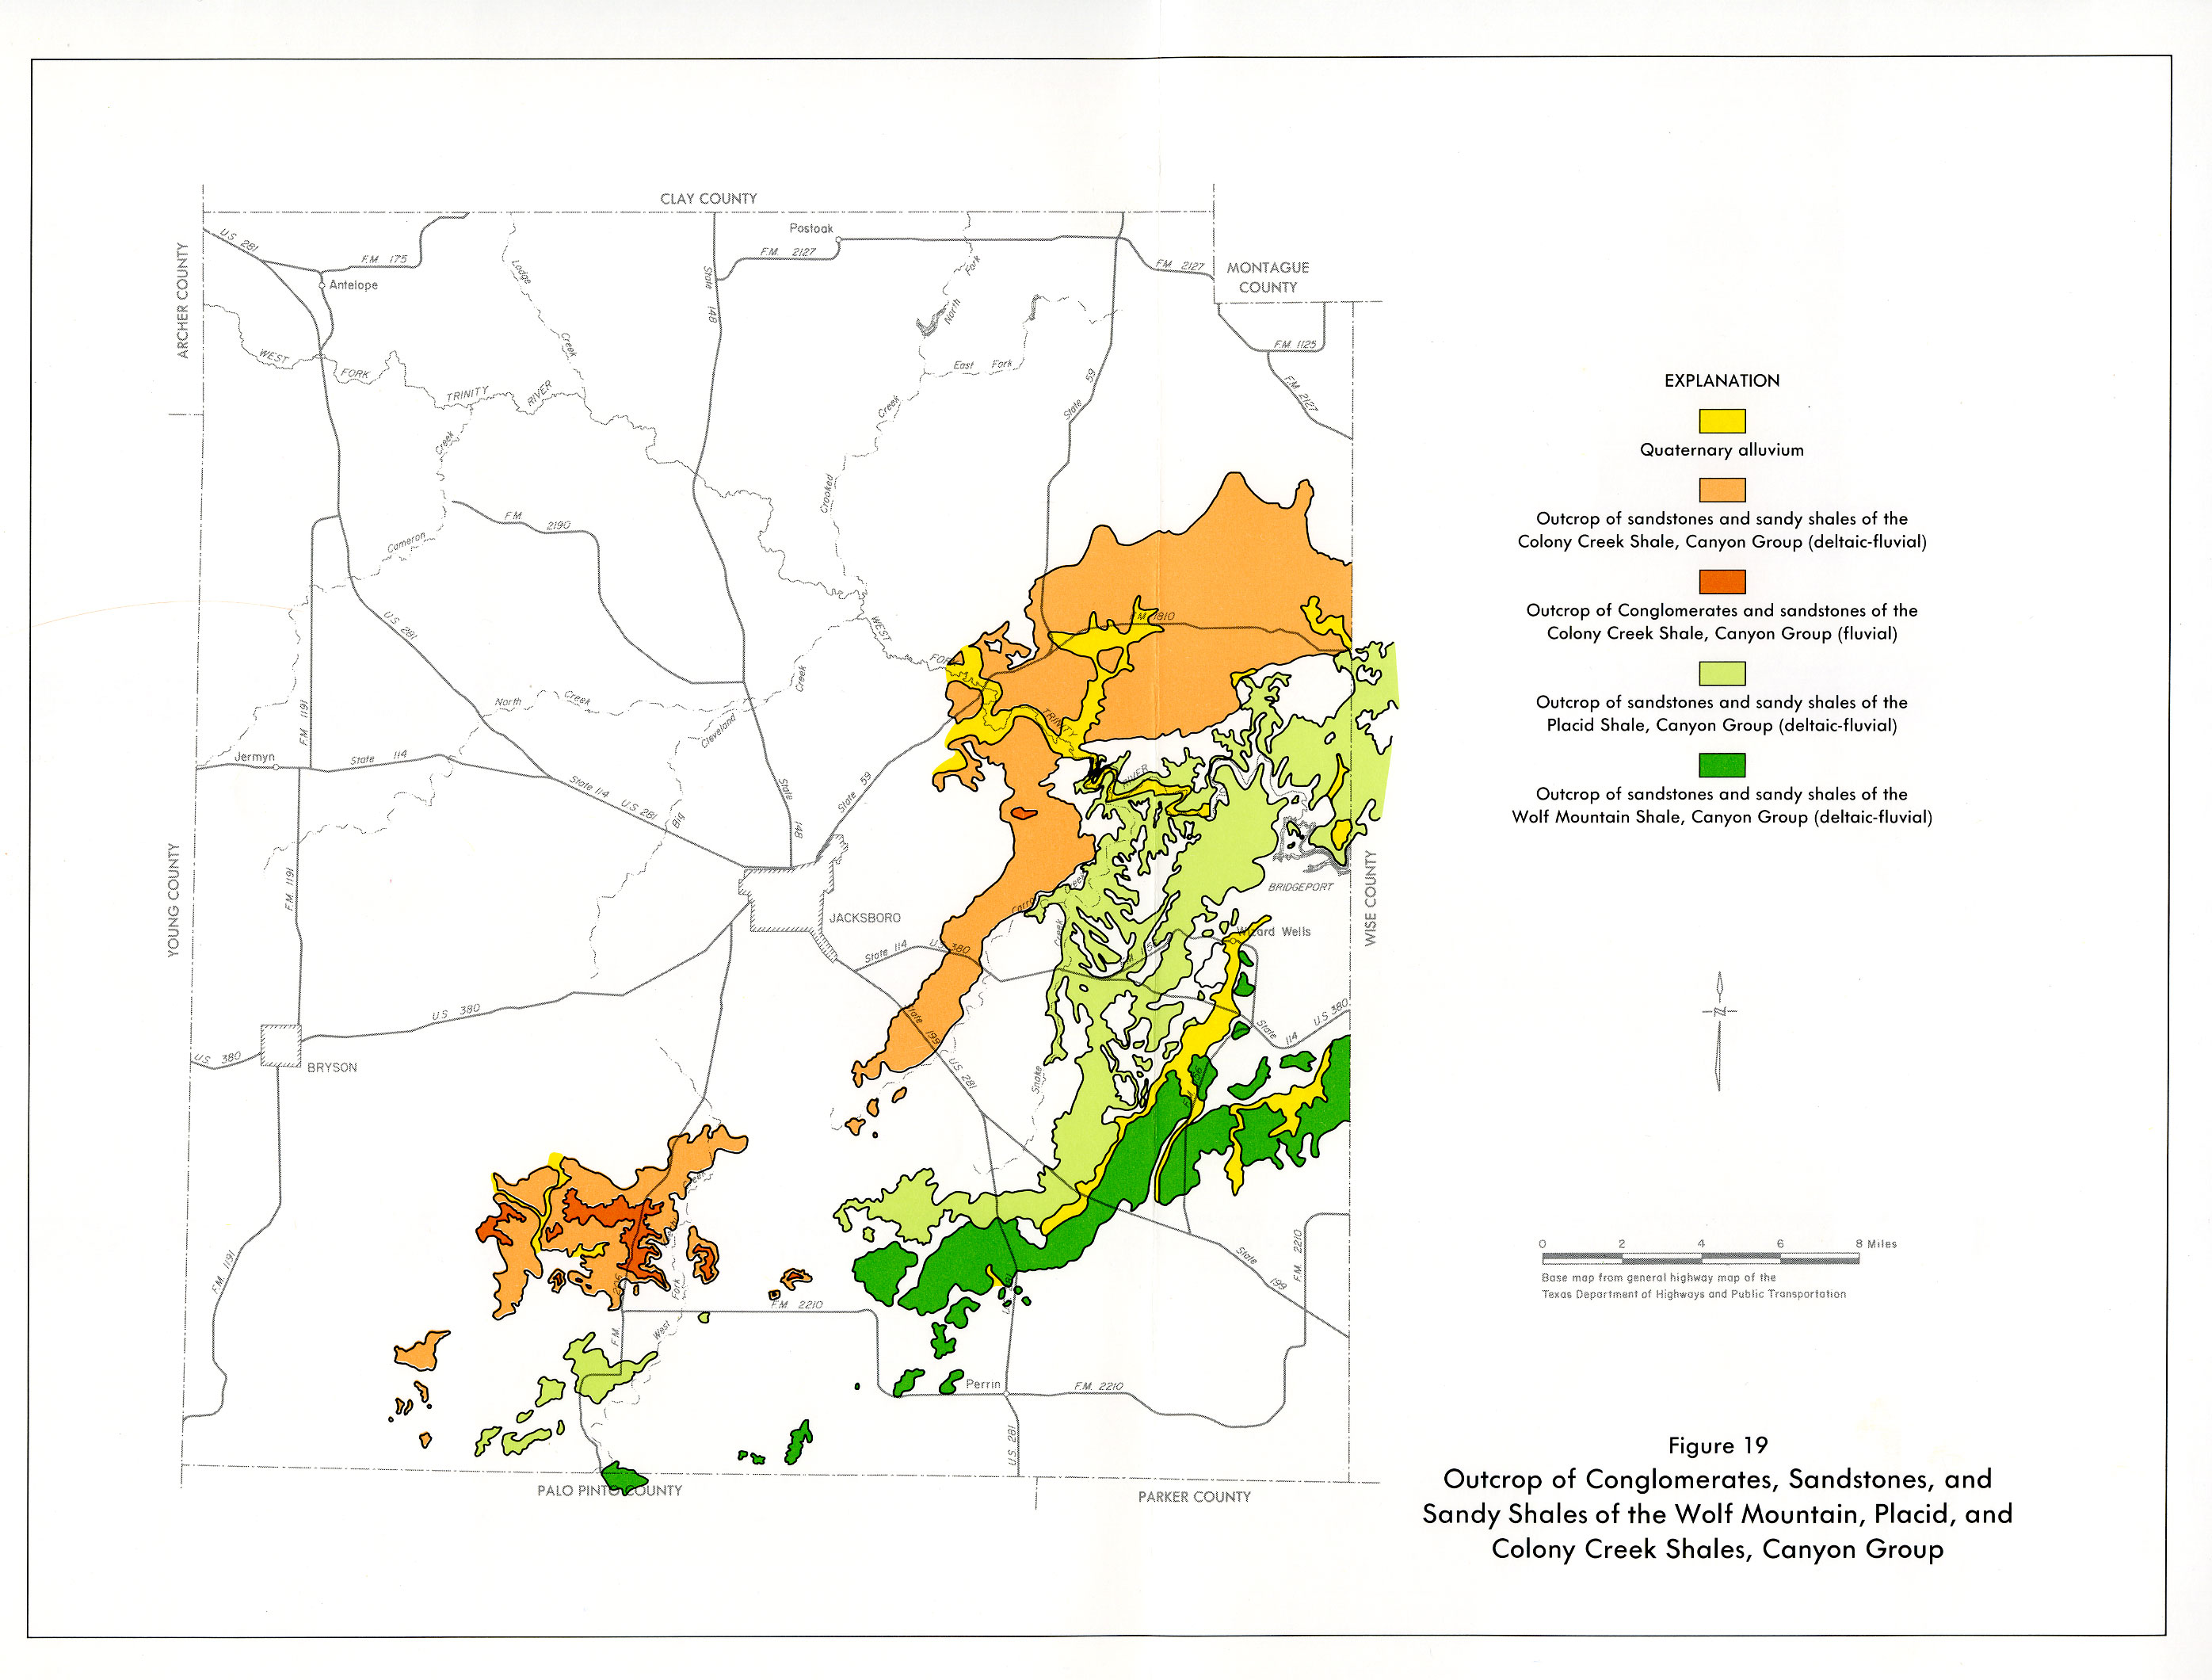
- Figure 19: Outcrop of Conglomerates, Sandstones, and Sandy Shales of Wolf Mountain, Placid, and Colony Creek Shales, Canyon group
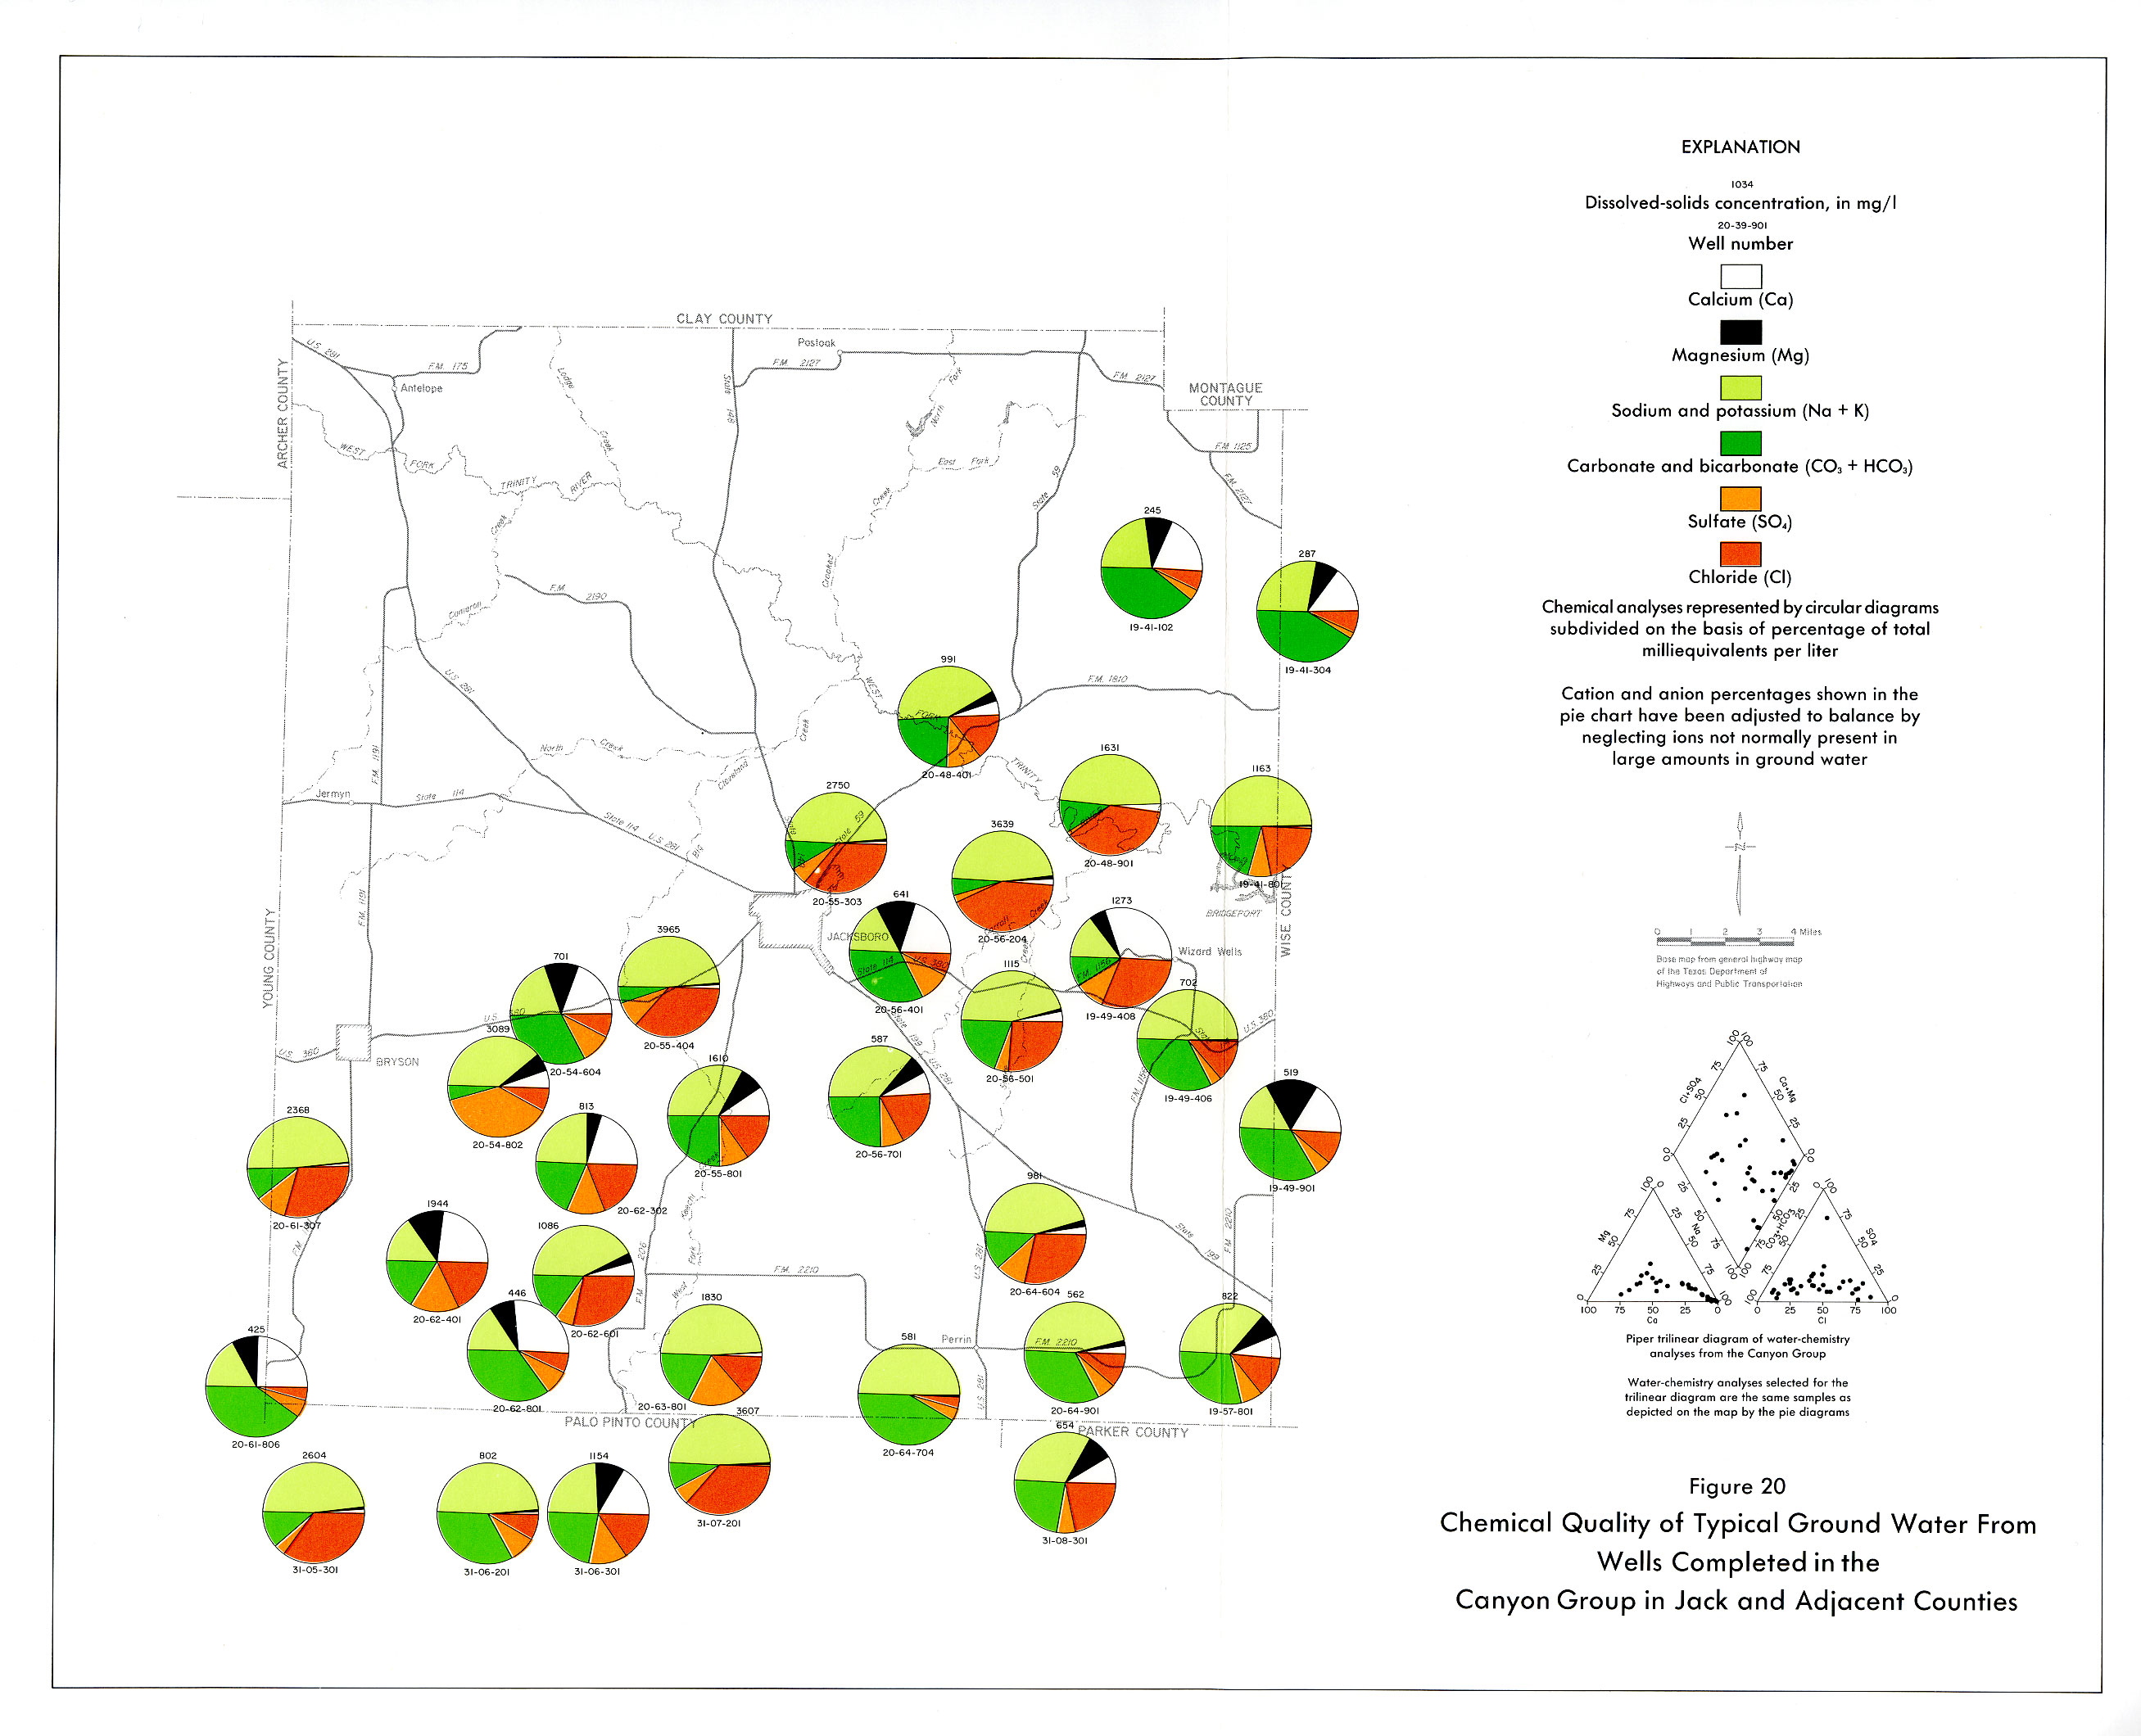
- Figure 20: Chemical Quality of Typical Ground Water from Wells Completed in the Canyon Group in Jack and Adjacent Counties
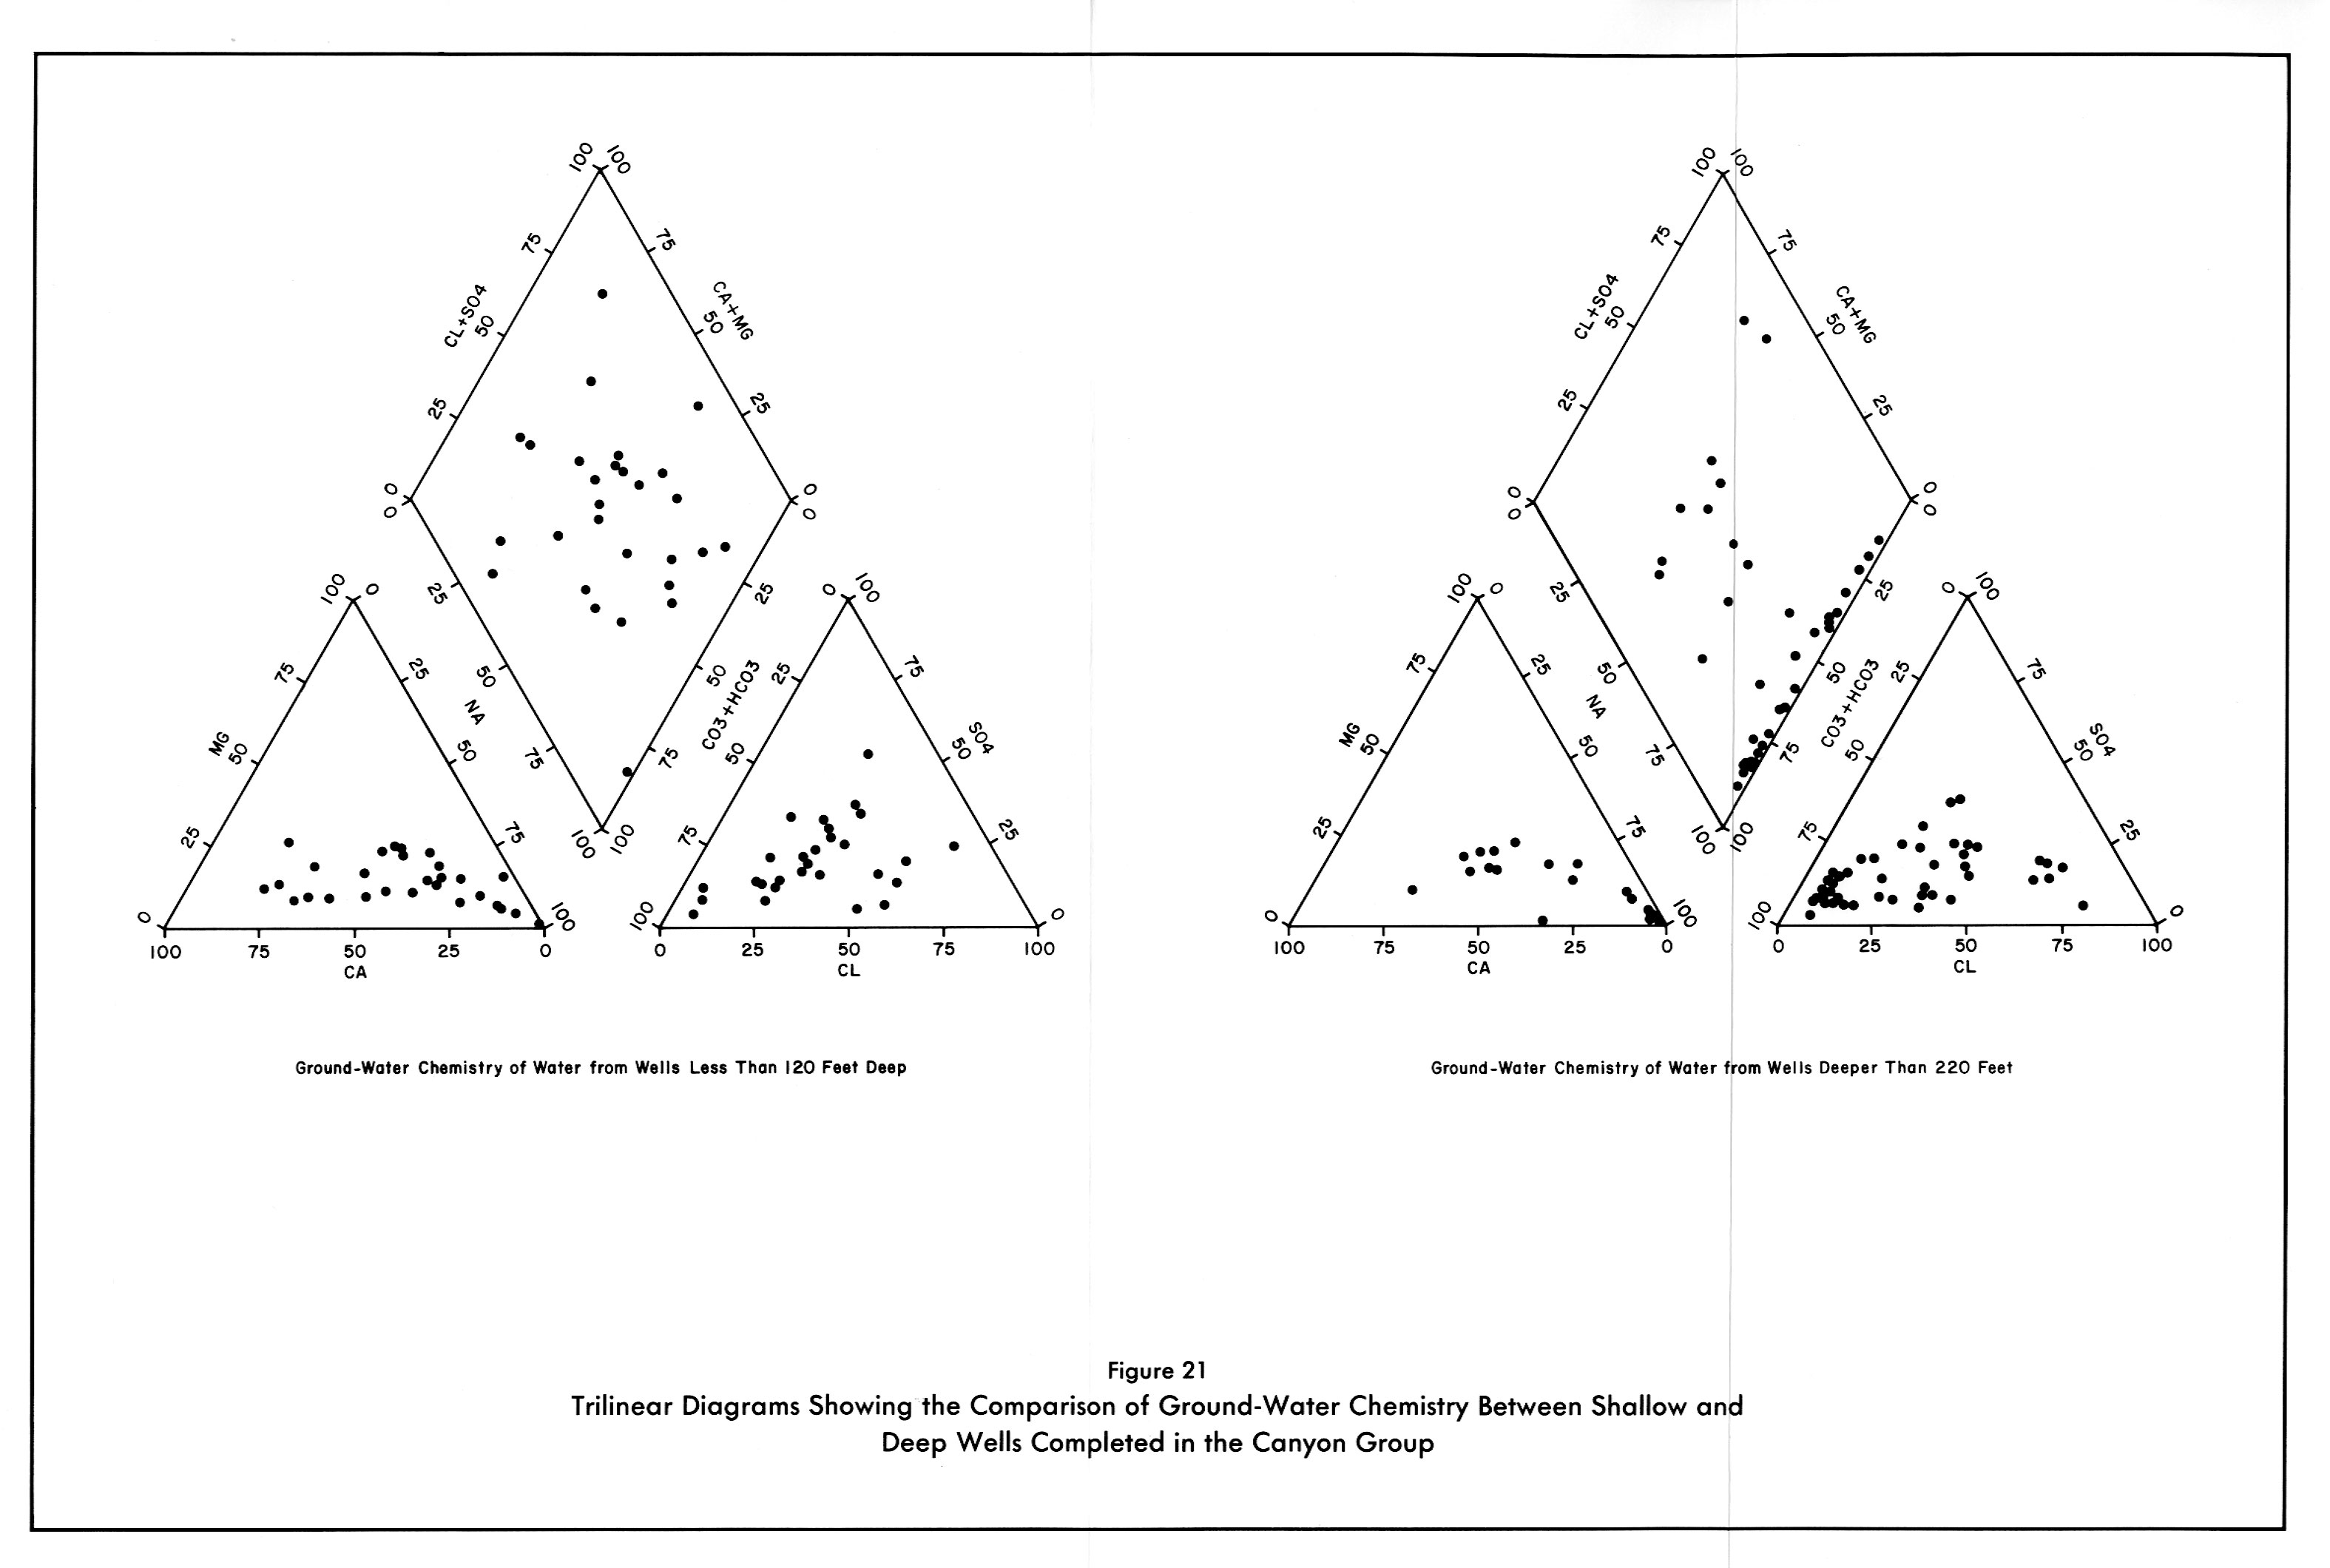
- Figure 21: Trilinear Diagrams Showing the Comparison of Ground-Water Chemistry Between Shallow and Deep Wells Completed in the Canyon Group
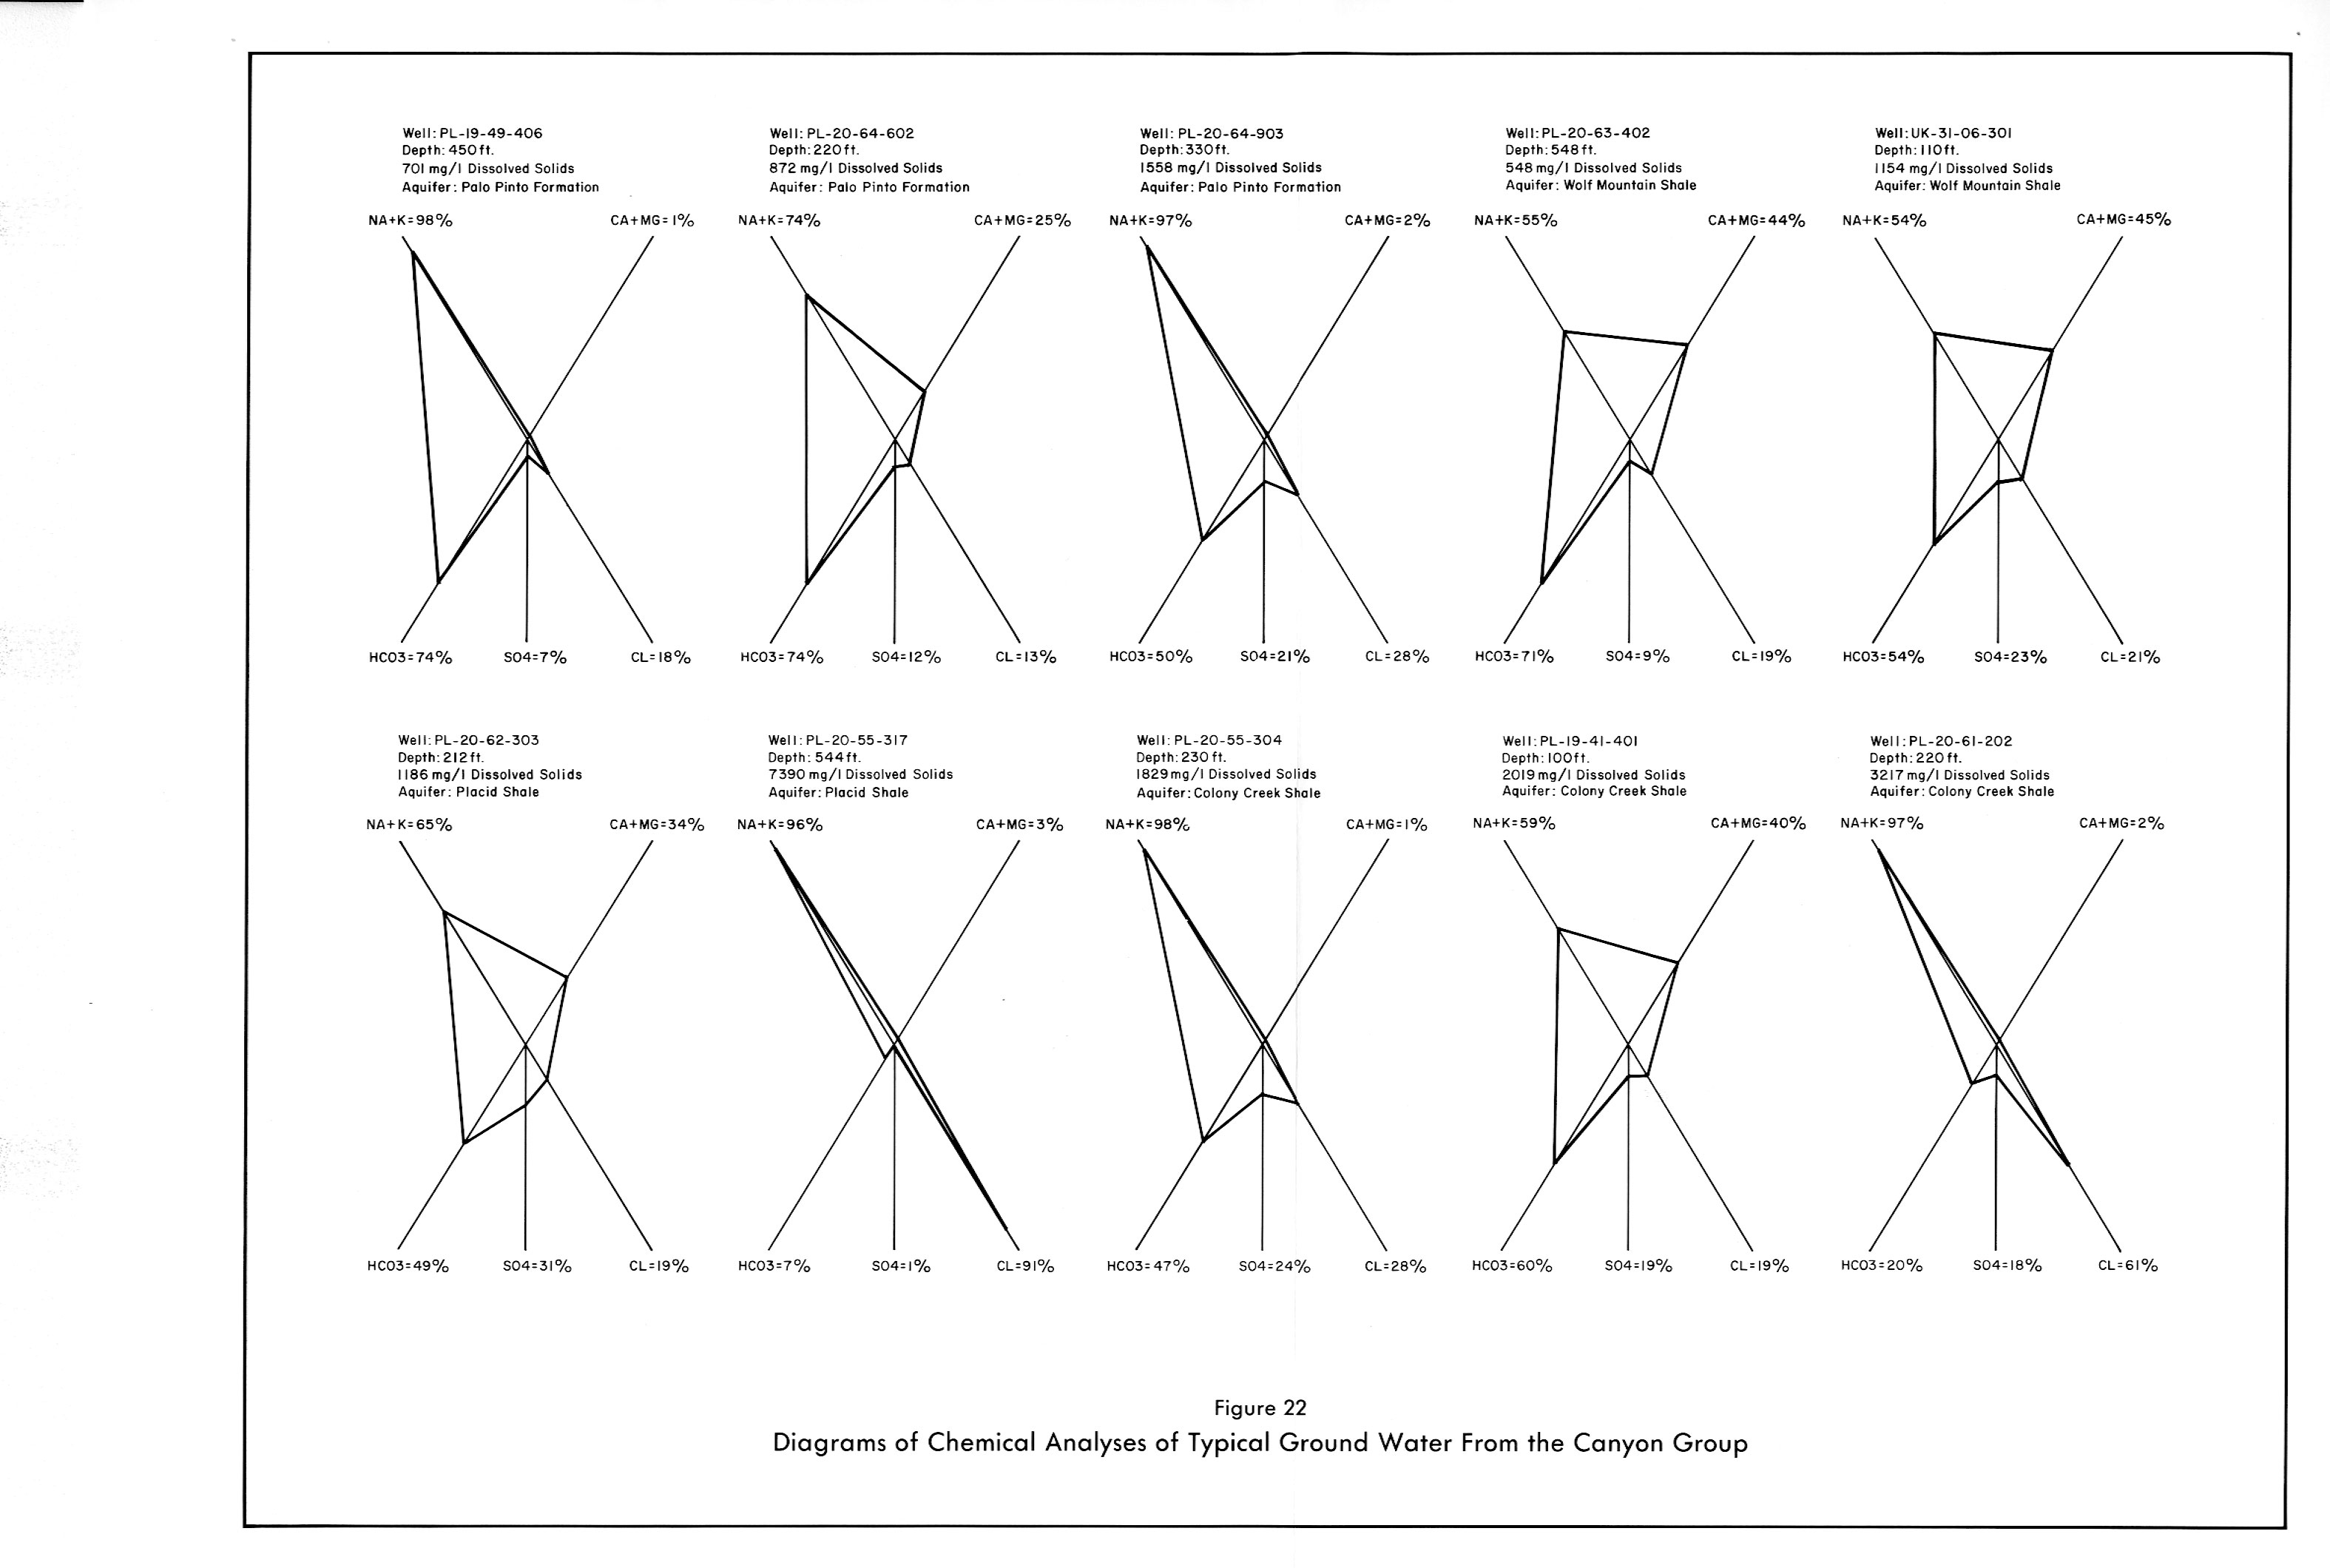
- Figure 22: Diagrams of Chemical Analyses of Typical Ground Water from the Canyon Group
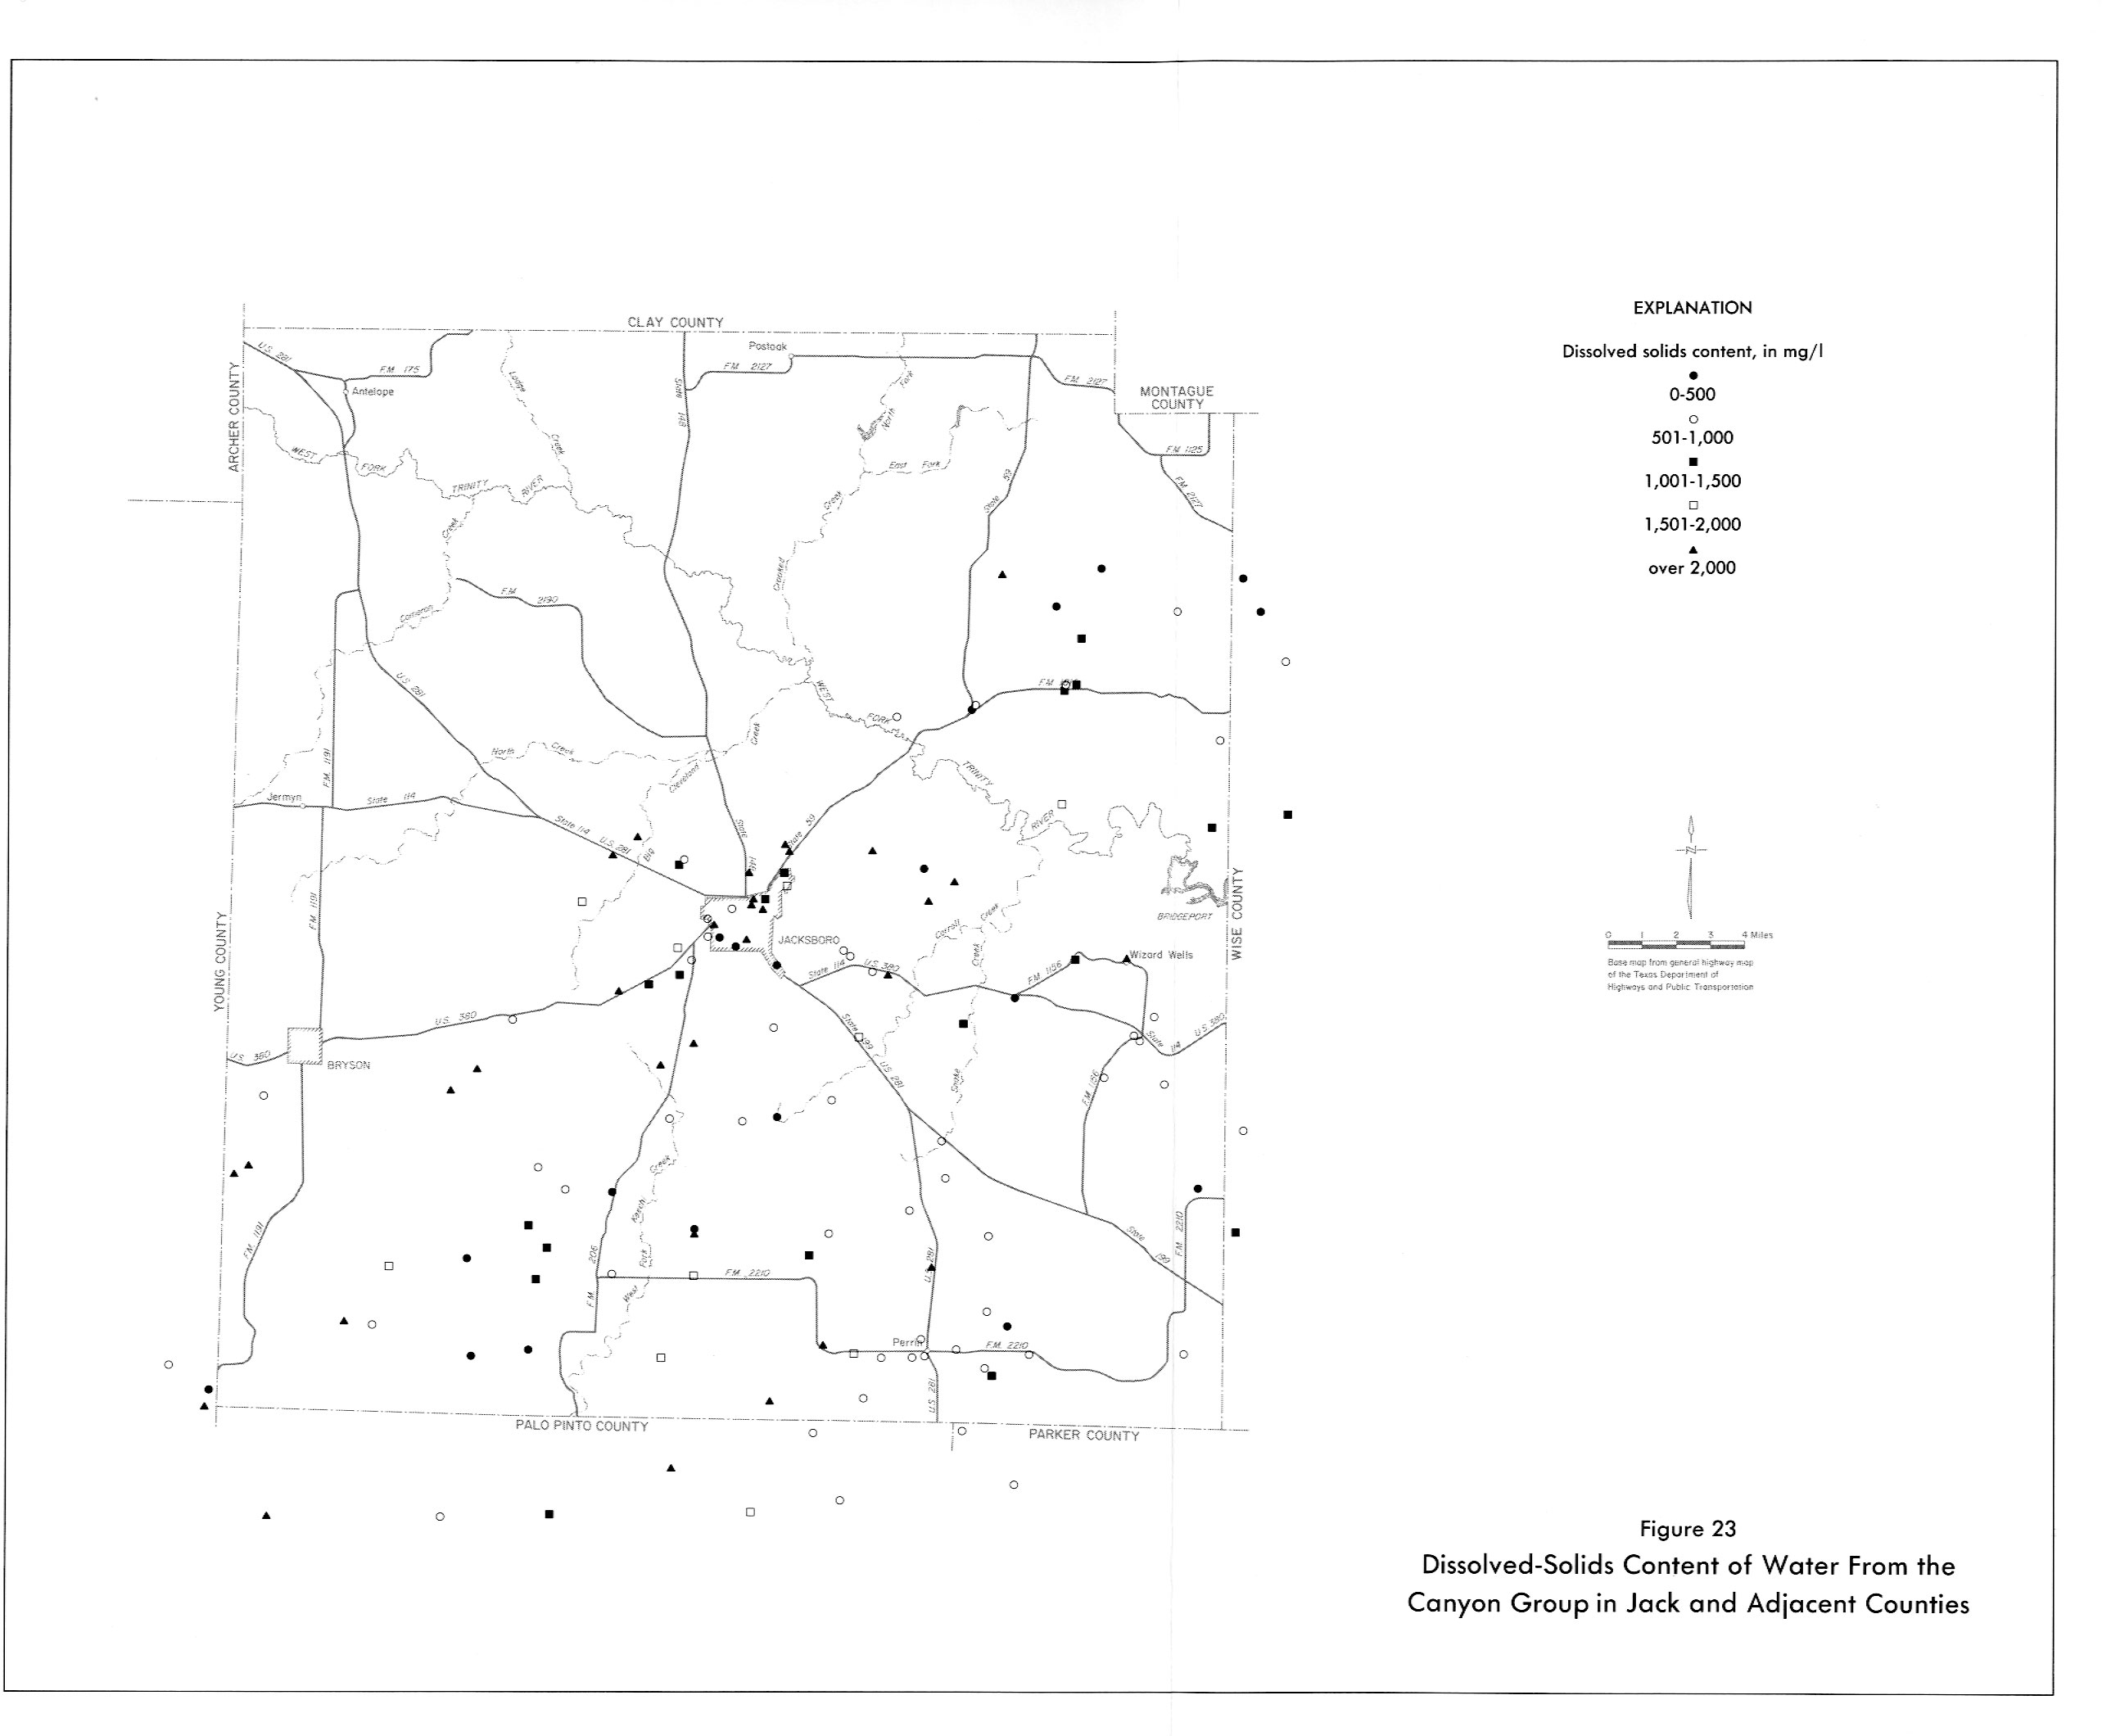
- Figure 23: Dissolved-Solids Content of Water from the Canyon Group in Jack and Adjacent Counties
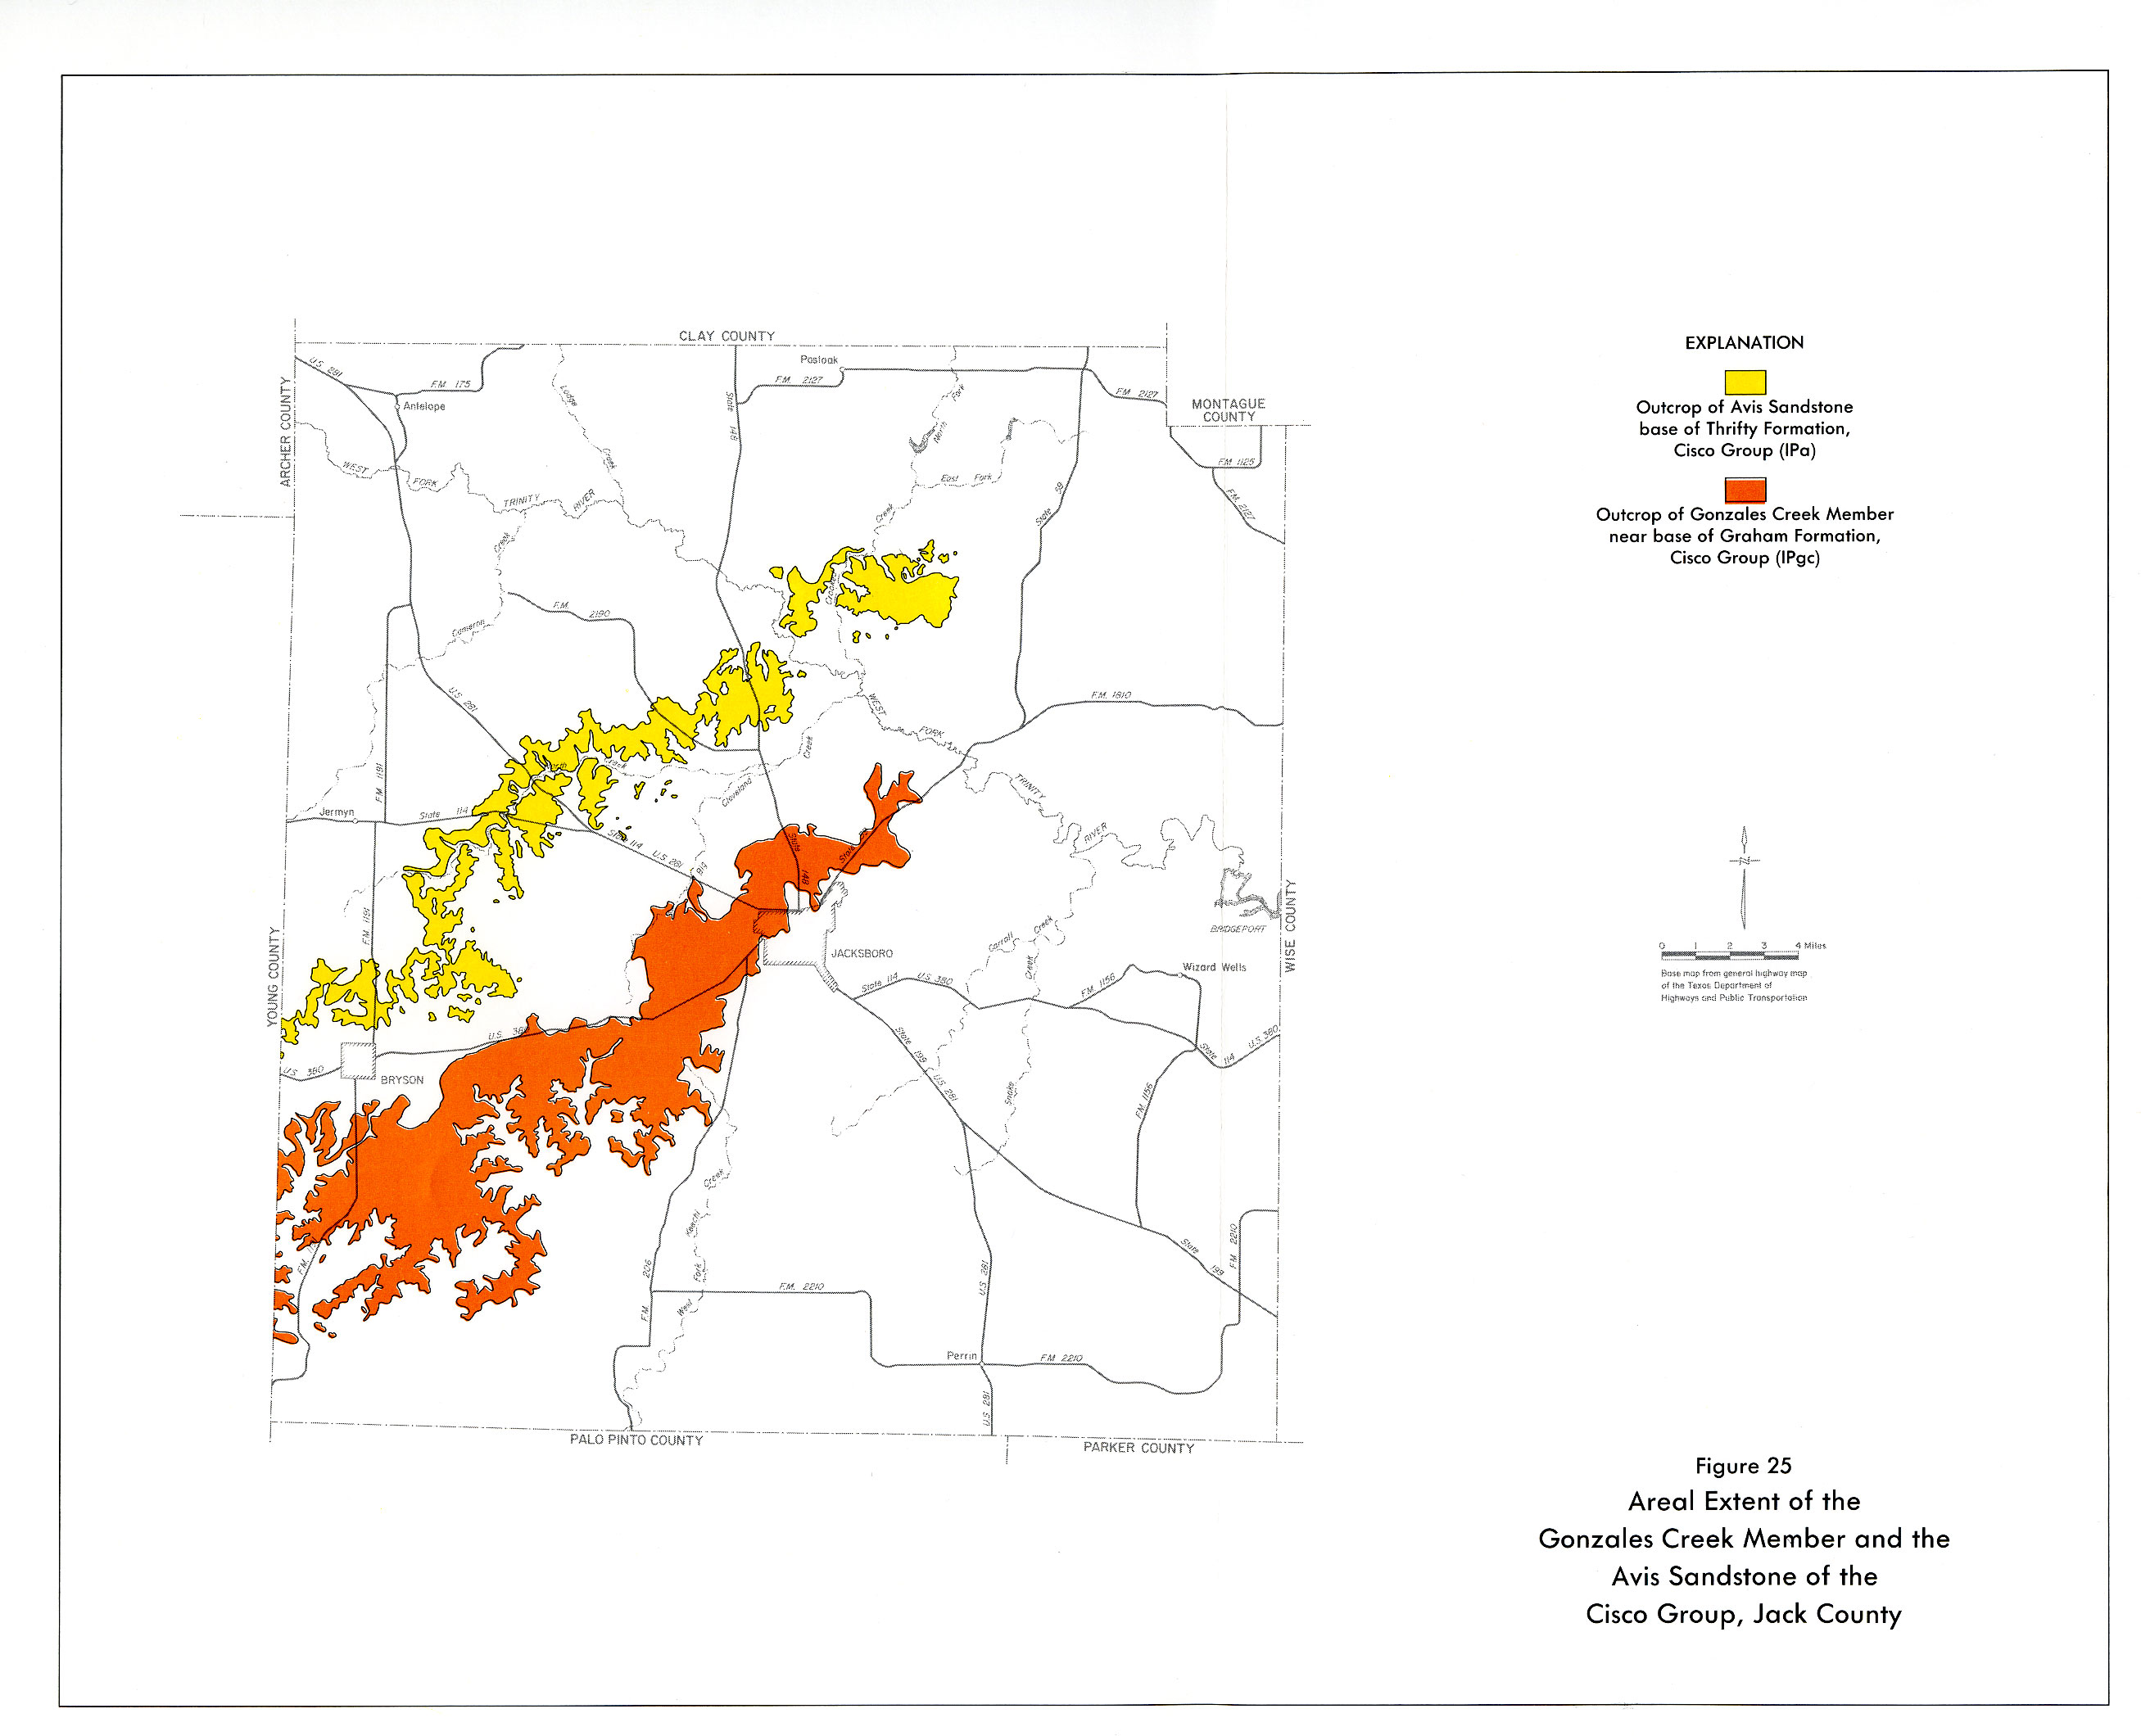
- Figure 25: Areal Extent of the Gonzales creek Member and the Avis Sandstone of the Cisco Group, Jack County
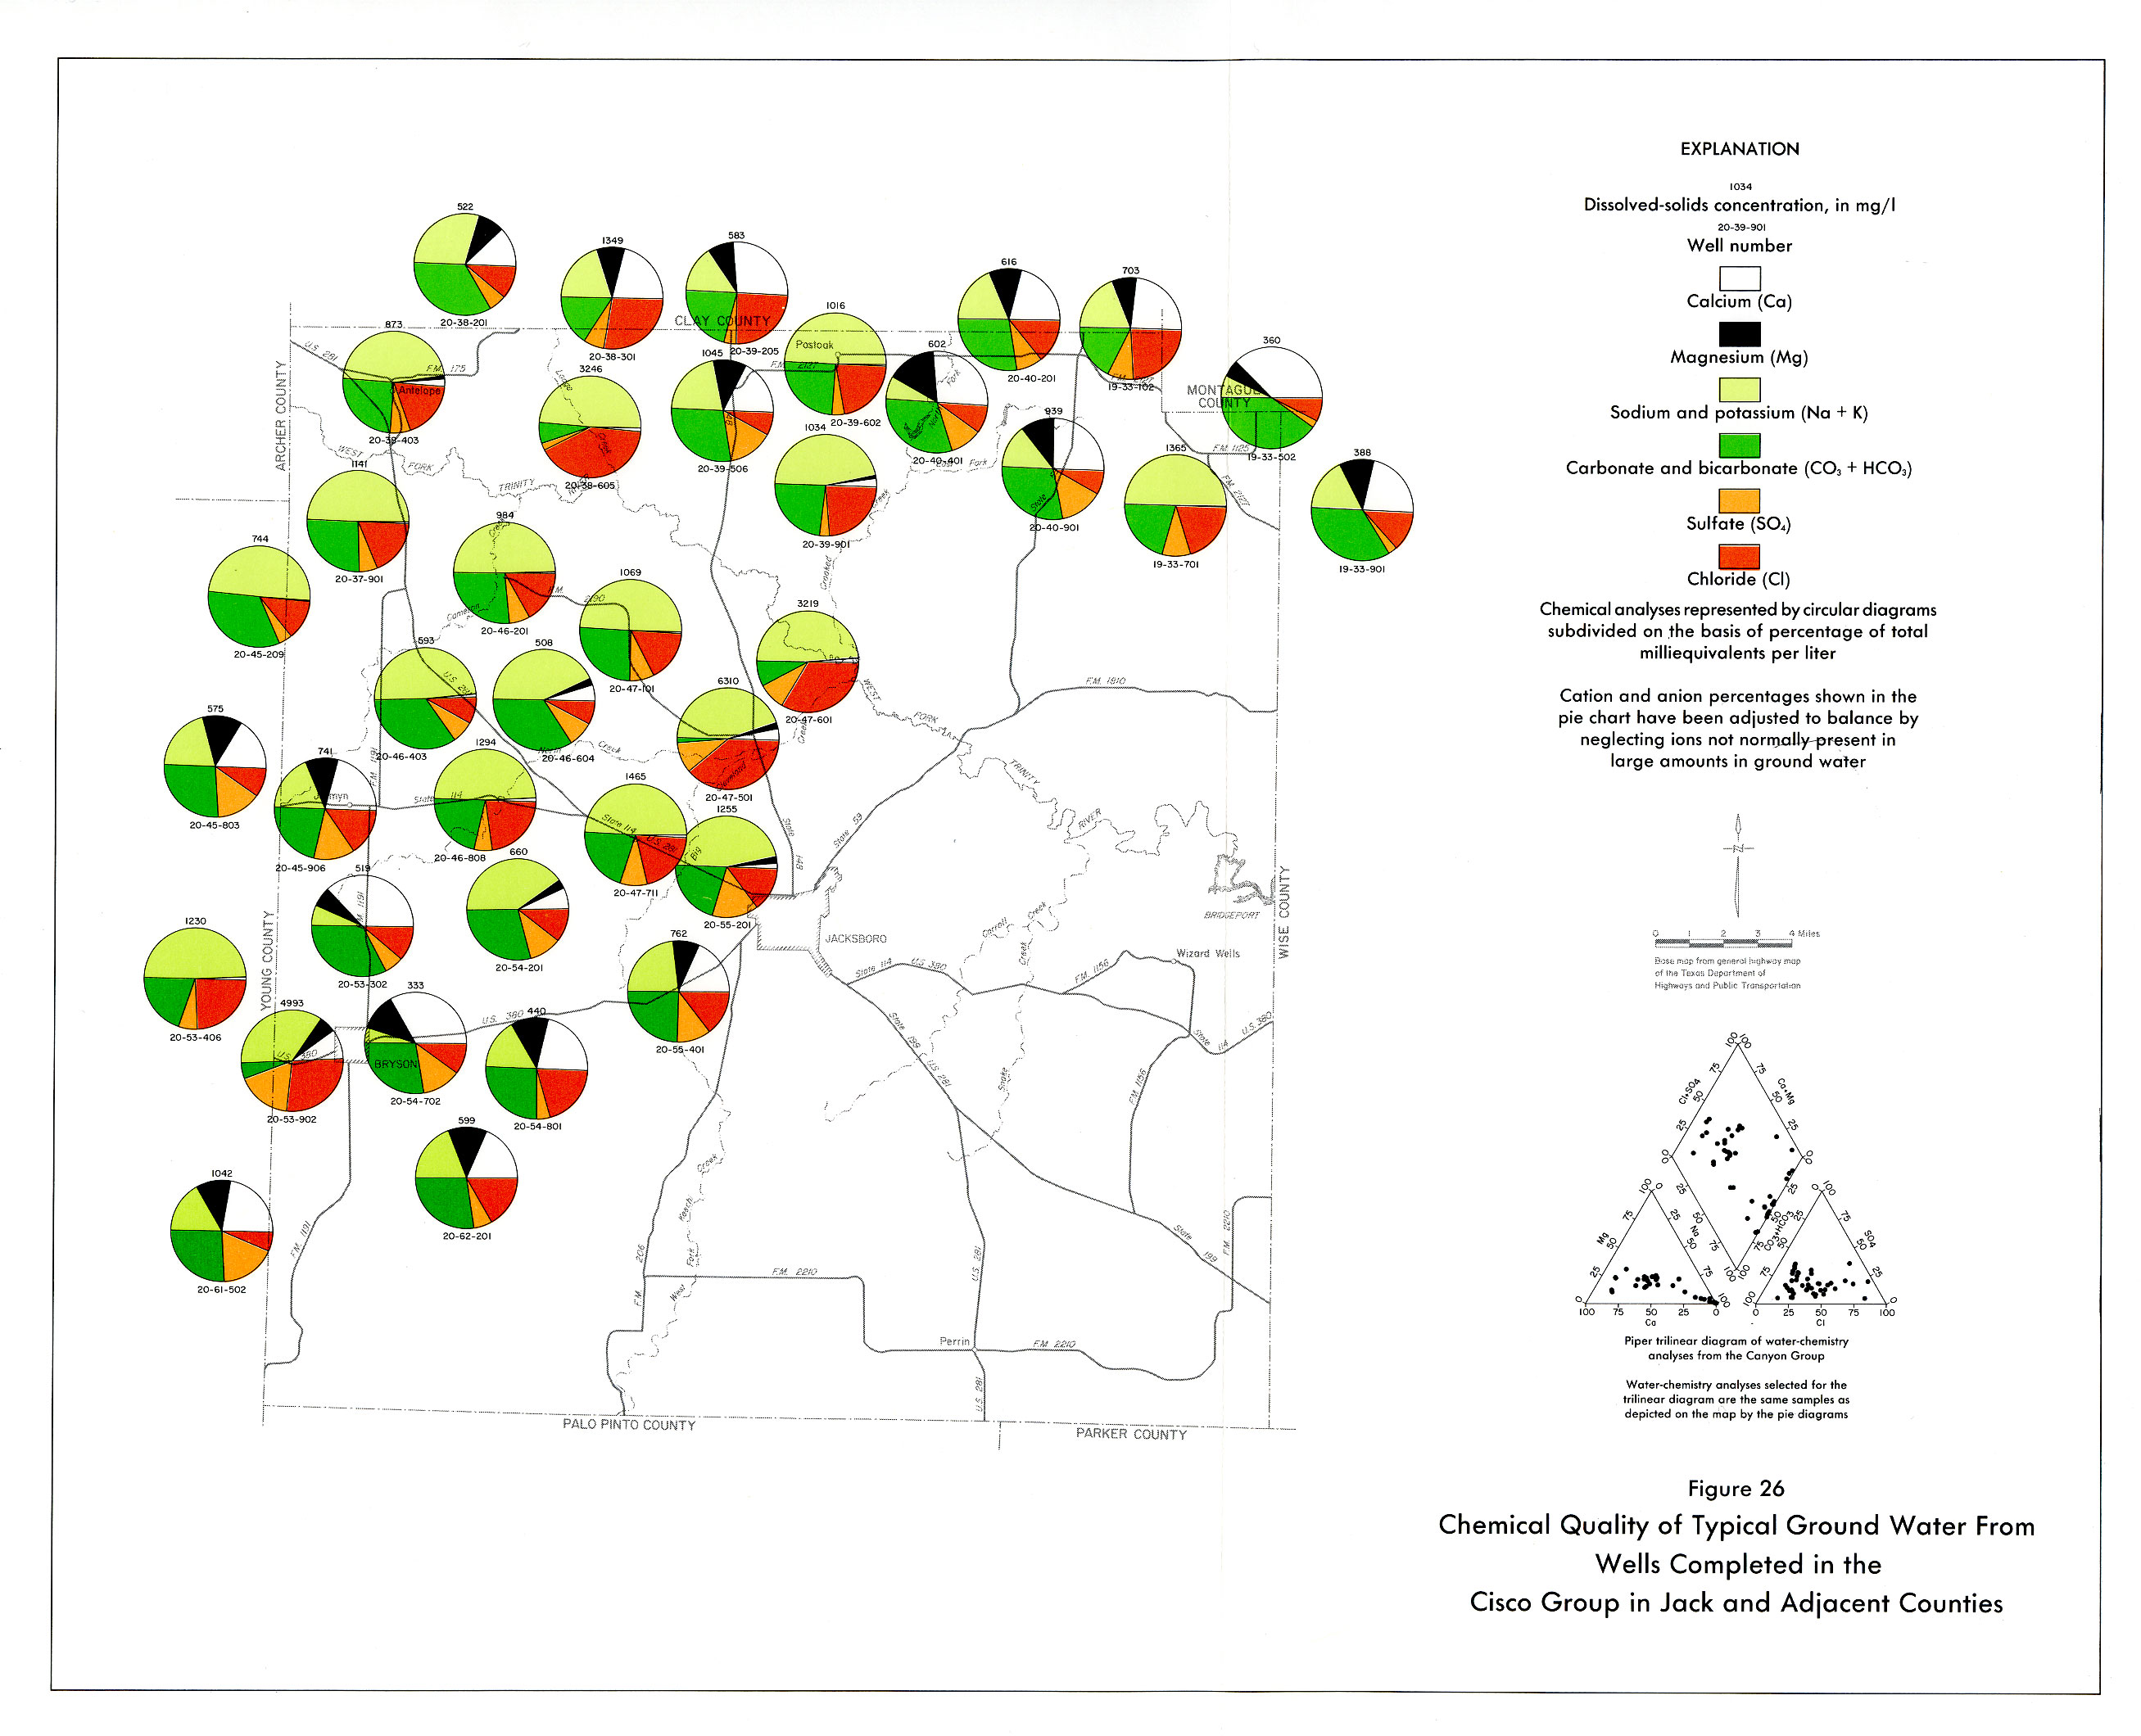
- Figure 26: Chemical Quality of Typical Ground Water from Wells Completed in the Cisco Group in Jack and Adjacent Counties
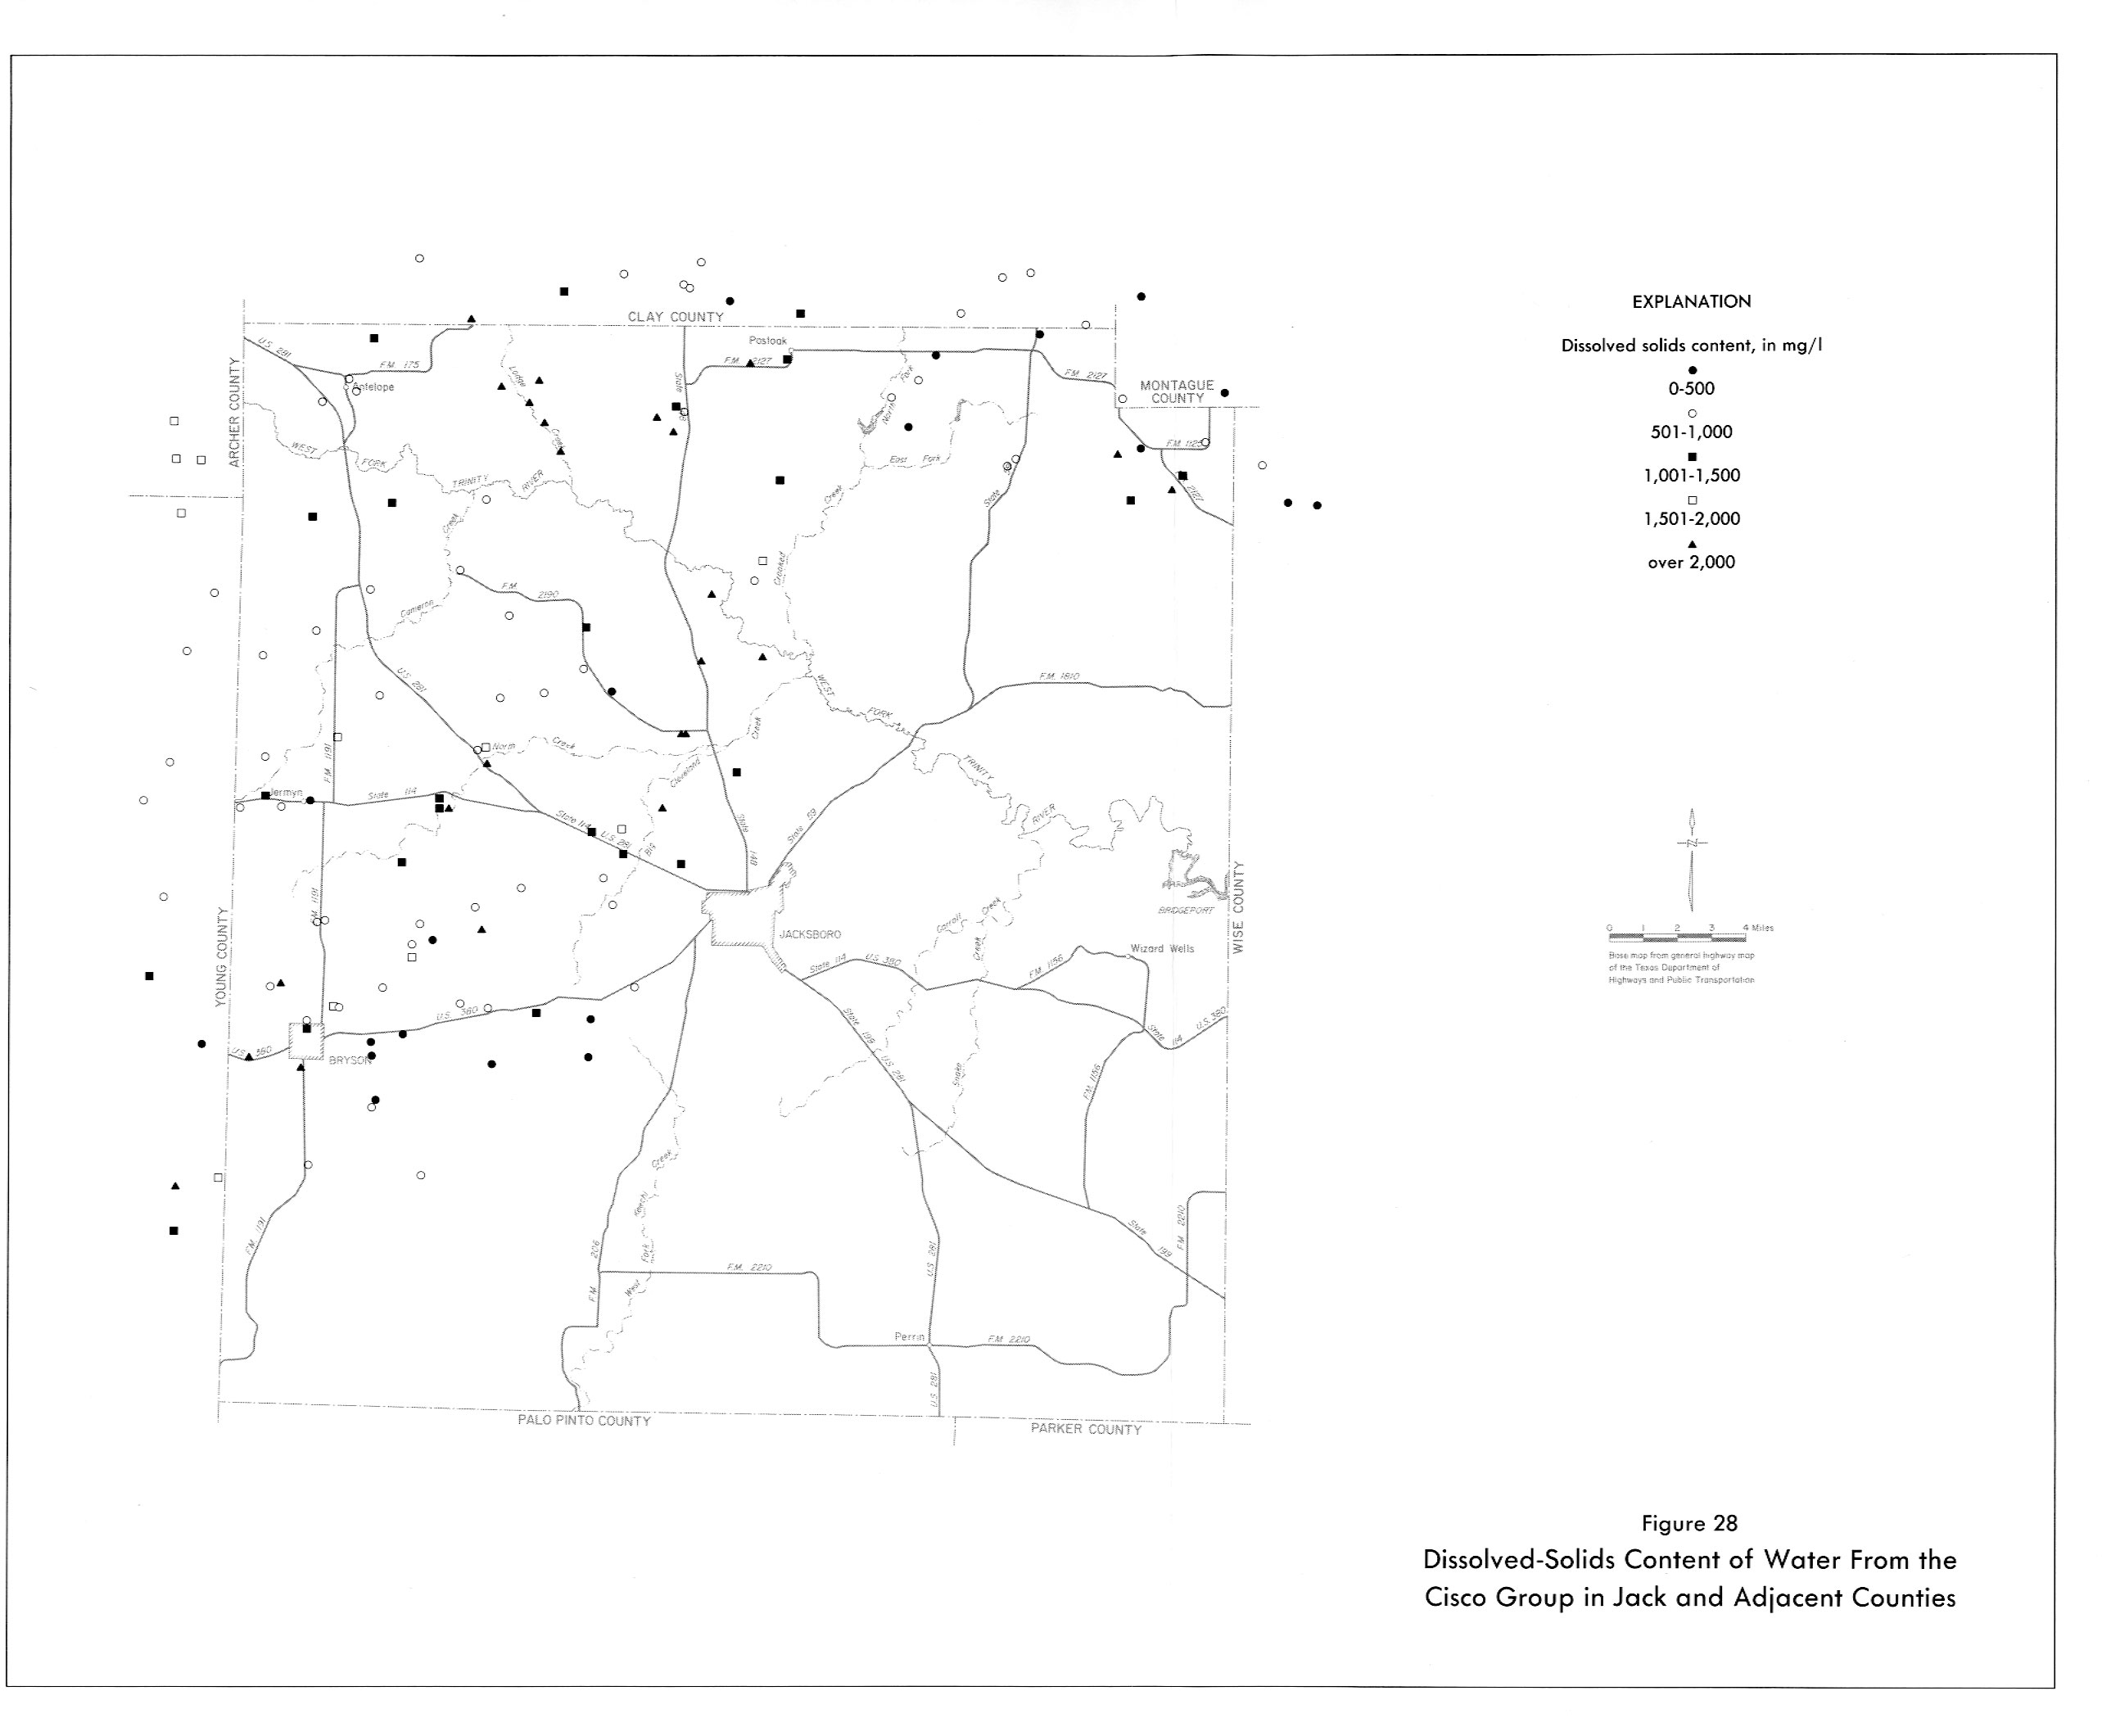
- Figure 28: Dissolved-Solids Content of Water from the Cisco Group in Jack and Adjacent Counties
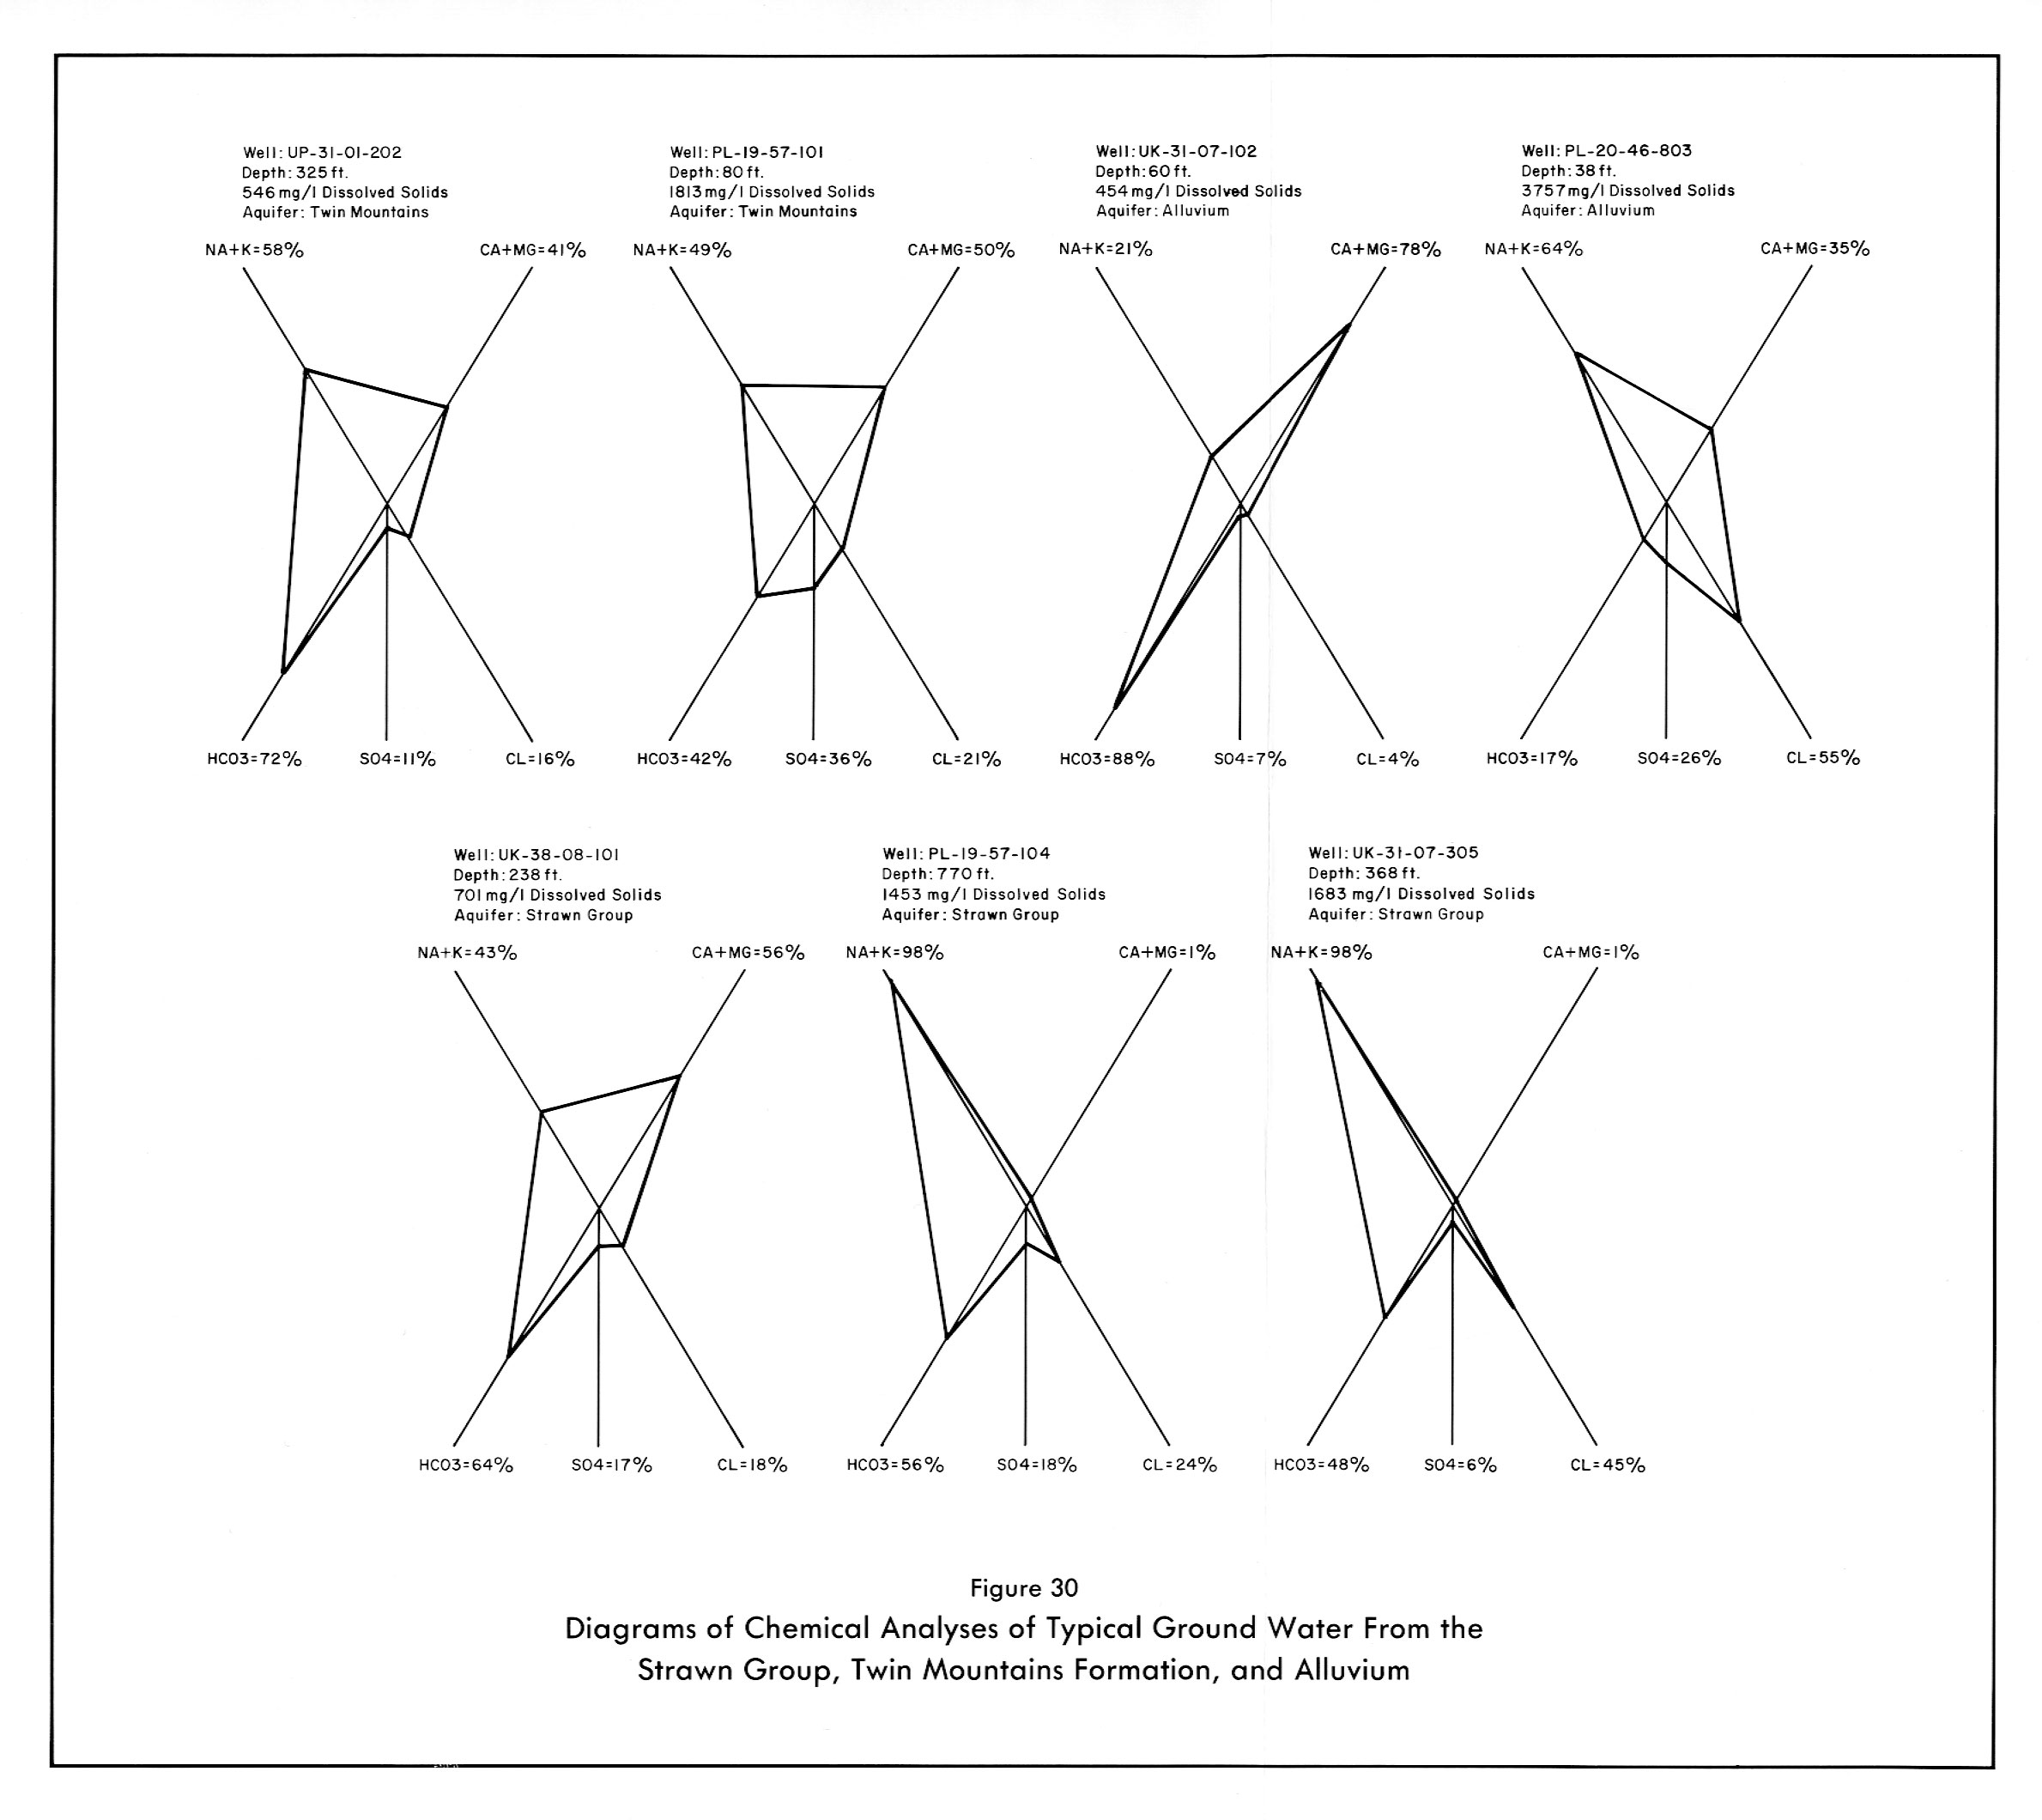
- Figure 30: Diagrams of Chemical Analyses of Typical Ground Water from the Strawn Group, Twin Mountains Formation, and Alluvium
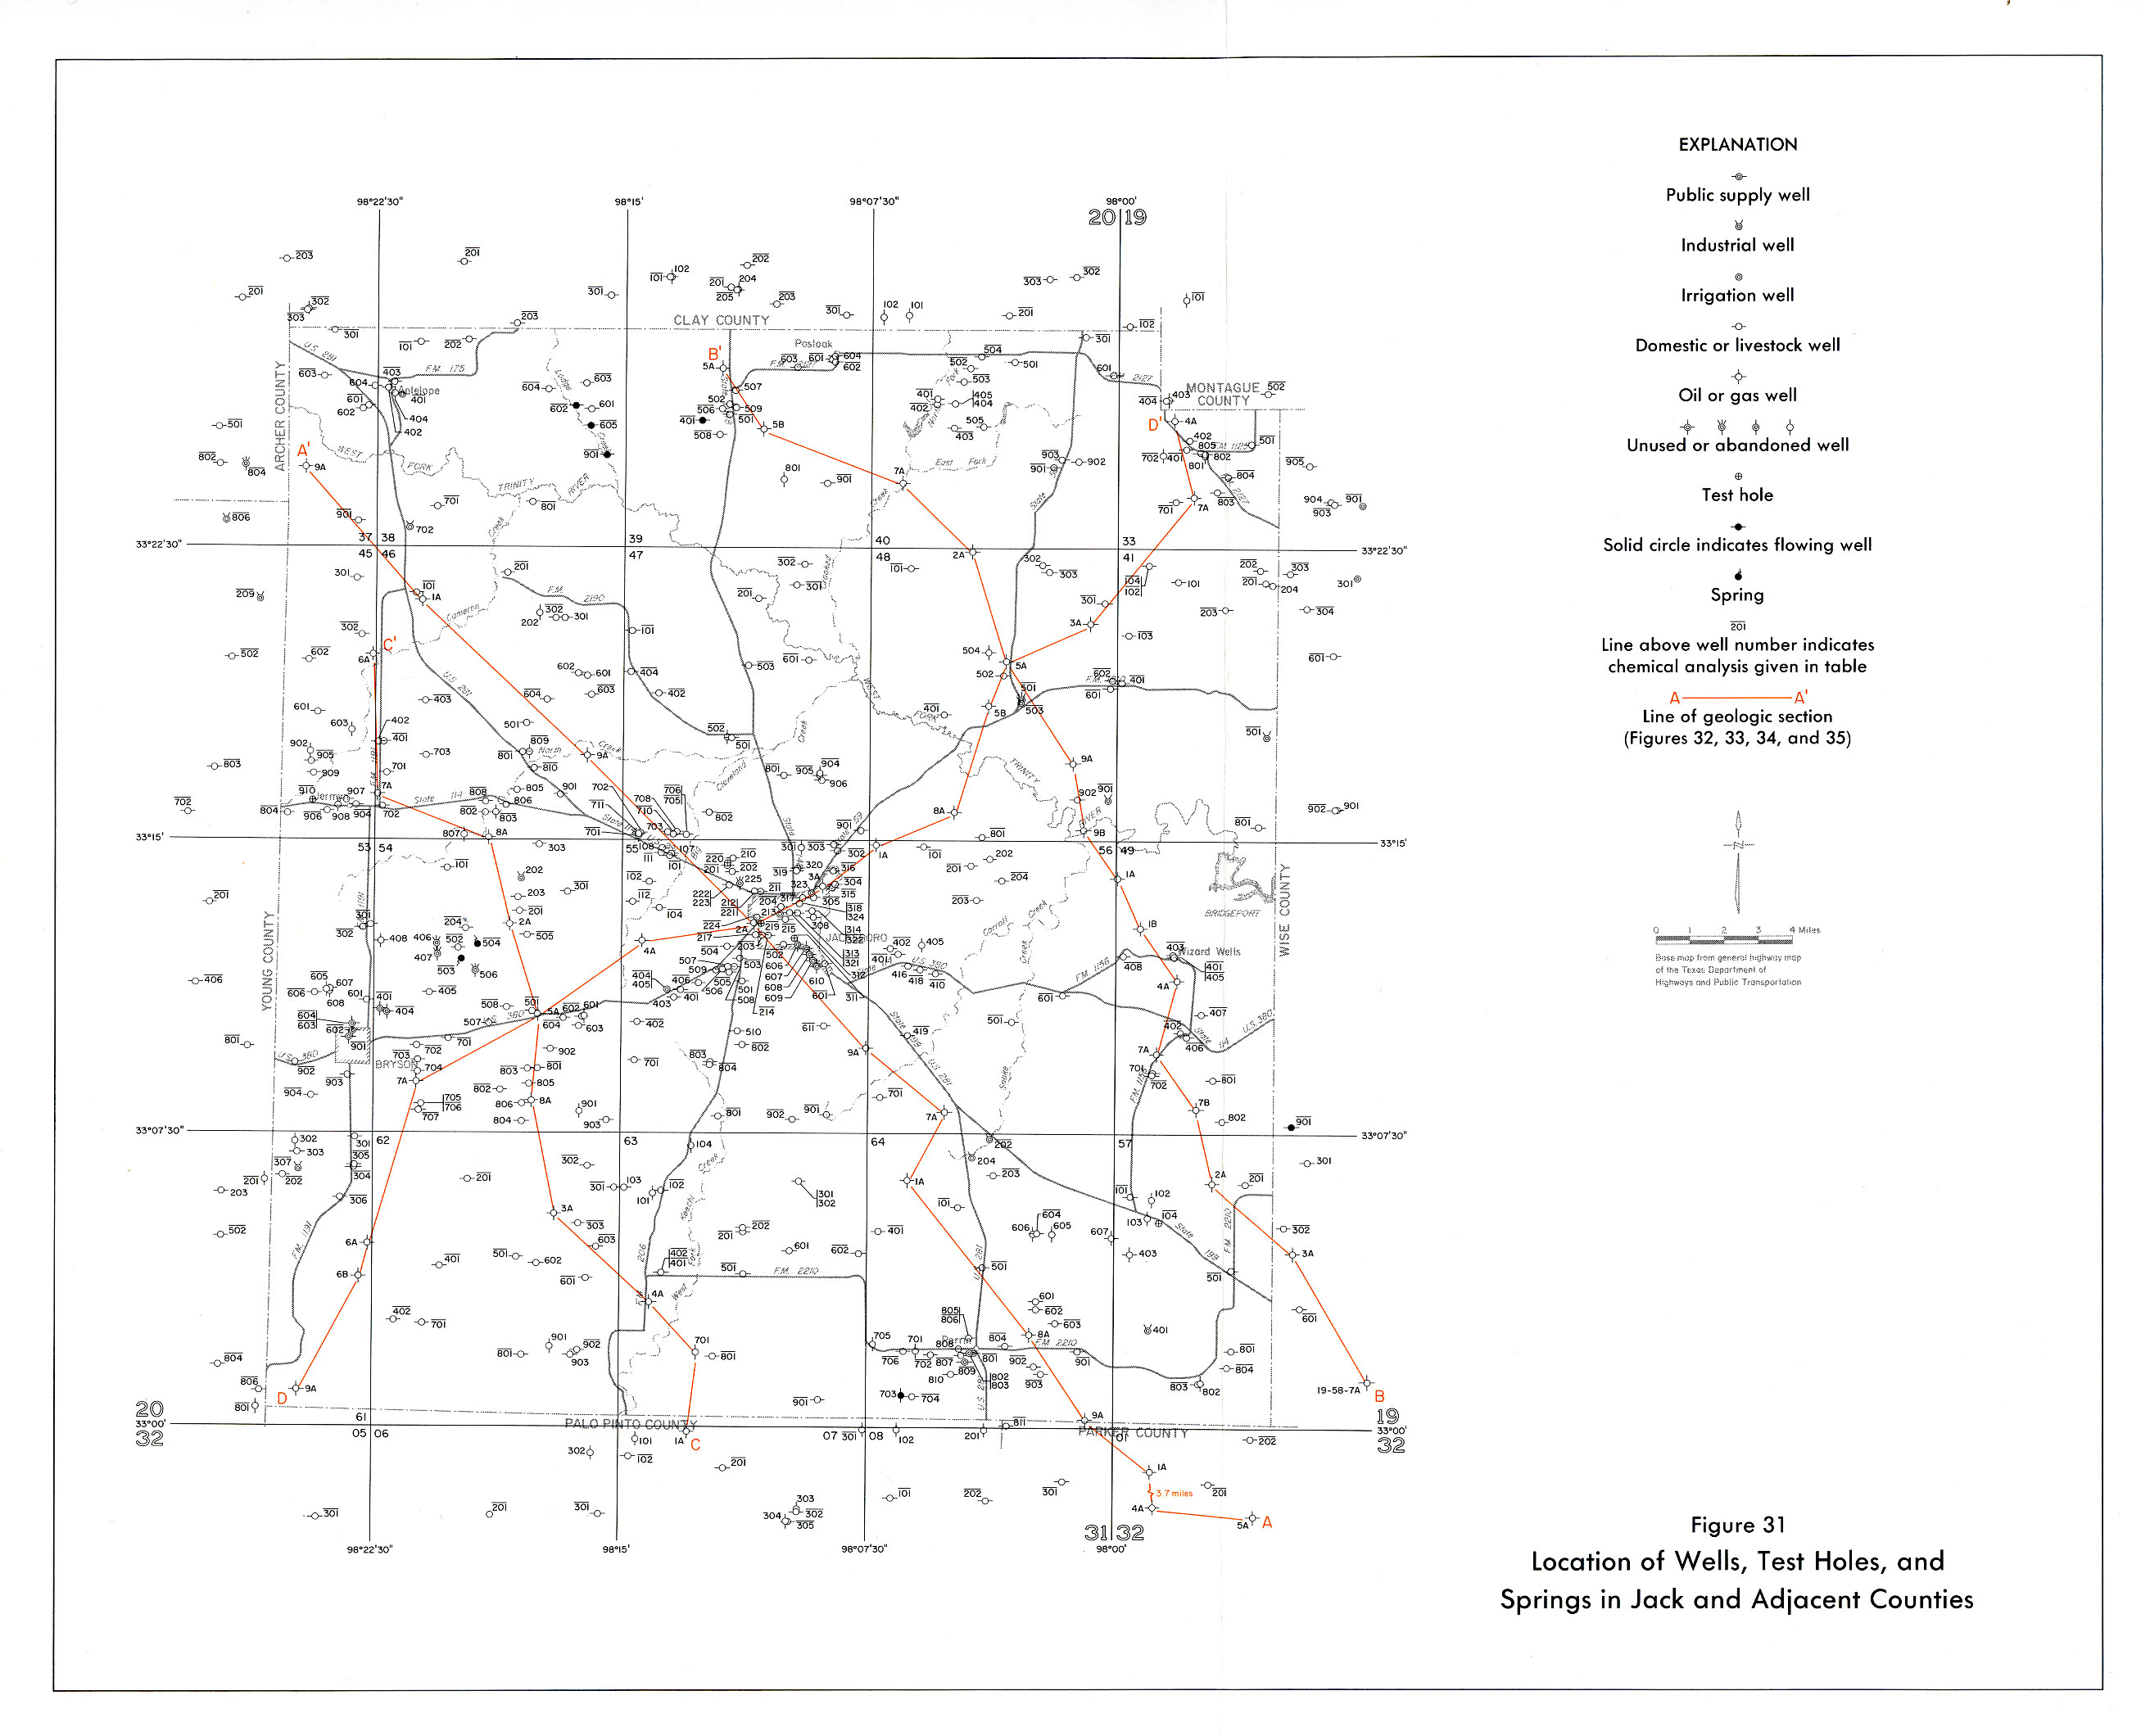
- Figure 31: Location of Wells, Test Holes, and Springs in Jack and Adjacent Counties
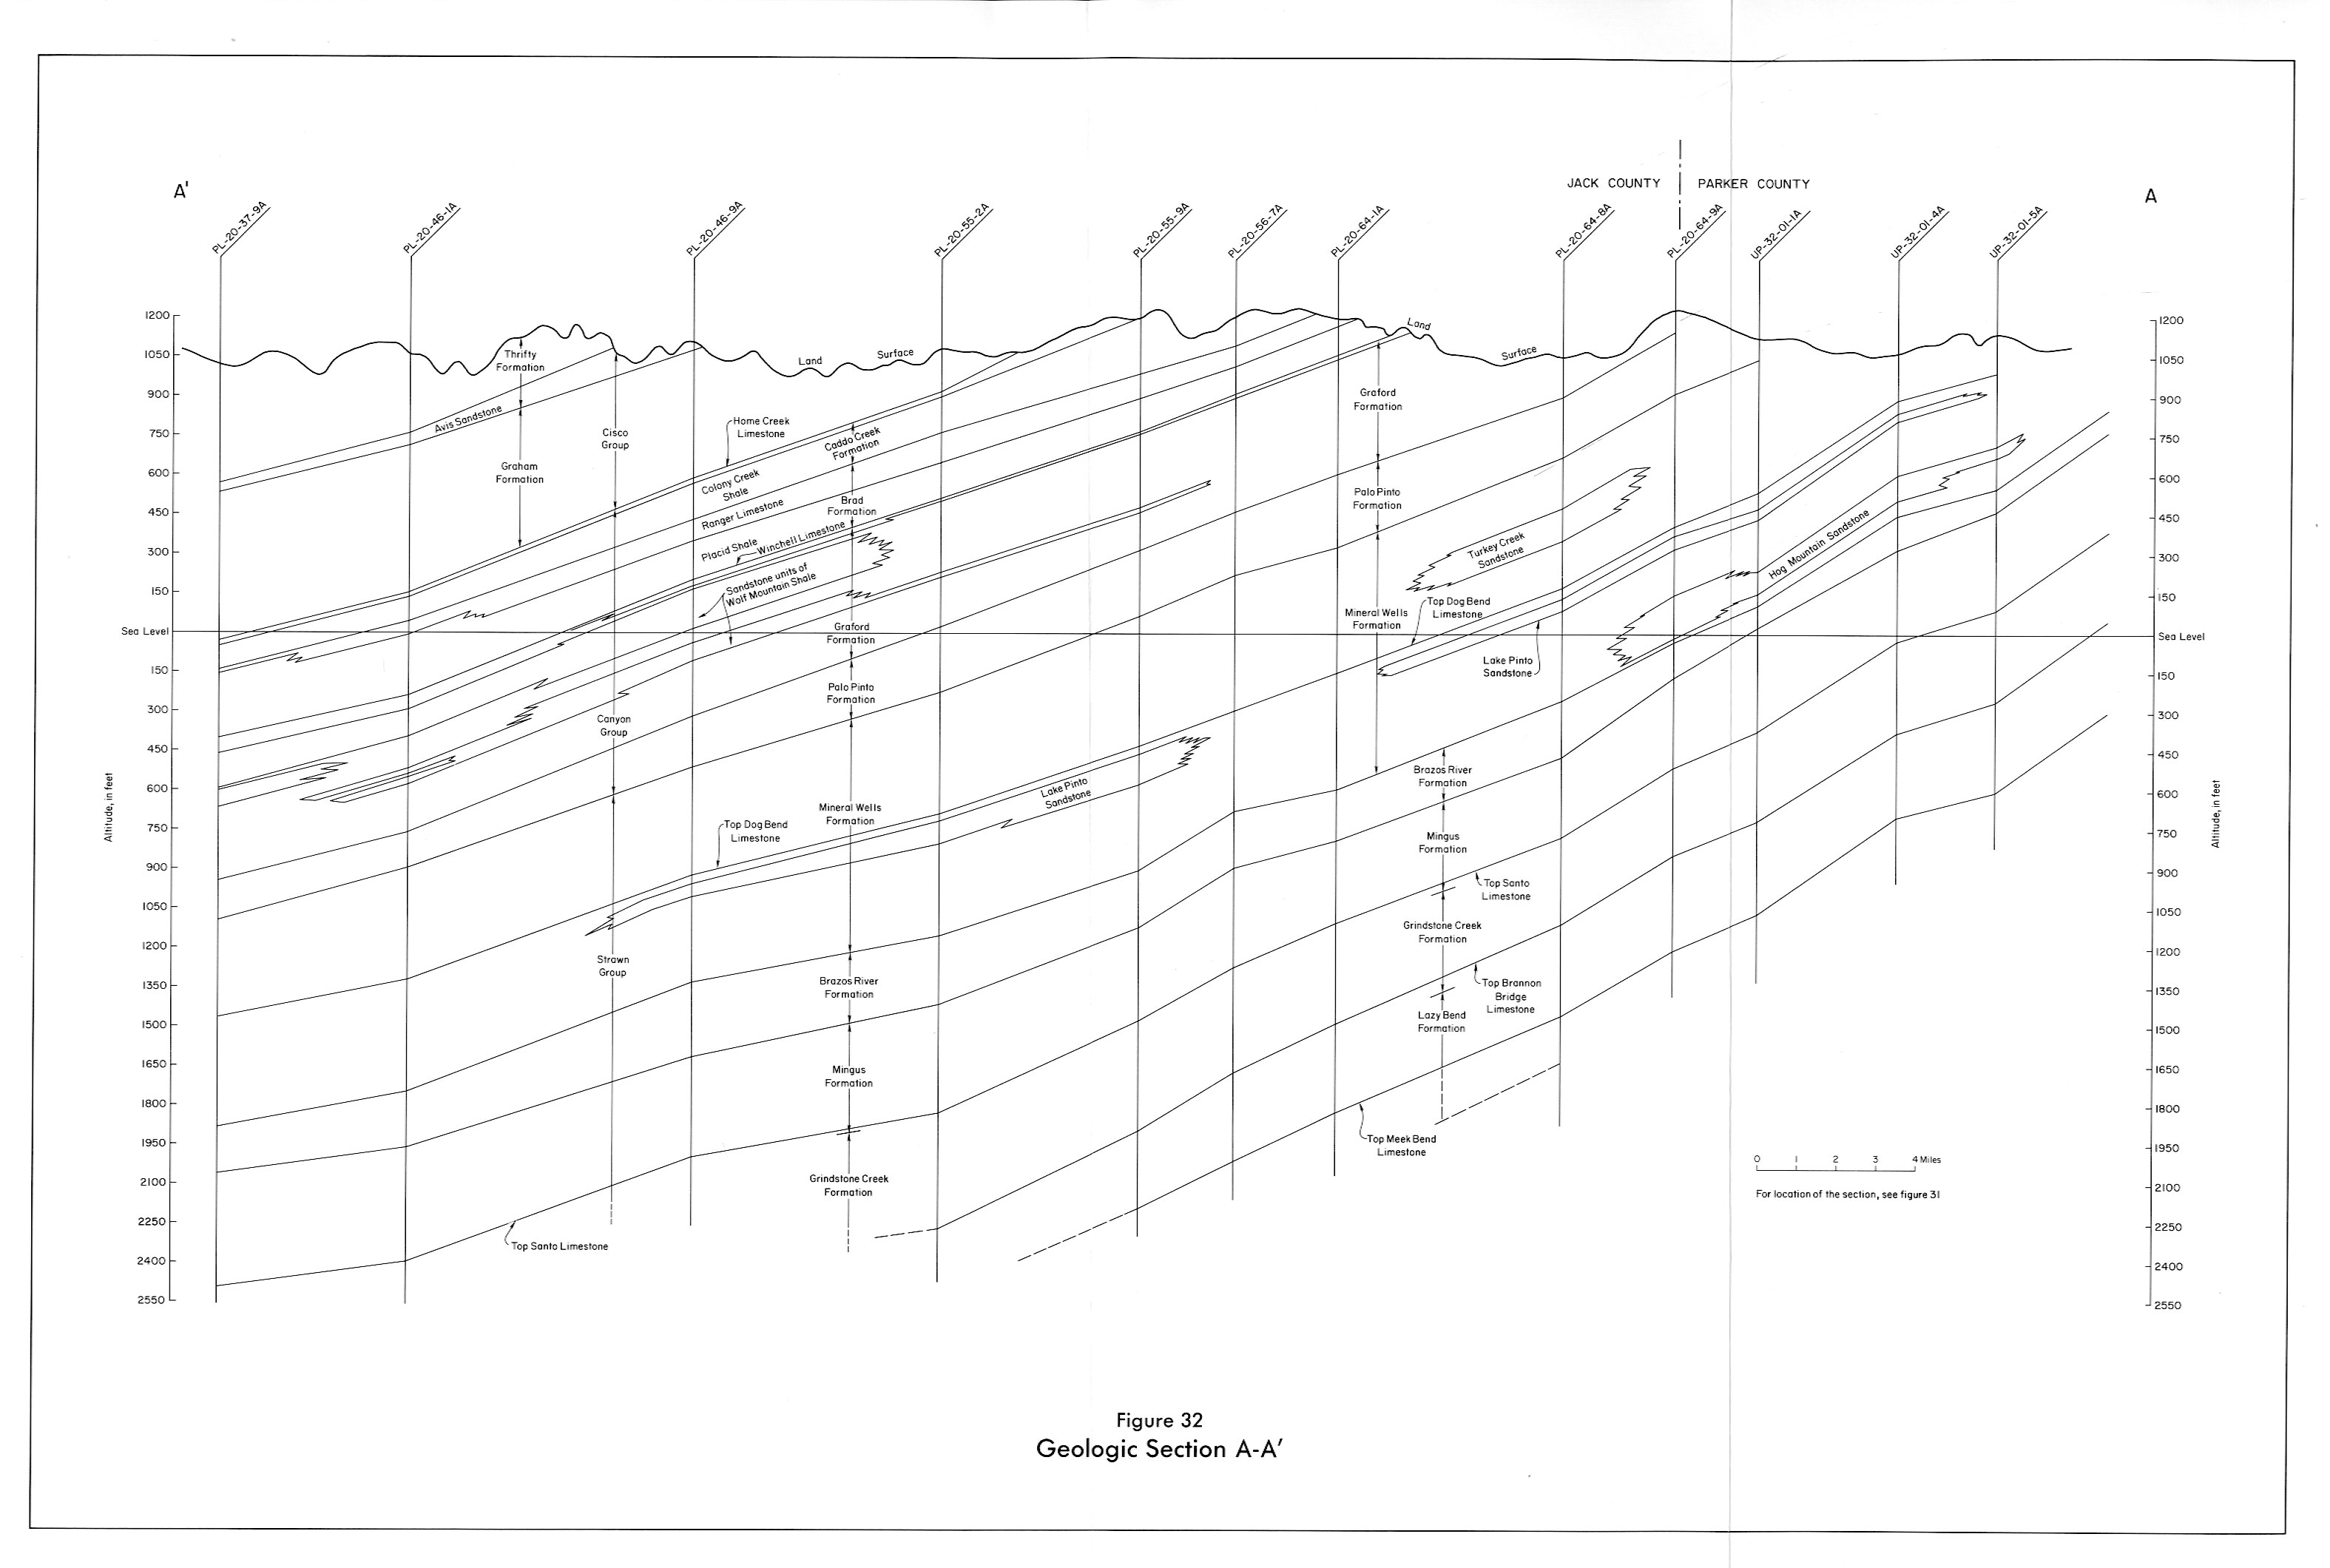
- Figure 32: Geologic section A-A'
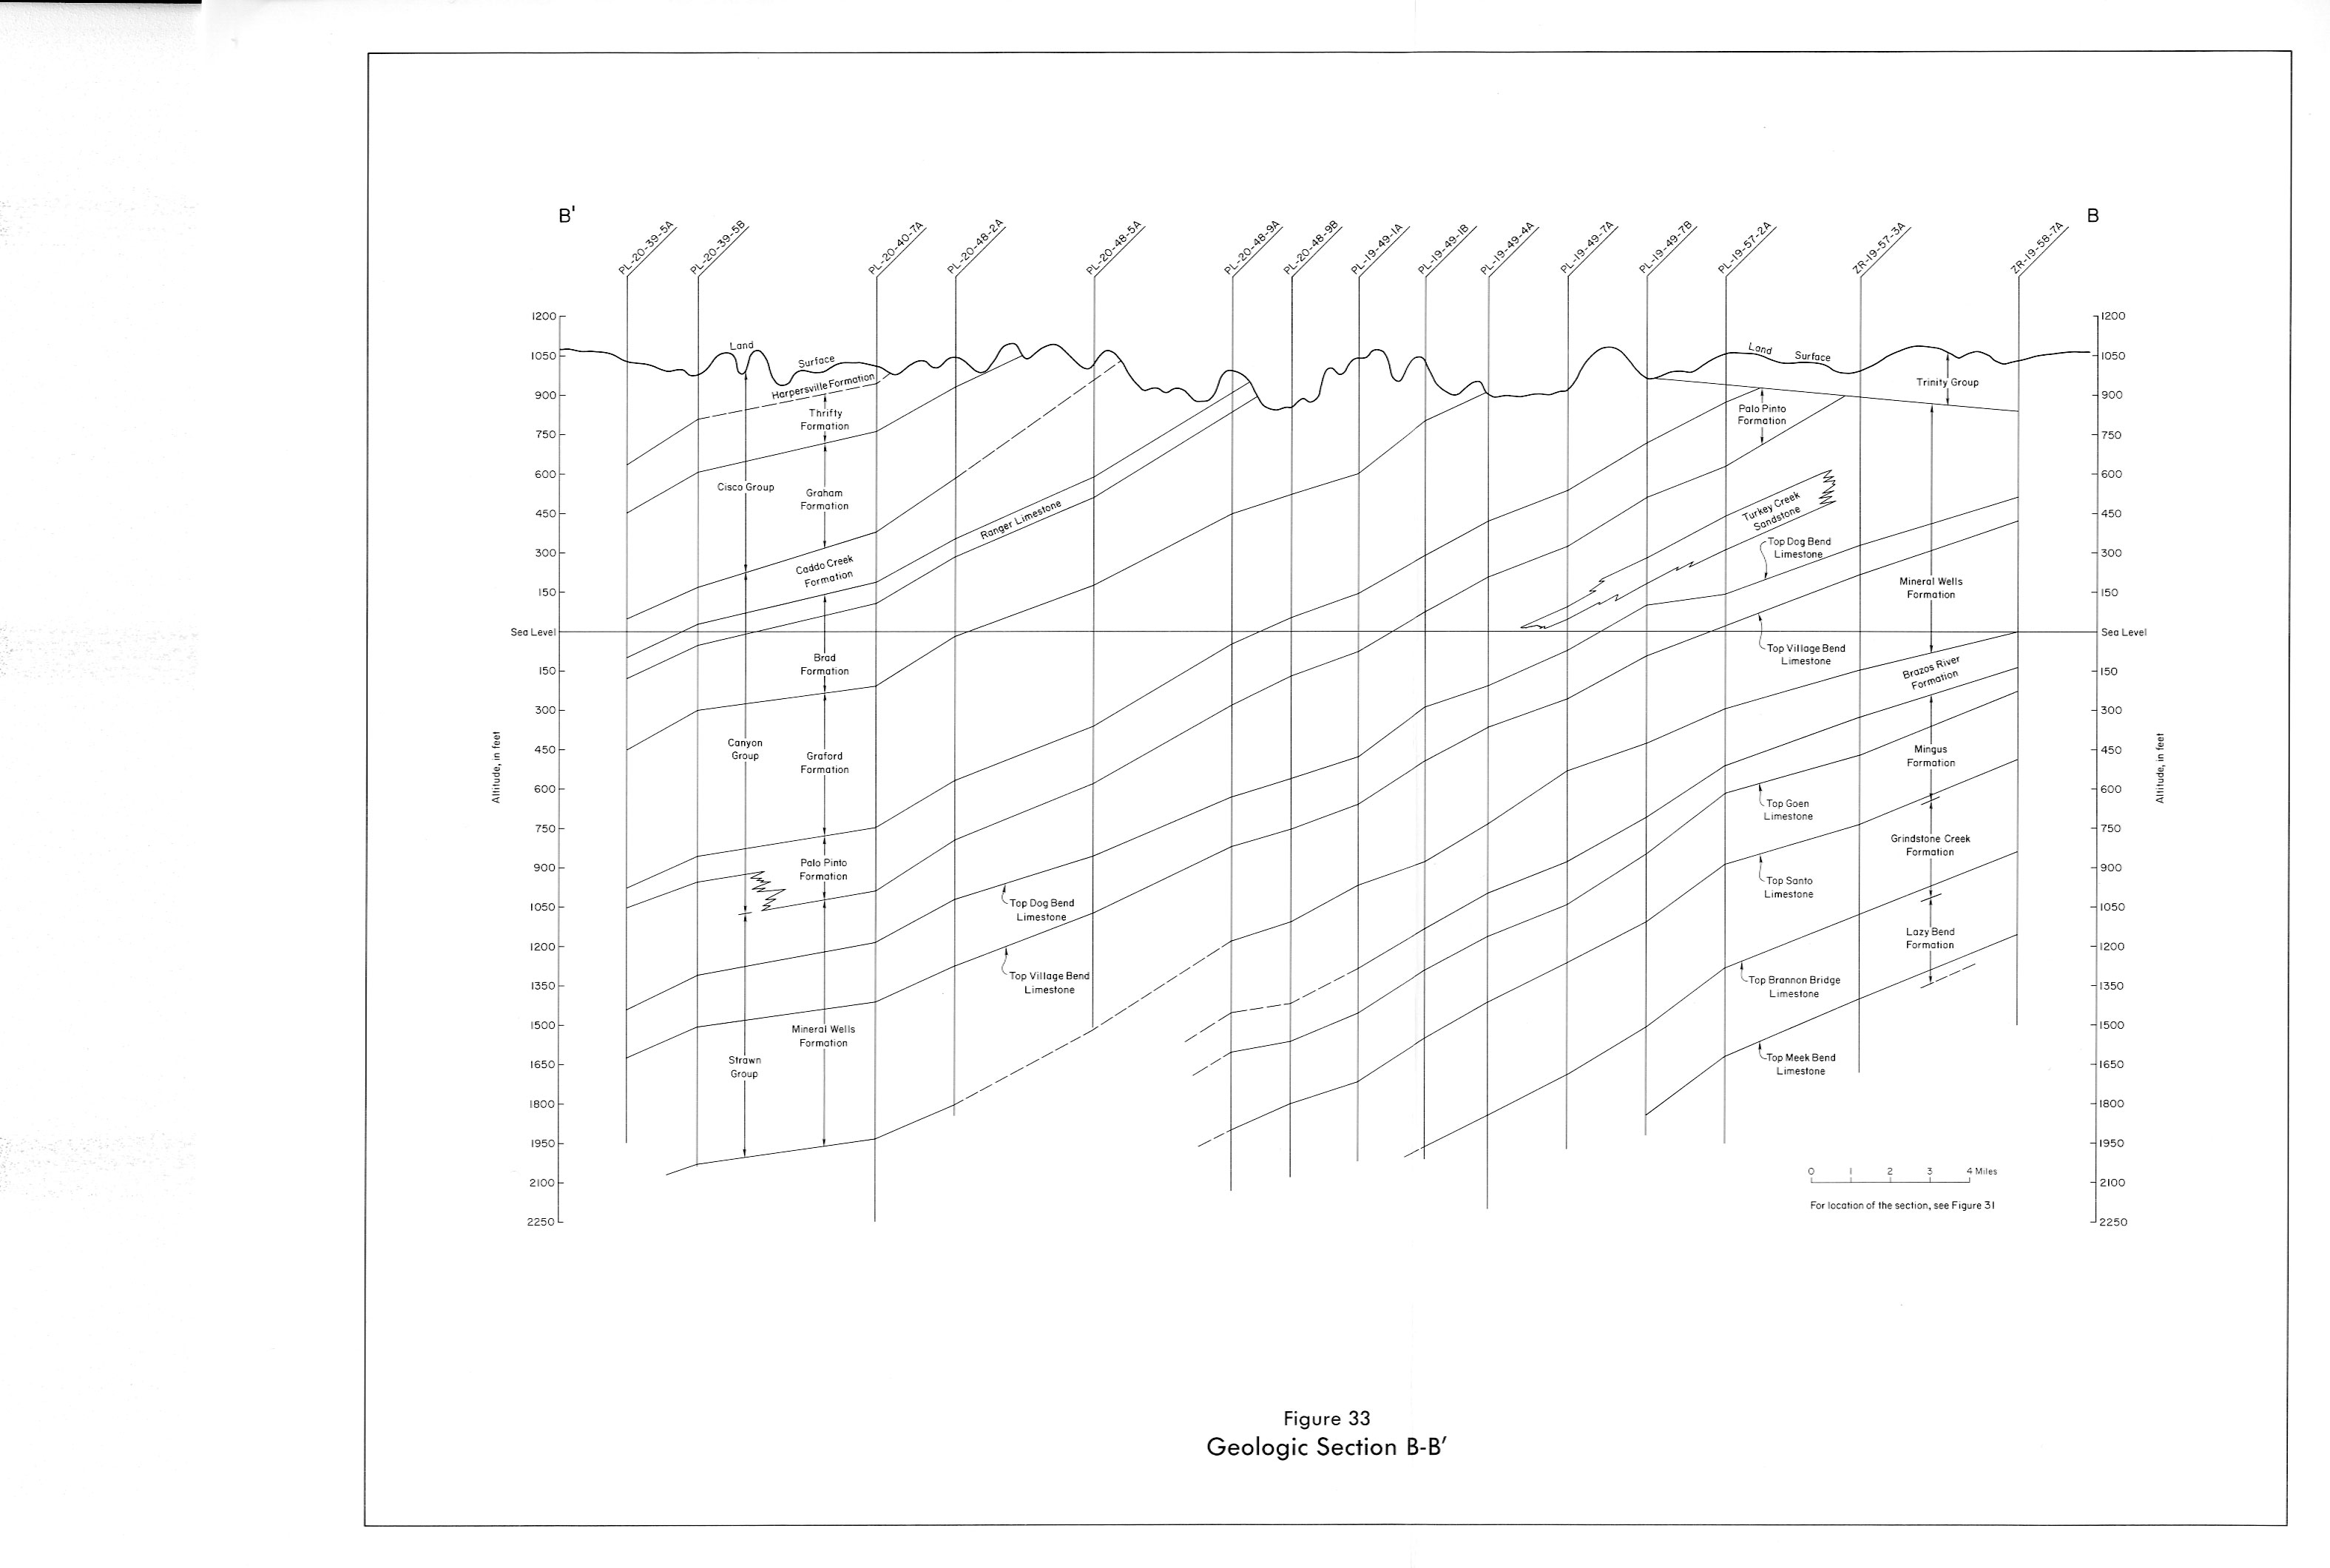
- Figure 33: Geologic section B-B'
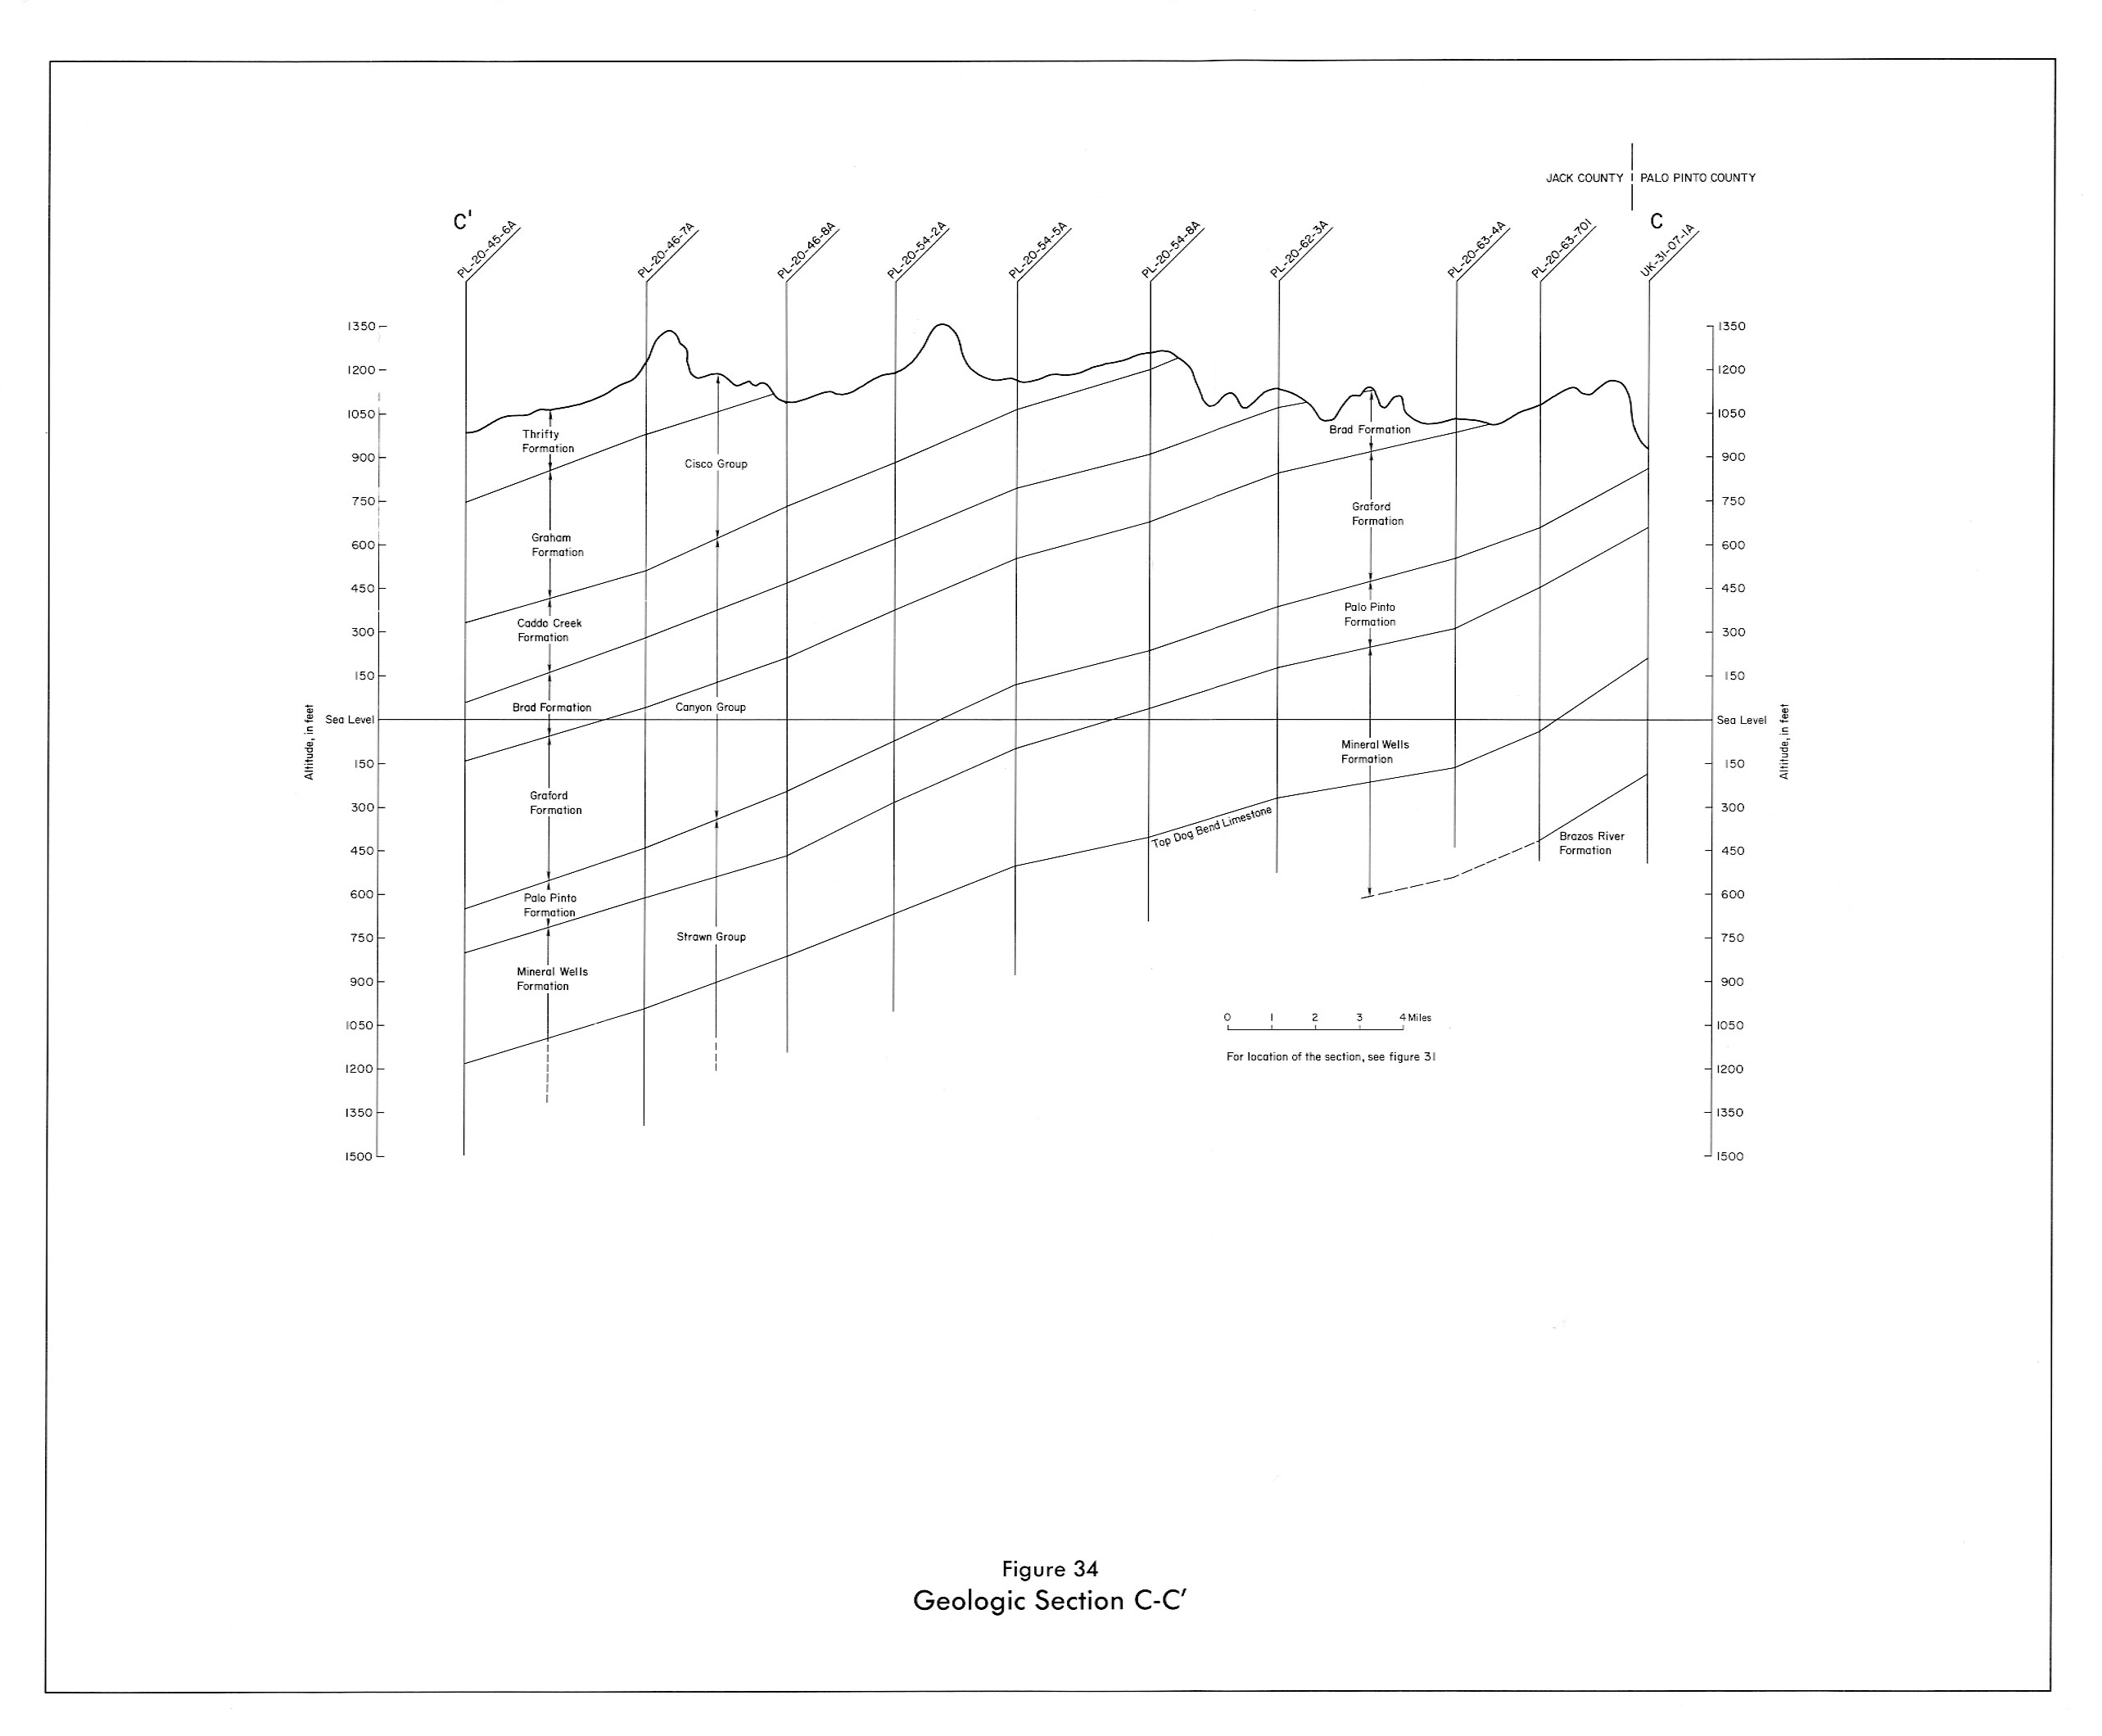
- Figure 34: Geologic section C-C'
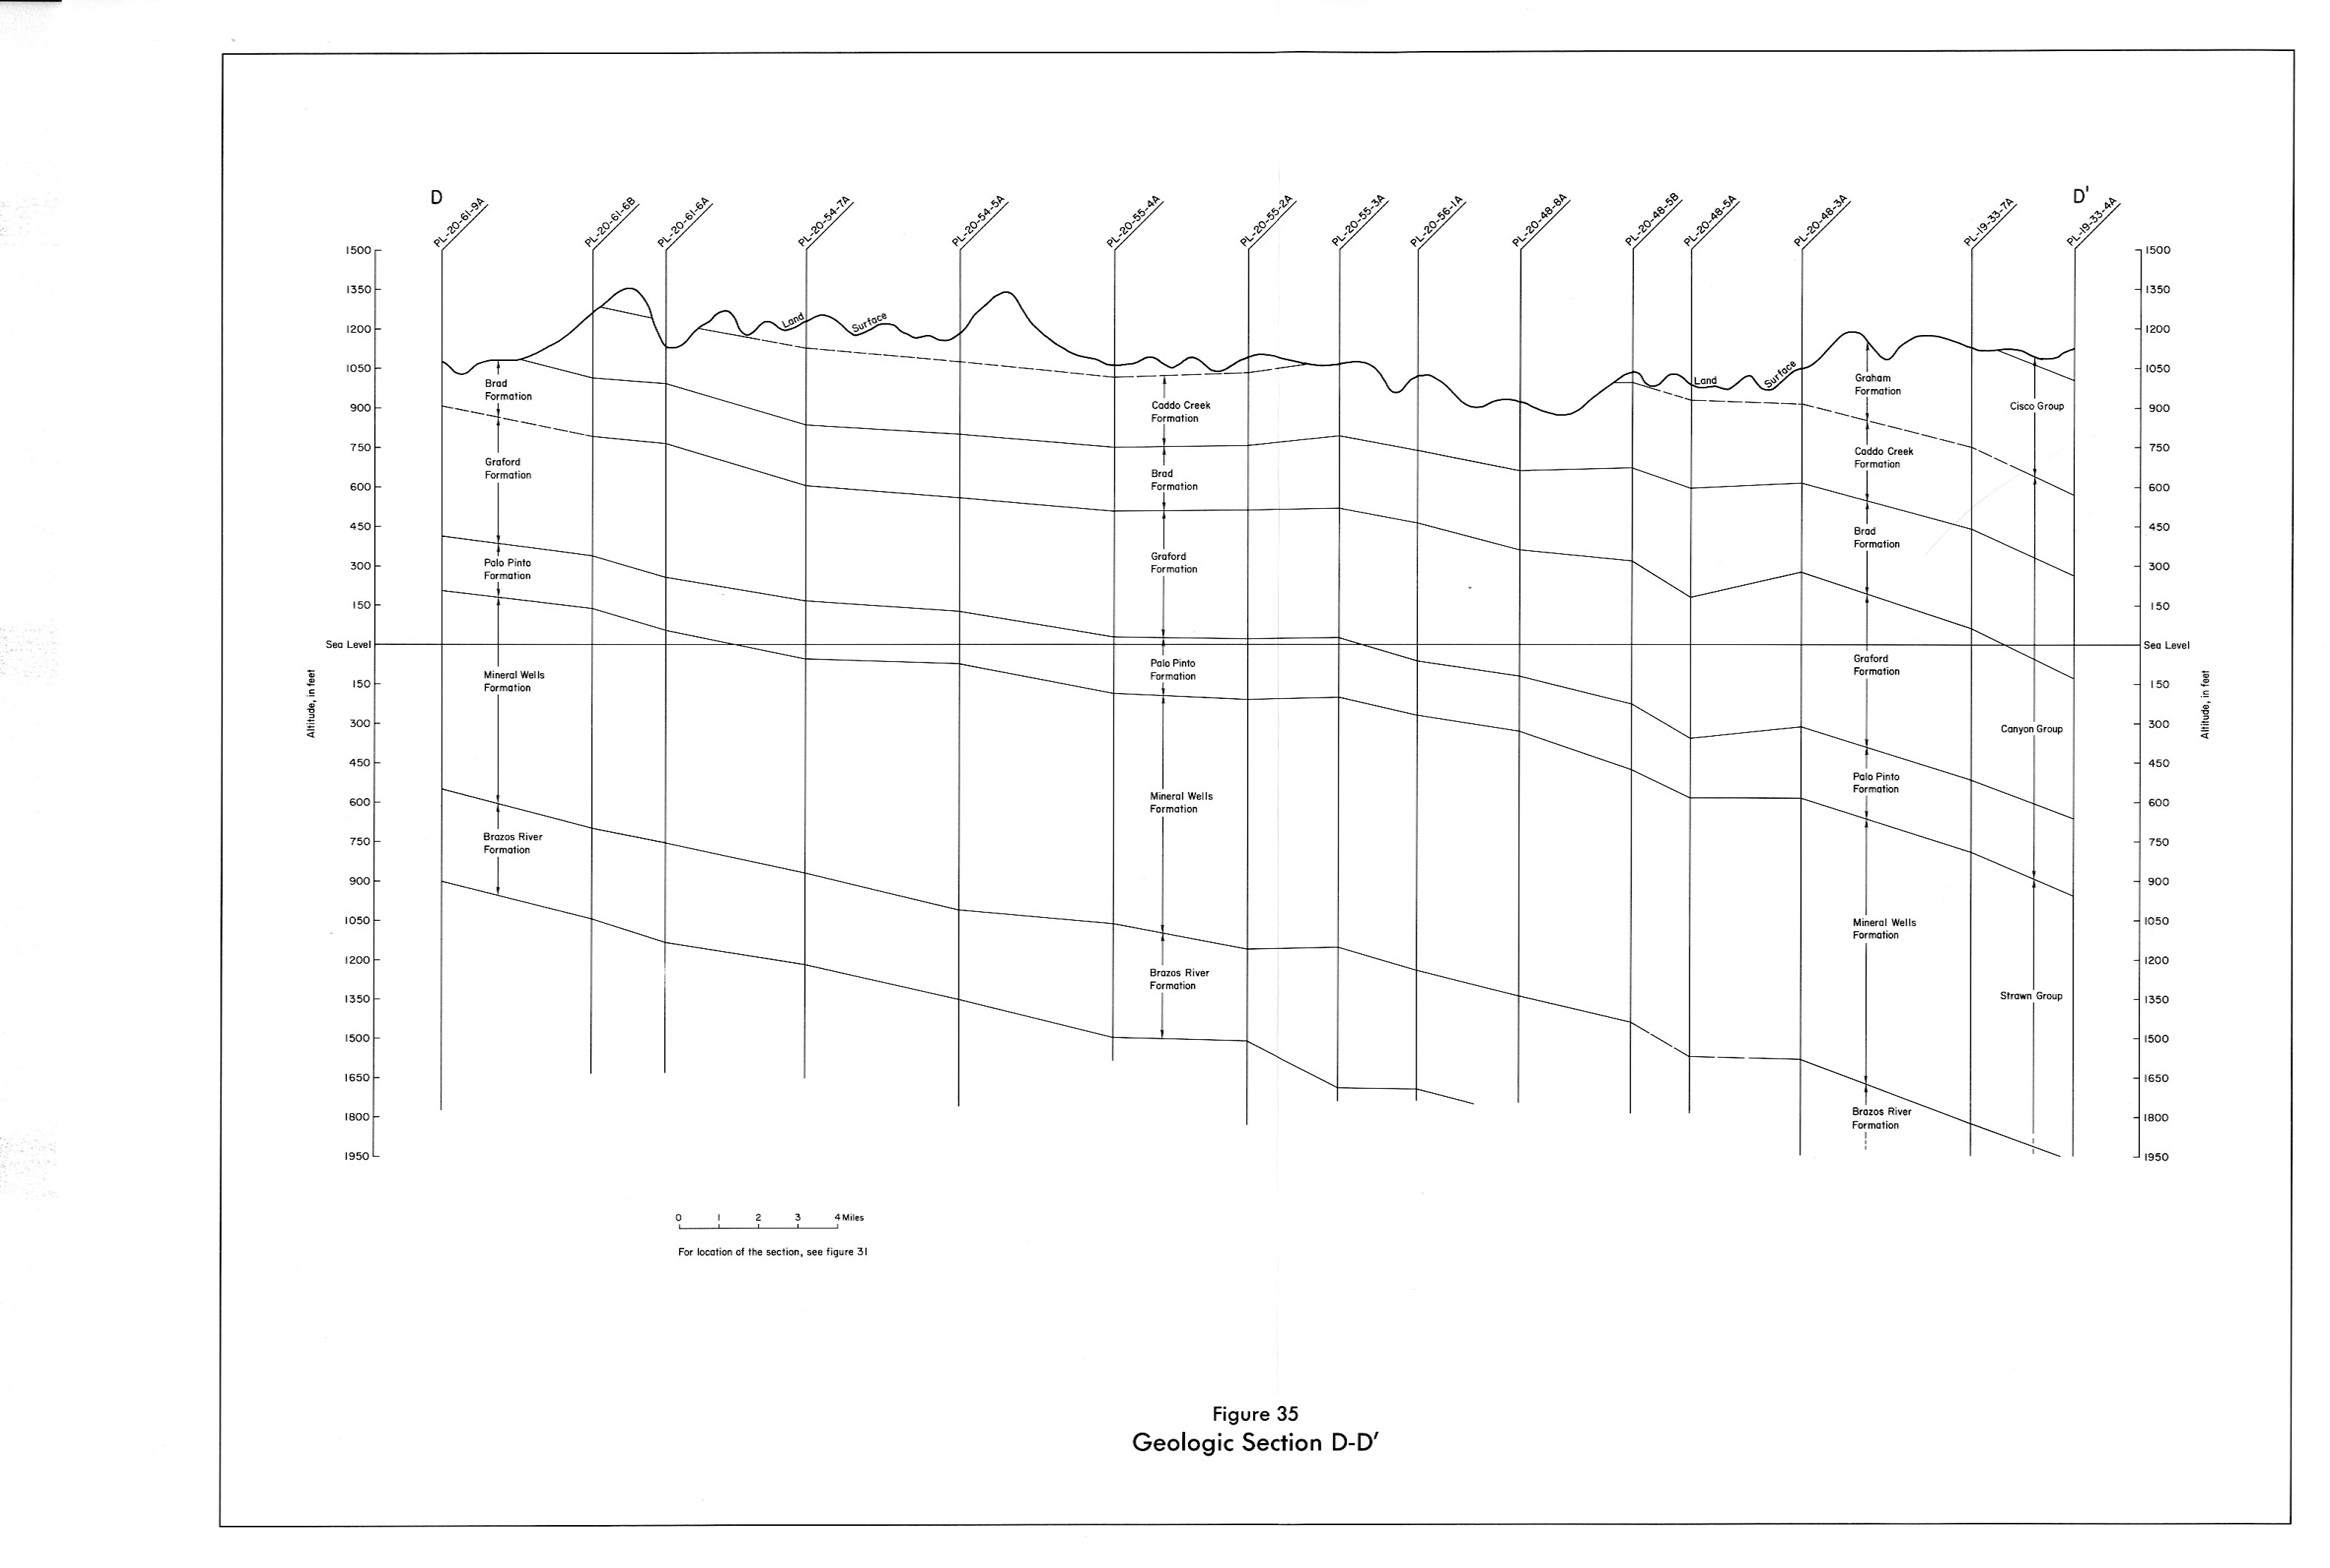
- Figure 35: Geologic section D-D'