Sample Products
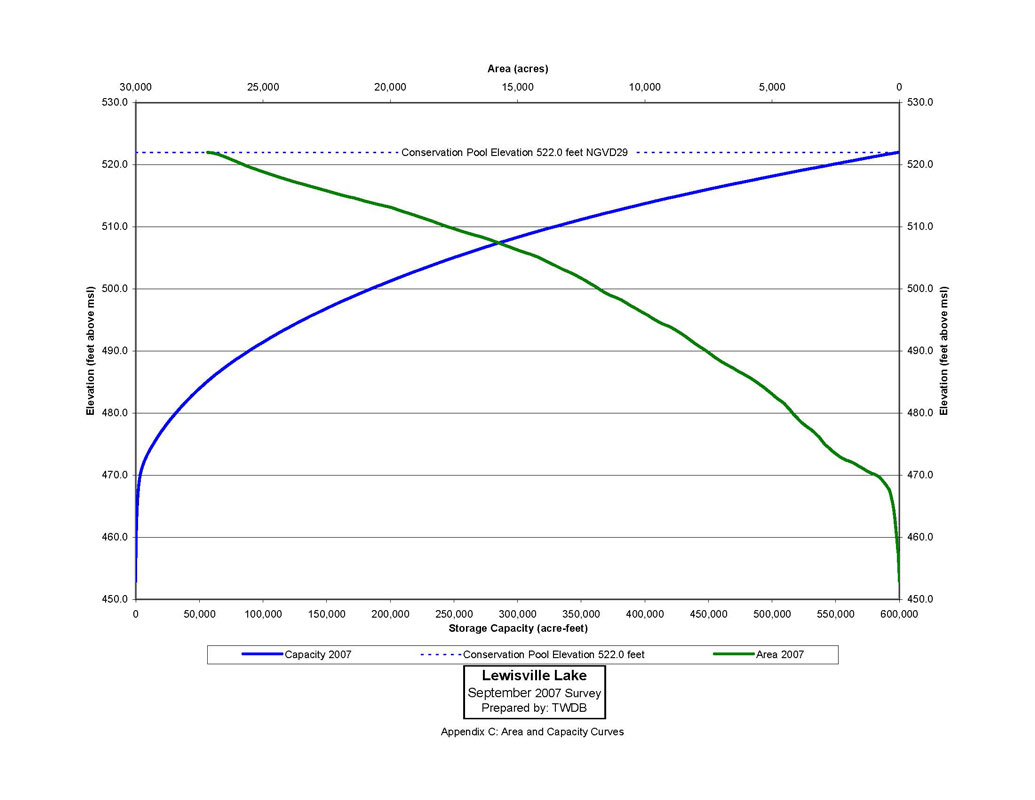
Elevation-Area-Volume Tables and Graph
The primary purpose for conducting a hydrographic survey is to determine current reservoir capacity. The TWDB provides updated area-capacity tables at 0.1-feet increments in elevation.
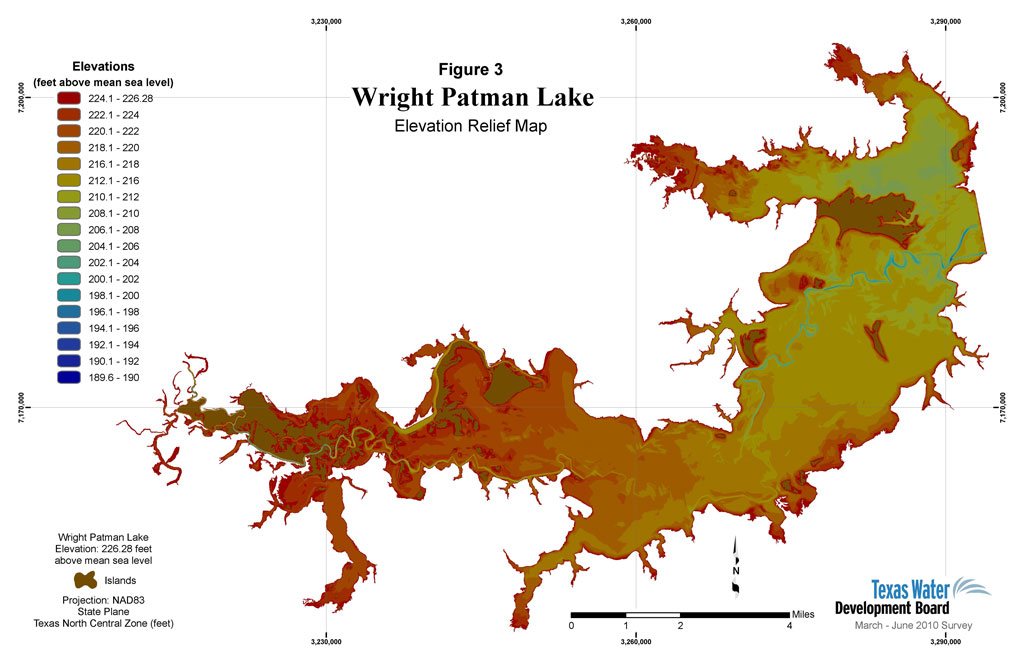
Elevation Relief Map
This view of the reservoir describes the bathymetry as color coded blocks by reservoir elevation.
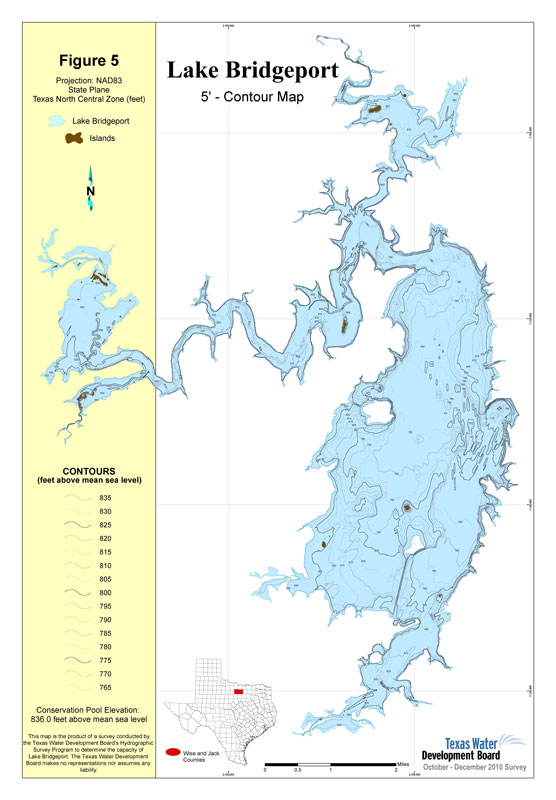
Contour Map
Bathymetric contours are extracted from the raster representation of the reservoir TIN model using ArcGIS. Contour increments vary from 1 to 10-feet depending on the size, shape, and overall depth of the reservoir.
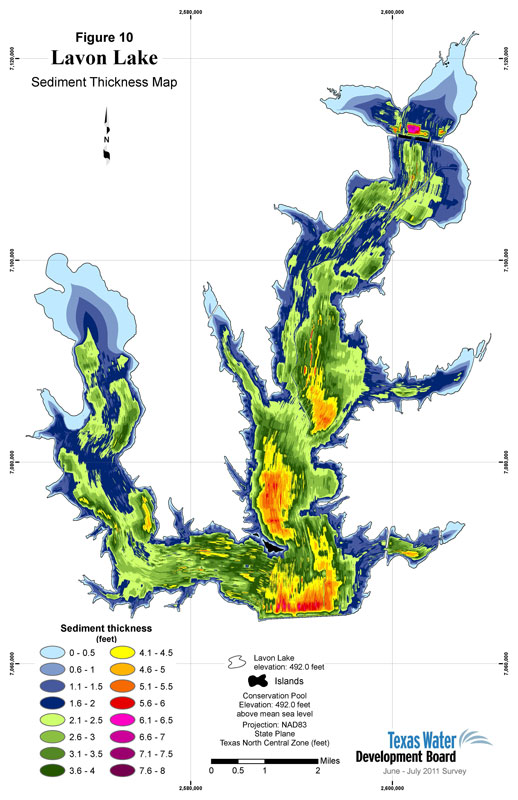
Sediment Thickness Map
This map is produced for sedimentation surveys only and illustrates the location of sediment accumulation in the reservoir by thickness.
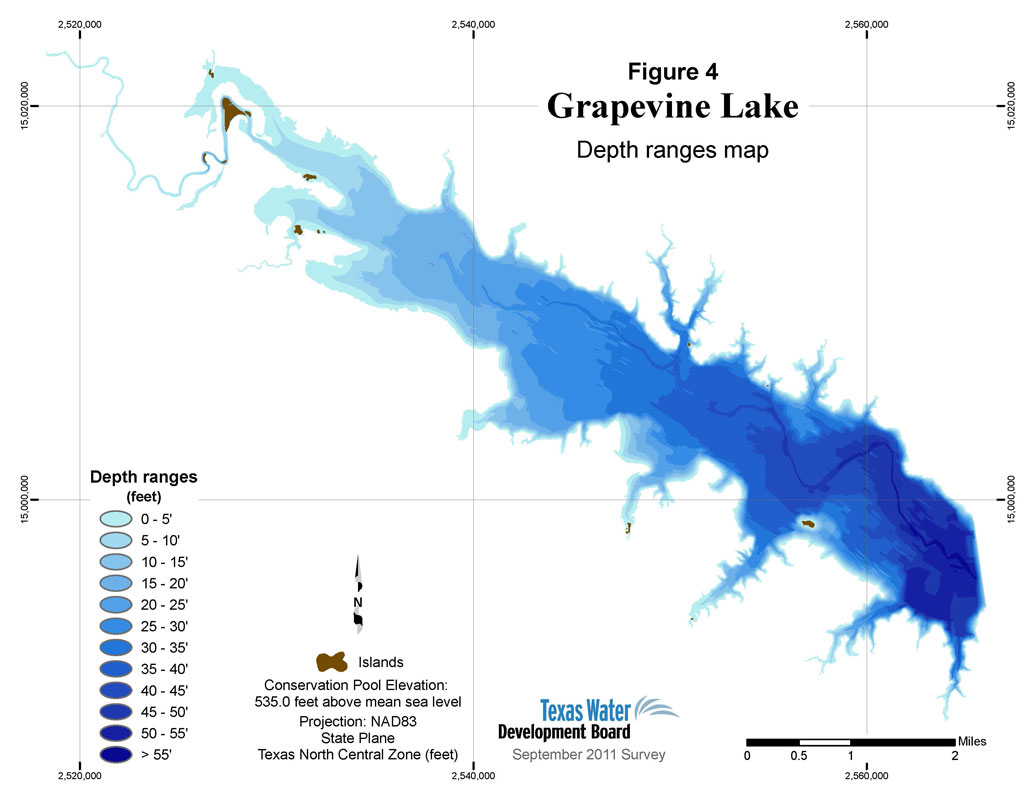
Depth Range Map
This view of the reservoir describes the bathymetry as color coded blocks by reservoir depth.